DOI: 10.12928/TELKOMNIKA.v11i4.1641 855
Streamed Sampling on Dynamic data as Support for
Classification Model
Astried Silvanie*1, Taufik Djatna2, Heru Sukoco3
1,3
Departemen Ilmu Komputer, Institut Pertanian Bogor
2Departemen Teknologi Industri Pertanian, Institut Pertanian Bogor
Jalan Meranti, Kampus Darmaga, Gedung Fakultas MIPA, Wing 20 Level 5/6 Bogor 16680 *Corresponding author, email: [email protected], [email protected],
Abstrak
Data mining terhadap data yang selalu berubah mempunyai kendala seperti ukuran data yang tidak diketahui dan distribusi kelas selalu berubah. Metode sampel acak umum digunakan untuk mengekstrasi sinopsis dari basis data yang sangat besar. Pada penelitian ini algoritma Vitter reservoir digunakan untuk mengambil sebanyak k data dari basis data untuk dimasukkan ke sampel. Sampel digunakan sebagai masukan proses klasifikasi di data mining. Jenis sampel adalah backing sample yang tersimpan sebagai tabel berisi id, prioritas dan waktu. Prioritas menunjukkan probabilitas data akan dipertahankan dalam sampel. Kullback Liebler divergence digunakan untuk mengukur kemiripan distribusi antara populasi dan sampel. Dari hasil penelitian, kami dapat secara terus menerus mengambil sampel secara acak ketika terjadi transaksi terus menerus. Nilai Kullback Liebler yang sangat baik untuk mempertahankan kemiripan distribusi antara populasi dan sampel berkisar antara 0 sampai dengan 0.0001. Hasilnya sampel selalu terbaharui atas transaksi baru dan mempunyai distribusi kelas yang mendekati populasi. Pengklasifikasi yang dibentuk dari data dengan distribusi seimbang, mempunyai kinerja lebih baik dari yang dibentuk dari data dengan distribusi tidak seimbang.
Kata kunci: sampel acak, entropi relatif, kemiringan, kullback liebler divergence, klasifikasi dinamis
Abstract
Data mining process on dynamically changing data have several problems, such as unknown data size and changing of class distribution. Random sampling method commonly applied for extracting general synopsis from very large database. In this research, Vitter’s reservoir algorithm is used to retrieve k records of data from the database and put into the sample. Sample is used as input for classification task in data mining. Sample type is backing sample and it saved as table contains value of id, priority and timestamp. Priority indicates the probability of how long data retained in the sample. Kullback-Leibler divergence applied to measure the similarity between database and sample distribution. Result of this research is showed that continuously taken samples randomly is possible when transaction occurs. Kullback-Leibler divergence with interval from 0 to 0.0001, is a very good measure to maintain similar class distribution between database and sample. Sample results are always up to date on new transactions with similar class distribution. Classifier built from balance class distribution showed to have better performance than from imbalance one.
Keywords: random sample, relative entropy, skewness, kullback liebler divergence, dynamic classification
1. Introduction
data distribution and machine learning [10-15]. This issue was not touched in the previous researches [1-9]. Even though random sampling method can make class distribution on sample not the same as on database.
Data set is called imbalance data set if class distribution among classes is not equal [10-15]. If one of class has very large proportion than other classes then it is called skewed data set. The class, which has the largest distribution, is called majority class and the others are called minority class. The effect of imbalance data set is classification model tend to be good predicator for majority class but tend to fail to predict minority class. Previous researches [10-15] were concern on how to resolve imbalance data set to pursue good performance. Contradict to those researches, this research aim to preserve similar class distribution to make sure that sample represents database. This similar data distribution can be showed in equation 1. Where value of mpi is the occurrence of class i in population. Values of mqi is the occurrence
of class i in sample. Value of np is the number of records in population and ns is the number of records in sample.
i i
mp
mq
np
ns
(1)This research suggested methods for mining dynamic data while preserving similar class distribution between sample and database. Several random sampling techniques are used for extracting synopsis from database. The size of sample is constant and denoted by k. At initialization time, data from database were pulled off using Vitter reservoir algorithm [8] and then put it in backing sample. Backing sample is a sample for keeping an up to date data and suitable for handling deletion process [4-5]. When a transaction performs a deletion on certain data then that same data in sample must be removed. Kullback Liebler divergence is used to preserve same class distribution between sample and database. On certain interval value, kullback divergence is proved success to maintain similar class distribution between sample and database. Sample data as input for classification task resulted decision tree model. Several metrics based on confusion matrix were used to measure performance of balance and imbalance data. The metrics showed balance class distribution is better as classification model than imbalance one.
2. Research Method 2.1. Sampling Process
Database contains whole data is population of sample. The sampling process retrieves k tuples randomly from database to be inserted to sample denoted as S. It is important which our sample contains up to date data. To maintain this we use backing sampling technique and use backing sample type like in Gibbon’s research [5]. Backing sample contains random sample data from database and it is always up-to-date in the presence of transaction in database. These transactions in database are insertion, update and deletion. Tuple represent a row in database. We model backing sample contains with tuples as BS = {e1,…,ek}. For making it more efficient, we only save tuple id denotes idi and priority denotes pi and timestamp denotes ti. So each tuple in sample contains ei = {idi, pi, ti}. Priority is random real value between 0 and 1 which is given on each arriving tuples in sample [4]. Tuple with lowest priority has the bigger chance to be removed from sample when transaction occurs. For retrieving complete tuple for complete sample S, we use inner join query:
SELECT Relation.* FROM Relation INNER JOIN BackingSample WHERE Relation.id = BackingSample.id.
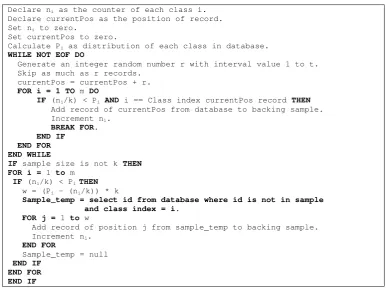
At initialization time, backing sample contain no records. Vitter’s reservoir sampling algorithm is used to retrieve k tuple randomnly from sample [8]. In this research we made algorithm based on Vitter’s reservoir sampling with an addition. The addition is to preserve same class distribution between database and sample. Pseudocode below explains the detail logic of it.
has to rescan database again to fill sample if current sample size is below k tuples. This rescan process only conducted on tuple that not in backing sample. After initialization phase, backing sample has k number of tuples with same class distribution as database.
Declare ni as the counter of each class i.
Declare currentPos as the position of record.
Set ni to zero.
Set currentPos to zero.
Calculate Pi as distribution of each class in database.
WHILE NOT EOF DO
Generate an integer random number r with interval value 1 to t. Skip as much as r records.
currentPos = currentPos + r.
FOR i = 1 TO m DO
IF (ni/k) < Pi AND i == Class index currentPos record THEN
Add record of currentPos from database to backing sample.
Increment ni.
BREAK FOR.
END IF
END FOR END WHILE
IF sample size is not k THEN
FOR i = 1 to m
IF (ni/k) < Pi THEN
w = (Pi – (ni/k)) * k
Sample_temp = select id from database where id is not in sample and class index = i.
FOR j = 1 to w
Add record of position j from sample_temp to backing sample.
Increment ni.
END FOR
Sample_temp = null
[image:3.595.111.498.138.430.2]END IF END FOR END IF
Figure 1. Pseudocode of the random sampling for initialization of backing sample
(
_
_
_
_
1 )
t
floor size of
database size of
sample
(2)
2.2. Kullback Liebler Divergence
Kullback-Leibler divergence is a non-symmetric difference measurement between two probability distributions p and q [16]. The reason for this measurement is one of the probability distribution can serve as a measure of goodness of fit of the other distribution [16]. Kullback-Leibler Divergence of q from p denotes DKL(p || q)is a measure of information lost when q is used to approximate p. Value of p represents true distribution of data. Value of q represents approximation of p. Kullback-Liebler (KL) divergence is used to show how close probability of class distribution p = {pi} is to class distribution model q = {qi}. Where p is population, q is sample and
i
is the class index. KL divergence forl
number of classes is explained in below equation:2 1
( || )
llog
iKL i i
i
p
D
p q
p
q
(3)If
p
imp
np
andq
imq
nq
then KL divergence can be defined as2 1
( || )
l ilog
iKL i
i
mp
mp np
D
p q
np
mq nq
In this research, we only use data set with binary class for classification task. This means that class only has two values so value of l is two.
Insertion and deletion transactions will change class distribution. These two transactions change value of pi to
p
i' and value of qi toq
i'. To preserve the closeness between population and sample, the accepted value of KL divergence has to be approximated to zero or between 0 and 1. The logic detail for maintaining class distribution is explained below:a) Insertion process of a tuple of class j will change population distribution as in equation. If the value of Kullback Liebler divergence is between particular intervals then there is no need to change class distribution on sample. As the opposite, there is a need to change class distribution on sample. This change is done by adding a tuple of certain class k and reducing a tuple from other class in sample. This process explains in below:
'
1
1
1
i i imp
i
j
np
p
mp
i
j
np
'1
1
i i imq
i
k
nq
q
mq
i
k
nq
(5)b) Deletion process of a tuple of class j will change population distribution as in equation . If the value of KL divergence is between KLinterval then there is no need to change class distribution on sample. As the opposite, there is a need to change class distribution on sample. This change is done by reducing a tuple of certain class k and adding a tuple from other class in sample. This process explain below.
'
1
1
1
i i imp
i
j
np
p
mp
i
j
np
'1
1
i i imq
i
k
nq
q
mq
i
k
nq
(6)2.3. Implementation in Database
All data in database saved in one table master. This table must have an unique primary key column as an identification of each tuple and it denotes id. Backing sample represented as a table in database. Column id in backing sample is a primary key and it has the same value as column id in table master. Trigger object in database is used to detect transaction on table master. Insertion transaction will alert insert trigger. Update transaction will alert update trigger. Deletion transaction will alert delete trigger. Algorithm for insertion, update and deletion wrote in a stored procedure. For initialization of backing sample, Figure 1 wrote in a stored procedure. This stored procedure will be executed first time to fill backing sample. Value of k is index of class of current transaction on database. Value of p1 and p2 are probability distribution of positive and negative class in population. Value of d1 and d2 are probability distribution of positive and negative class in sample.
(1) Initialization process executes pseducode . The result is a full backing sample with same class distribution as population.
(2) When new tuple of class k is inserted in table master, insert trigger executes stored procedure for insertion. This tuple will change distribution of class k in table master. For
i
k
then change value of di to di di1 . Fori
k
then change value of di to1
i i
d d . Calculate KL divergence after those changes. If KL divergence is positive then insert new tuple of class k in to sample and remove the lowest priority tuple of opposite class from sample. If KL divergence is negative then for
i
k
then change value of di to1
i i
remove the lower priority tuple of class k from sample. If KL divergence still not positive then it means that class distribution in population does not effect on class distribution in sample. If this condition is true, then insert new tuple of class k in to sample and remove the lowest priority tuple of same class from sample. This act will renew data content in sample.
(3) When a tuple of class k is deleted in table master, delete trigger executes stored procedure for deletion. This tuple will change distribution of class k in table master.
(a) If deleted tuple is in sample then delete that tuple from sample. This makes class distribution in sample change. We need to replace that deleted tuple in sample. There two choices, replaces it with a tuple of same class or different class. If we choose to replace it with same class then for
i
k
change value of di to di di1 and fori
k
the value is not change. Calculate KL divergence after those changes. If KL divergence is positive then insert tuple of class k as replacement for tuple that has deleted from sample. If KL divergence is negative, then fori
k
change value of di to1
i i
d d and for
i
k
the value is not change. Calculate KL divergence after those changes. If KL divergence is positive then insert tuple of opposite class as replacement for tuple that has deleted from sample.(b) If deleted tuple is not in sample then it means class distribution in sample not change. Calculate KL divergence. If KL divergence is negative For
i
k
then change value of1
i i
d d . For
i
k
then change value of di to di di1. Calculate KL divergence after those changes. If KL divergence has positive value then remove tuple of class k from sample and insert new tuple of opposite class in to sample. If KL divergence is negative then fori
k
then change value of di di 1 and fori
k
then change value of di di1 then calculate KL divergence. If KL divergence is positive, then remove tuple of opposite class k with the lowest priority from sample and insert tuple of class k in to sample.
(4) Update process will change the priority of that tuple if it is in sample.
2.4. Testing Method 2.4.1. Data Test
In testing, data was generated randomly mimic pattern in Pima Diabetes dataset. To do this, first find minimum and maximum value for each feature in Pima Diabetes dataset. The randomize method generated data for each feature with interval between minimum and maximum value. Equation 7 defines the randomize method clearly. i defines feature index in database.
f
i
randomize between
_
(min( )
f
i
max( ))
f
i (7)Data set in this research is only having two values of class, which is positive and negative. In Pima Diabetes, if patient is not positively has diabetes then class value is one, otherwise is zero. Class with one value is negative class and class with zero value is positive class.
For mimicking dynamic transaction, a program is built for doing insertion, deletion and update transactions to database. At each one hundred transaction that has been done, some information are saved. This information is Kullback Liebler divergence value, data size, entropy of population and population of sample, complete sample. Sample at each 100 transactions will be as input for classification task. The result from classification task is decision tree model. WEKA software is used to do classification task with classifier type C4.5 (J48).
2.4.2. Evaluation Metric
We analyze how good sample approximate population with entropy. The equation for entropy is defined in equation 8.
2 1
log
l
i i
i
e
p
p
The most common metric to assess overall classification performance which imbalance data set is ROC analysis [15]. ROC analysis based on confusion matrix in table 1. For measuring positive class and negative classes independently, these metrics below are used. False Negative Rate (FN Rate) is the percentage of positive class misclassified as
belonging to negative class.
_
(
)
FN
rate
FN TP
FN
(9) False Positive Rate (FP Rate) is the percentage of negative class misclassified as belonging to positive class.
_
(
)
FP rate
FP TN
FP
(10) True Negative Rate (TN Rate) is the percentage of negative class correctly classified as negative class.
_
(
)
TN
rate
TN TN
FP
(11) True Positive Rate (TP Rate) is the percentage of positive class correctly classified as positive class.
_
(
)
TP rate
TP TP
FN
(12)Table 1 Confusion Matrix
Positive Prediction Negative Prediction Positive Class True Positive (TP) False Negative (FN) Negative Class False Positive (FP) True Negative (TN)
3. Results and Analysis
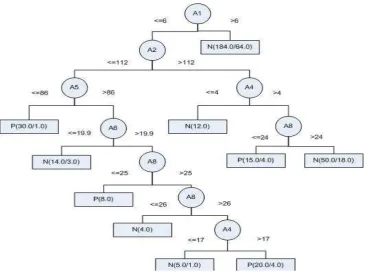
We deployed random sampling with priority value and backing sampling for maintaining up to date sample. Random sampling extracted synopsis from the whole database content. With using sampling method, we do not have to rescan the whole database again. Classification task is conducted on sample. Priority value applies on each tuple in sample. When process need to remove a tuple from sample, it chooses the tuple with lowest priority value. Priority random sampling and backing sampling proved to be able to maintain fresh up to date data in sample. Timestamp value in data always up to date most recent and new id appear in sample. Sample is as input for classification task. WEKA software is used to do classification task that resulted decision tree model as classifier. Figure 1 and 2 show that decision tree after 500 transactions and 1000 transactions are different. The reason is that content in sample always up to date when new transactions occur. It shows that techniques that we applied can make sample content always up to date.
Kullback Liebler divergence values resulted in this testing showed value approximately to zero. The minimum value is 0.000001022937113 and maximum value is 0.000061507380451. The interval value of Kullback Liebler divergence is 0 to 0.0001. This interval value is good to preserve class distribution as it shows that database and sample have same entropy. The entropy value between sample and population is similar in one-digit precision as it shows in table 2. This showed that class distribution between sample and database is similar.
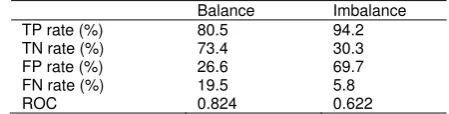
26.6% of negative class. Balance data set model and imbalance data set model have ROC value 0.844 and 0.622. It means in overall, balance data set model has better performance than imbalance data set model.
Table 2. Comparison entropy, data size (Mega Bytes) and number of transactions between sample and population
Number of new transactions
Data Size (Mega Bytes)
Entropy of population
Entropy of sample
Kullback-Liebler Divergence
100 0.02 0.948742 0.95001 0.000008286449884 200 0.04 0.963099 0.961338 0.000021078238206 300 0.06 0.970841 0.971179 0.000001022937113 400 0.08 0.993117 0.994169 0.000043754822400 500 0.1 0.999912 0.999989 0.000036685582018 600 0.12 0.999944 0.999901 0.000006268978723 700 0.14 0.995797 0.995141 0.000023935101126 800 0.16 0.989157 0.990723 0.000061507380451 900 0.18 0.99022 0.990723 0.000016752503143 1000 0.2 0.989603 0.989396 0.000001049382945
[image:7.595.117.483.187.740.2]Figure 1. Decision Tree model after 500 transactions
[image:7.595.118.486.461.734.2]Table 3. Performance Evaluation for decision tree model from balance data set and imbalance data set
Balance Imbalance
TP rate (%) 80.5 94.2 TN rate (%) 73.4 30.3 FP rate (%) 26.6 69.7 FN rate (%) 19.5 5.8
ROC 0.824 0.622
4. Conclusion
In this research, we applied Vitter’s reservoir random sampling for sample initialization sample and it could retrieve initial sample with fixed size. To make sample accommodated changes in database, we used backing sample and backing sampling method. This type of sample contains tuple id, priority value and timestamp. When a tuple is updated, backing sampling method searched that tuple in backing sample by tuple id and applied changes to sample. As new transactions occured, content in sample changed and decision tree model changed. The Kullback Liebler divergence with interval value 0 to 0.0001 value is good to maintain same class distribution between sample and population.
References
[1] Braverman V, Ostrovsky R, Zainolo C. Optimal Sampling from Sliding Window. Proceedings of the twenty-eighth ACM SIGMOD-SIGACT-SIGART symposium on Principles of database systems. 2009: 147-156.
[2] Byung-Hoon P, George O, Nagiza F S. Sampling streaming data with replacement. Computational Statistics & Data Analysis. 2007; 52(2): 750-762.
[3] Ferrandiz S, Boulle M. Supervised selection of dynamic features, with an application to tellecomunication data preparation. Proceedings of the 6th Industrial Conference on Data Mining conference on Advances in Data Mining: applications in Medicine, Web Mining, Marketing, Image and Signal Mining. 2006: 239-249.
[4] Gemulla R, Lehner W. Sampling time-based sliding windows in bounded space. In Proc. of the 2008 ACMSIGMOD Intl. Conf. on Management of Data. 2008: 379–392.
[5] Gibbons P B, Matias Y, Poosala V. Fast incremental maintenance of approximate Histograms. In Proc. VLDB. 1997: 466–475.
[6] Hoi S C H, Wang J. Zhao P. Rong J. Online Feature Selection for Mining Big Data. Big Mine’12, Proceeding of the 1st international workshop on big data, streams, heterogenous sources. 2012: 93-100.
[7] Nasereddin H H. O. Stream Data Mining. International Journal of Web Applications (IJWA). 2009: 1(43).
[8] V. Jefrey S. Random Sampling with a Reservoir. ACM Transactions on Mathematical Software (TOMS). 1985: 11(1): 37-57.
[9] Wang Y, Liui S, Feng J, Zhou L. Mining naturally smooth evolution of clusters from dynamic data. SIAM International Conference on Data Mining - SDM. 2007.
[10] Chawla, N. Data Mining for Imbalanced Datasets: An Overview. Data Mining and Knowledge Discovery Handbook. 2010: 875-886.
[11] Haibo H, Edwardo A G. Learning from Imbalanced Data. IEEE Transactions on Knowledge and Data Engineering. 2009; 21(9).
[12] Jason Van Hulse, Taghi M Khoshgoftaar, Amri Napolitano. Experimental Perspective on Learning from Imbalanced Data. ICML’07 Proceedings of the 24th International Conference on Machine Learning. 2007: 935-942.
[13] Tang L, Liu H. Bias analysis in text classification for highly skewed data. ICDM ’05: Proceedings of the Fifth IEEE International Conference on Data Mining. 2005:781–784.
[14] Prati R C, Batista G E A P A, Monard MC. A Study with Class Imbalance and Random Sampling for a Decision Tree Learning System. Artificial Intelligence in Theory and Practice II. 2008; 276: 131-140. [15] Xinjian Guo, Yilong Yin, Cailing Dong, Gongping Yang, Guangtong Zhou. On the Class Imbalance
Problem. ICNC’08 Fourth International Conference. 2008; 4: 192-201.
[16] Efren A, Tuna E. On some properties of goodness of fit measures based on statistical entropy.