ANALYSIS OF WIND LOADING ON SOLAR PANEL AT DIFFERENT INCLINATION ANGLES IN MALACCA WEATHER CONDITION
NURUL YASMIN BINTI MOKHTAR B041110202
BMCT
Email: [email protected]
Final Report Draft Final Year Project II
Supervisor: DR. MOHD ZAID BIN AKOP
Faculty of Mechanical Engineering Universiti Teknikal Malaysia Melaka
i
SUPERVISOR DECLARATION
“I hereby declare that I have read this thesis and in my opinion this report is sufficient in terms of scope and quality for the award of the degree of Bachelor of Mechanical Engineering (Thermal- Fluids) with Honors”
ii
ANALYSIS OF WIND LOADING ON SOLAR PANEL AT DIFFERENT INCLINATION ANGLES IN MALACCA WEATHER CONDITION
NURUL YASMIN BINTI MOKHTAR
This Report Is Submitted In Partial Fulfillment of Requirement For The Bachelor Degree Of Mechanical Engineering (Thermal-Fluid) With Honors
Faculty of Mechanical Engineering Universiti Teknikal Malaysia Melaka
iii
DECLARATION
“I hereby declare that the work in this report is my own except for summaries and quotations which have been duly acknowledged”
Signature: ____________________
iv
v
ACKNOWLEDGEMENT
Alhamdulillah and praise to Allah with His willingness, this Final Year Project has successfully been done within acquired timeframe. I wish to express my deepest gratitude to my supervisor, Dr. Mohd Zaid Bin Akop for his guidance, advices and information throughout this project.
vi
ABSTRACT
vii
ABSTRAK
viii
TABLE OF CONTENT
CHAPTER TITLE PAGE
SUPERVISOR DECLARATION i
DECLARATION iii
DEDICATION iv
ACKNOWLEDGEMENT v
ABSTRACT vi
ABSTRAK vii
TABLE OF CONTENT viii
LIST OF FIGURE xi
LIST OF TABLE xii
LIST OF ABBREVIATION xiv
NOMENCLATURE xv
CHAPTER 1 INTRODUCTION 1
1.0 Background 1
1.1 Problem Statement 2
1.2 Objective 2
1.3 Score 3
CHAPTER 2 LITERATURE REVIEW 4
2.0 Background 4
2.1 Malaysia Weather Climate 4
2.2 Fluid Mechanic Concept 9
ix
2.2.2 Boundary Layer Type And Thickness 9
2.2.3 Turbulent Wind 11
2.2.4 External Flow : Flow Over Bodies 13 2.3 Previous Case Studies Of Solar Panel 15 2.3.1 Wind Loading On Solar Panel 15
CHAPTER 3 METHODOLOGY 20
3.0 Introduction 20
3.1 Project Flowchart 20
3.2 Determining Tilt Angles 22
3.3 Solar Photovoltaic Panel Ground Mounted Design Concept
24
3.4 Project Component Breakdown 25
3.5 Wind Tunnel 25
3.5.1 MF134D Subsonic Wind Tunnel 26 3.5.2 Dimensional And Similarity Analysis 28 3.5.3 Determining Drag on Wall of Wind
Tunnel Section using Boundary Layer Profile
29
3.5.4 Model Manufacturing Process 30 3.5.5 Experiment Procedure 30 3.6 Computational Fluid Dynamic 32
3.6.1 Geometry Modeling 34
3.6.2 Grid Generation (Meshing) 35 3.6.3 Set Properties, Boundary & Initial
Condition
36
x
CHAPTER 5 CONCLUSION AND RECOMMENDATION 52
5.0 Conclusion 52
5.1 Recommendation and Improvement for Better Result
53
REFERENCES 54
BIBLIOGRAPHY 56
APPENDIX 57
CHAPTER 4 RESULT AND DISCUSSION 38
4.0 Background 38
4.1 Result 38
4.1.1 Computational Fluid Dynamic 39 4.1.2 Wind Tunnel Experiment Result 40 4.2 Visual Display Result Analysis 41 4.2.1 Computational Fluid Dynamic 41
4.2.2 Wind Tunnel 44
xi
LIST OF FIGURE
LIST TITLE PAGE
Figure 2.1 Malaysia Climate change graph for 2010 6 Figure 2.2 Aftermath of violent wind in Pandamaran, Klang 21
October 2014
7
Figure 2.3 Small scale tornado in Kedah 12 November 2014 8
Figure 2.4 Profile of boundary layer 10
Figure 2.5 Turbulent Flow over flat plate 11 Figure 2.6 Example of turbulent wind phenomenon over an obstacle 12 Figure 2.7 Mean velocity contour developed in the simulation 16 Figure 2.8 The air flow around the panel surface and the generation
of resultant pressure coefficient, CLR
18
Figure 3.1 Project Flow Chart 21
Figure 3.2 Solar Altitude and Azimuthal Angle (γ) 22 Figure 3.3 Chosen Solar Panel Ground Mounted Design 24 Figure 3.4 Wind load on solar panel detail project breakdown 25
Figure 3.5 MF134D Subsonic Wind Tunnel 26
Figure 3.6 Speed Control And Indicator Module of Wind Tunnel 26 Figure 3.7 Setting Solar Panel onto the Test Section 31
Figure 3.8 Steps in CFD Simulation 33
Figure 3.9 Description of models in WorkBench 34
Figure 3.10 Meshing of the panel 35
xii
xiii
LIST OF TABLE
LIST TITLE PAGE
Table 1.1 Annual Solar Radiation for Towns in Malaysia 5 Table 3.1 The Value of Properties set in CFD setup 36
Table 4.1 Parameter Condition 38
xiv
LIST OF ABBREVIATION
PV Photovoltaic
CFD Computational Fluid Dynamic
HVAC Heating, Ventilation and Air Conditioning RE Reynold Number
RMS Root-mean-square LES Large Eddy Simulation
NBCC National Building Code of Canada RANS Reynold Average Navier Stoke Equation RNG Re-Normalisation Group
KMK Kompleks Makmal Kejuruteraan ASCE American Society of Civil Engineer SR EN Asociatia de Standardizare din Romania
SIMPLE Semi-Implicit Method for Pressure Linked Equation 2D Two Dimensional
xv
NOMENCLATURE
δ = Boundary layer thickness (m) V = Velocity (m/s)
ρ = Density (kg/m3) γ = Azimuth angle (°) Π = Dependent variable
L = Characteristic length based on shape (m) P = Pressure (Pa)
CL = Lift Coefficient CD = Drag Coefficient FD = Drag Force (N) FL = Lift Force (N)
FR = Summation of drag force and lift force (total force) (N) v = Kinematic viscosity (m2/s)
�� = Shear stress boundary layer A = Planform area (m2)
θ = Momentum thickness of boundary layer k = Turbulent kinetic energy
ε = Dissipation rate of k (eddy dissipation) Aref = Reference area of a structure (m2)
Fw = Wind Force (N)
Cs, CD = Structure Coefficient (Romanian Standard) ρ = Atmospheric Air Density (kg/m3)
xvi
LIST OF APPENDIX
LIST TITLE PAGE
A1 GANTT CHART PSM 1 57
1
CHAPTER 1
INTRODUCTION
1.0 BACKGROUND
Solar energy is the most considerable and abundant energy source in the world and emits approximately 1353W/m2 on to the surface. The world receives 170 trillion kW of solar energy but in portion, 30% of this energy is reflected back to the space, 47% is transformed to heat energy, 23% is used for evaporation cycle, and 0.5% is used in the kinetic energy of the wind, waves and photosynthesis of plants. Photovoltaic system converts sunlight directly into electricity.
2
1.1 PROBLEM STATEMENT
The evaluation and understanding of wind load applied on solar photovoltaic panels are crucial for design purpose as extreme wind event especially cyclone and monsoon season give challenges in designing solar panel. Concerns about structure strength of solar panel to withstand high wind loads has become a priority as aerodynamic forces acting on solar panel can cause serious mechanical damage to the structure which can lead to reduced efficiency. The consumer may subject to unreasonable, costly maintenance and unnecessary replacement.
In the past years, varies of solar-related technologies in the market but number of study exist regarding aerodynamic subject on solar panels especially Malaysia can be considered miniscule. As stated by the Building Research Establishment Digest for British Standard, “there is very little information and no authoritative guidance about wind loads on roof based photovoltaic systems” [Blackmore 2004] .Lack of clear guidelines on wind loading forces the engineers to do assumption of wind load coefficient when designing solar panels using standard that were made for structures like carport, fences, billboard and heating, ventilation and air conditioning (HVAC) units. It resulted in poor safety and uneconomical design.
1.2 OBJECTIVE
I. To investigate the aerodynamic feature on ground mounted solar panel system at different inclination angle.
3
1.3 SCOPE
4
CHAPTER 2
LITERATURE REVIEW
2.0 BACKGROUND
This chapter is a summary of fluid flow concept and previous studies on wind loading on solar panels. Malaysia’s wind conditions in the year of 2014 were introduced in the first section. The fluid mechanics concept of boundary layer and their characteristic also described. Wind tunnel testing and computational fluid dynamics are briefly explained alongside the studies itself which is the wind effect on solar panels are written in the last section of this chapter.
2.1 MALAYSIAN WEATHER CLIMATE
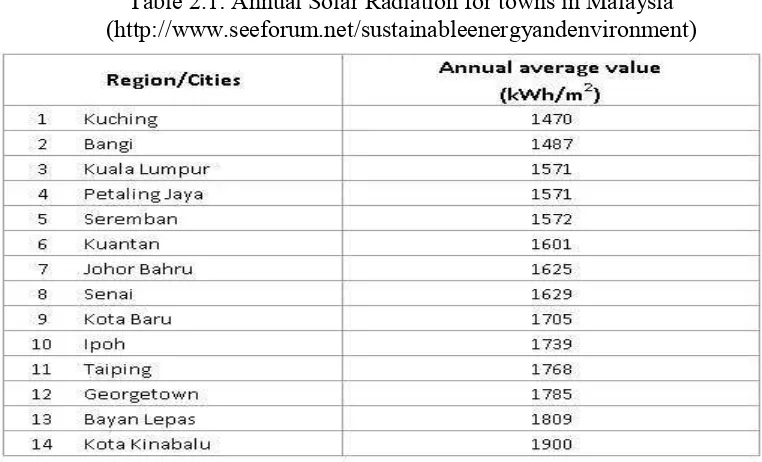
Malaysia is a blessed country located between 1° and 7° North Equator, with its own characteristic of wind speed, cloud, rain distribution and humidity level. There is a plentiful rainfall that happens due to the convection of air and thunderstorm can occur nearly everyday. Malaysian temperature is high all year with the exception of wet season and high altitude places. Conclusively, Malaysia, a tropical place experienced two seasons only and that is wet and dry. However, places that located near the Equator are wet and humid throughout the year depending on certain factor such as the distance from a place to the ocean. The abundant rainfall and humidity means that the tropical climate is not the hottest but still it receives considerable sunshine. Table 2.1 show the annual solar radiation
5
Table 2.1: Annual Solar Radiation for towns in Malaysia (http://www.seeforum.net/sustainableenergyandenvironment)
It has all these renewable energy resources in abundance, but most of these renewable energies are still in introduction phase. In Malaysia, the climate conditions are favorable for the development of solar energy due to the large source of solar radiation. With the average daily temperature of 27.5°C, 2228 hours of sunlight per year with an average of 6.1 hours of sunlight per day and range between 4.9 hours per day in November and 7.4 hours per day in February [Rosli, 2010] .The solar radiation ranging from 6.5kWh/m2 in the months of January and drops lower to 6.0kWh/m2 in the months of
6
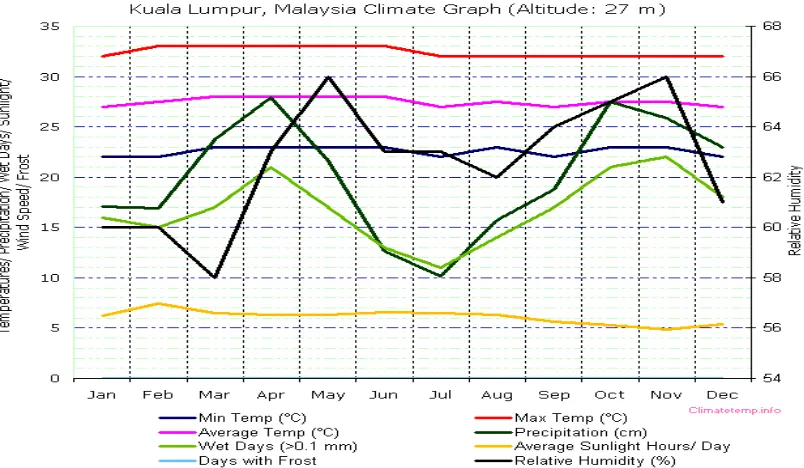
Figure 2.1: Malaysia climate change graph for 2010 (http://www.climatetemp.info/Malaysia, 2010)
Figure 2.1 shows the graph of climate change in 2010. The main wind direction is variable and the mean surface winds over peninsular Malaysia are generally mild, with the highest mean daily wind speed of about 3.8 m/s measured at Mersing, and a highest maximum wind speed ever recorded was 41.7 m/s at Kuching. Malaysia experienced four monsoon seasons throughout the whole year.
• The southwest monsoon season happens between May to early June and ends in September. The wind flow is generally southwesterly and light, below 15 knots (7.71 m/s)
7
(10.28 m/s). The winds over the east coast of Peninsular Malaysia may reach 30 knots (15.42 m/s) or more.
However for the past few months in 2014, Malaysia has witnessed few violent wind and small scale tornadoes in multiple places such as Pandamaran, Klang and Kedah.
Figure 2.2: Aftermath of Violent Wind in Pandamaran, Klang 21 October 2014