iv TABLE OF CONTENT
COMPARATIVE ANALYSIS ON MARKET REACTION AND FINANCIAL PERFORMANCE BEFORE AND WHEN USING THE FAIR VALUE MODEL OF COMPANIES LISTED ONTHE INDONESIA STOCK EXCHANGE ...1 GREEN ENTREPRENEURSHIP: IMPLEMENTATION OFACCOUNTING
INFORMATION SYSTEM, QUALITY COST METHOD FOR INCREASING PROFITABILITY SMEs...14
TAX PAYERS’S COMPREHENSION OF SAS: AN IMPORTANT WAY TO
SUSTAIN GOVERNMENT BUDGET...34
“ENTREPRENEURSHIP AND SOCIAL RESPONSIBILITY”REPORT ...49 THE MODELS OF TOURISM SECTOR DEVELOPMENT OF BANDUNG
REGENCY AND JEMBER REGENCY IN RELATING WITH OWN-SOURCE REVENUE...67 ECONOMIC VALUATION OF AMAL BEACH TOURISM:TRAVEL COST METHOD (TCM) APPLICATION...80 DEVELOPMENT OF COMMUNITY BASED ECOTOURISM AT PAMONA AREAS...88 THE MODEL OF MANAGEMENT SOCIETY POVERTYSANTOLO COAST GARUT DISTRICT WEST JAVA...99 GREEN BUSINESS APPLICATION ANALYSIS TO FINANCIAL
PERFORMANCE SMEs IN TARAKAN CITY ...110
CONSUMER’S BELIEF TOWARDS NON-RICE NON-WHEAT STAPLE
FOOD...120 CONSUMER PERCEPTION AND THEIR EVALUATION TOWARDS
v THE EFFECT OF MARKET VALUE AND VARIANCE RETURN ON HOLDING PERIOD IN LQ-45 COMPANIES LISTED IN INDONESIA STOCK EXCHANGE YEAR 2011-2013...174
GREEN WORK LIFE BALANCE EMPLOYEE OFCOMPANY “A” AND
COMPANY “B” IN SEMARANG CITY ...195 WHOSE RESPONSIBILITY IS SOCIAL RESPONSIBILITY - THE
CORPORATION AND/OR .. ?...207
14 GREEN ENTREPRENEURSHIP: IMPLEMENTATION OF
ACCOUNTING INFORMATION SYSTEM , QUALITY COST METHOD FOR INCREASING PROFITABILITY SMEs
Enny Susilowati Mardjono
*
Fakulty of Economic, Dian Nuswantoro University,Jl Nakula 1 No 511 Semarang, Indonesia
Phone: +62 81901166333, +62-24- 3567010, Fax : +62 – 24- 3565441 E-mail : [email protected]
Guruh Taufan Hariyadi
Fakulty of Economic, Dian Nuswantoro University,Jl Nakula 1 No 5- 11Semarang, Indonesia
Phone: +62 81225402299, +62-24- 3567010, Fax : +62 – 24- 3565441 E-mail : [email protected]
ABSTRACT
The research examines the effect Quality Cost (Prevention Cost, Appraisal cost, Failure Cost) with Accounting Information as Mediating Variable toward Profitability .This research use sample consisted of 51 Unit Small and Medium Enterprises food and drink in Semarang.
The data are taken from MUI Semarang. Selection of samples by using sensus sampling. The hypothesis testing model using Warp Partial Least Square analysis (PLS) version 3.1
The result of the research indicated, the Prevention cost and Appraisal Cost with mediating Accounting Information are factors that affect positively on Profitability Unit Small and Medium Enterprises . Internal and Eksternal Failure cost with mediating Accounting Information have negative result in Profitability Unit Samall and Medium Enterprises. These findings contribute that The scale SMEs enterprises that have the support of the standards of the MUI are indeed more attention to Cost Appraisal and Preventing Cost with mediating Accounting Information are accurate support profitability. The cost of external and internal failure has not been implemented by the average SME yet and it be fully reflected in the low attention of accounting information systems that support the information available internal and external failure costs, which affects the damaged goods before the expiration of goods ends. So these findings SMESs Enterprises are not only consider the quality of the goods, but also held a review for internal and external failures to increase customer satisfaction impacting the increase in sales.
15 INTRODUCTION
Background of The Study
In the current globalization era where the opening of free trade from various countries, the Indonesian people not only suffered from the domestic competition but experience the challenge of competition from abroad. In
terms of the role of the SMEs’employment also has an important role.
Basically SMEs (small and medium industries) is a labor-intensive sector with little capital. It can absorb a lot of labor (Djoko, 2011). SMEs are known to be very stable to lift the Indonesian economy in times of crisis. SMEs must face the challenges of multinational companies which have advantages in terms of management, technology, network. This has become a strong threat for SMEs to compete in all fields. The empowerment of SMEs should be encouraged with empowerment strategy such as access to the business, market access, access to technology, access to human resources (HR), lobbying, relationship with stakeholders and business continuity (Djoko, 2011)
The majority of SME owners do not have a deep knowledge. SMEs just think short term and less oriented toward the long term. Efforts to improve its performance over conventional due to lack of knowledge in the field of business management, for example in determining the price of a product is often only focused on the general condition of the industry environment (Charland, 1999). Concerning labor is rarely accounted for as an expense allocated. Thus they are often inaccurate and often mistaken in terms of measuring the productivity of the business that will ultimately lead to business performance (Yusni, et al, 2009)
Accounting information can become a reliable basis for decision-making in the management of small businesses such as market development decisions, pricing and others (Margianin, 2007). SMEs often ignore the impact of financial management, without effective method of accounting, business prospects to succeed can become bankrupt (Bruwer and Watkins, 2010). Indicators decision can be taken from the accounting information in SMEs serve as stated Dharma (2010) : 1. Basic considerations and purchase of raw materials for production and means of production that will be used. 2. The decision regarding the determination of the selling price. 3. The application and request third-party funds (Bank). 4. Decisions of business development and the addition of floating human resources as well as the addition of a business asset.
16 product would be more attractive to consumers, and it can ultimately increase
the company's sales volume.
The cost of quality is an indicator of financial performance quality. The cost of quality as an indicator of program success quality can be attributed as company's profits, sales, cost of goods sold or the total cost of production. Cost of quality is Prevention costs or increased costs as a result of producing goods of inferior quality. These charges focus on quality and occurs in all business functions that emphasize value-added (Horngren, 2000). Increased sales by the decline in the cost then it certainly will increase profitability of the company. Quality costs consist of the cost of prevention, appraisal costs, internal failure costs, and the cost of failure eksternal. Increasing of quality impact on the profitability that was pursued by increasing customer demand and reduce costs. Intense competition in the market, increasing demand and cost savings can be deciding whether a business can thrive or just survive (Hansen and Mowen, 2009)
17 1.2 Statement of The Problem
Does Implementation of Accounting Information Systems and cost of quality methods are better able to increase the profitability of Semarang SMEs ?
1.3 Purpose of The Study
This study aims to prove the models that use accounting information systems and methods of quality cost can be used to improve the profitability of Semarang SMEs.
ANALYSIS OF LITERATURE ,THEORETICAL FRAMEWORK AND HYPOTHESIS
Small and Medium Enterprises (SMEs)
According to the Law No. 20 , 2008 about Micro, Small and Medium business Chapter 1 General Provisions Article 1, mantion that:
1. Micro business is a productive enterprise belonging to individuals and / or entities individuals who meet the criteria of micro enterprises as set in the law. 2 . Small businesses are productive economic activities that stand alone, which is done by the individual or business entity that is not a subsidiary or not branch of a company owned, controlled, or be a part either directly or indirectly, of a medium or large businesses that meet small business criteria as referred to in this law. 3. The medium-sized businesses are productive economic activities that stand alone, which is done by the individual or business entity that is not a subsidiary or branch company owned, controlled, or be a part either directly or indirectly with a small business or a large business with a number of wealth or annual net sales revenue as stipulated in this law.
Accounting Information System
According to Mulyadi (2010) definition of Accounting Information System is organizational forms, records and reports that they are coordinated to provide the financial information. It needed by management in order to facilitate the processing business companies.
18 Quality Cost
According to Hansen and Mowen (2009) activities related to the quality is activities carried out because of bad quality or may have occurred.
Carter (2009) classify the cost of quality into three major classifications, namely: 1.Prevention Cost
Costs incurred to prevent failure of the product. Prevention costs are those costs incurred to design products and high-quality production systems, including the cost to implement and maintain these systems. Failure prevention begins with designing quality products into products and production processes. Preventive maintenance should be performed periodically of equipment and machinery to maintain a high quality. All employees, from top management to the workers in the factory should be constantly looking for ways to improve product quality.
2.Appraisal Cost
Costs incurred to detect failure of the product. Appraisal costs consist of the cost of inspection and testing of raw materials. The cost of inspection of products during and after the production process, as well as fees for obtaining information from customers regarding their satisfaction for the product. 3.Failure Costs
Costs incurred when a product fails. Such as failures can occur internally and externally.
a.Internal Failure Cost is costs incurred during the production process, like the rest of the cost of raw materials, the cost of defective goods, the cost of rework, and the cessation of production due to damage to the machine or run out of raw materials.
b.External Failure Costs is costs incurred after the product is sold, including the cost to repair and replace the defective product during the warranty period, the cost to handle customer complaints, and the cost of the loss of sales due to customer dissatisfaction.
Profitabilitas
19 Model of framework theoretically is described as :
Figure 1
Theoritical Framework
Hypotheses Development
20 Prawirosentono (2007), excellent quality product it would be more attractive
to consumers, and can ultimately increase the company's sales volume.
H1: There is a simultaneous effect between Appraisal Cost mediated by the accounting information system implementation towards profitability.
Preventive maintenance should be performed periodically of equipment and machinery to maintain a high quality .Simultaneous influence Quality Costs towards Profitability are costs that arise because there may be or have bad quality products. Research on the effect of prevention costs to profitability by Matthew (2012) found that the cost of quality simultaneous positive effect on profitability.
H2: There is a simultaneous effect between Prevention Cost mediated Accounting Information Systems towards profitability.
Internal Failure Cost incurred during the production process, like the rest of the cost of raw materials, the cost of defective goods, the cost of rework, and the cessation of production due to damage to the machine or run out of raw materials. If this activities have trouble so it can influence quality of product. Influence Quality Costs towards Profitability are costs that arise because there may be or have bad quality products. Research on the effect of Internal Failure Costs to profitability by Matthew (2012) found that the Internal Failure Cost positive effect on profitability.
H3: There is a simultaneous effect between Internal Failure Cost mediated Accounting Information Systems towards profitability.
External Failure Costs incurred after the product was sold, including the cost to repair and replace the defective product during the warranty period, the cost to handle customer complaints, and the cost of the loss of sales due to customer dissatisfaction. Influence Eksternal Failure Cost towards Profitability are costs that arise because customer complaint as a result of bad quality products. Research on the effect of Eksternal Failure Costs to profitability by Matthew (2012) found that the Eksternal Failure Cost positive effect on profitability.
H4: There is a simultaneous effect between Eksternal Failure Cost mediated Accounting Information Systems towards profitability.
21 can ultimately increase the company's sales volume. According Gasperz in
Kawiana (2009), by paying attention to quality will have a positive impact to the business in two ways such as impact on production costs and the impact on revenue.
H5: There is a positive and significant influence between Quality Cost (Prevention Cost, Appraisal Cost, External Failure Costs, and the Cost of Internal failure) mediated Accounting Information Systems towards Profitability
Research Variable and Definition of Variable Operational Research Variable
This study used two independent variable namely Quality Cost and Cost Accounting Information Systems and one dependent variable profitability of SMEs. Measurement of variables using a Likert scale are presented using a scale of 1-5 , where 1 is given the scale scores Strongly Disagree, and the scale of 5 was scored Strongly Agree (SS). Likert Scale used to measure attitudes, opinions, and perceptions of a person or group of people about social phenomena in the study specifically assigned as research variables (Iqbal ,2002)
Operational Definition
In the operational definition of this variable is formed by indicators indicators as follows:
• Accounting information system
Accounting information system is needed, especially on the part of management to help make decisions an organization. Accounting Information System is understanding of computer-based. This variable is measured with three questions. This question was adopted on the instrument developed by Boner and Walker (1994) in Sutianingsih (2011) uses three indicators with a Likert scale.
• Quality Cost (Prevention Cost , Appraisal Cost, Internal Failure Cost, External Failure Costs)
Carter (2009) classifies into four, namely Appraisal cost, prevention costs, external failure costs and the cost of internal failure. This variable is measured with five indicators for Prevention Cost and four indicators for Appraisal Cost and three indicators for Internal Failure Cost and three indicators for Eksternal Failure Cost. Measurement of variables using a Likert scale.
22 According Sawir (2001) Profitability aims to determine the company's ability
to generate profits a certain period, also aims to measure the effectiveness of management in running the company's operations. This variable uses five indicators of profitability. Measurement of variables using a likert scale.
Method of Data Analysis
Collecting data by primary that already been checked about its reliability and validity. The aim of checking is to know consistency and acuration of data that's already been collected by the instrument. Next, the hypothesis will be evaluated by Path Analysis or Structural Equation Modeling Analysis (SEM) with Wrap Partial Least Square (PLS) verse 3,0 method as an alternative method, software Wrap PLS verse 3. PLS is a powerful analysis method because based on not many assumptions . Data have to measure by exact scale, few numbers of samples, appropriate to purpose prediction in high complexity and low support of the theory ,( Ghozali , 2006). Hypothesis 1 , 2, and 3 will be answered by estimate PLS parameter such :
1. Outer model Measurement
Outer model to the indicator evaluation reflexive with convergent and discriminant validity from their indicator and composite reliability for block indicator. Rules for receiving and reject of hypothesis are : convergent validity will be calculated based on correlation between component score and construct score which will be counted by PLS by watching the outer loading of each indicators and their significance value. Reflexive measurement will be indicated high if the correlation with constructing that be measured more than 0,70. Loading value that be suggested is more than 0,50 (positive) and p significance < 0,05. Indicator that lower than standard, must be dropped from models and have to evaluate again. Good Discriminant Validity is when being measured by comparison with AVE root from every constructs must be bigger than the correlation value among its constructs in the model (Fornell Dan Larcker, 1981).
2. To measure Inner Model or Structural
Inner model describes the connection among latent variable based on its substantive theory. The model formulation can be written as such :
ŋ = γPC ξ1+γAC ξ2 + γIFC ξ3+ γEFC ξ3 + ζ
Explanation :
23 ξ1 = latent variable exogen (independent) Prevention Cost
ξ2 = latent variable exogen (independent) Appraisal Cost ξ3 = latent variable exogen (independent) Internal Failure Cost ξ4 = latent variable exogen (independent) Eksternal Failure Cost ζ (zeta) = error in the formulation is between exogen Variabl and endogenous Variable Toward Endogen Variable.
γ(gamma) = direct connection exogen Variable with endogen Variable. Inner model wants to see the connection between construct, significant value, and R-square value. Connection among construct can be seen from the result of coefficient path parameter model structurally dependent, Stone-Geisser Q-square test for predictive relevance and test t and significant. From coefficience parameter structural line (Ghozali, 2006).
Alternative hypothesis (HA) can be received when the path parameter value among other variable indicates direction positive on the significant level p<0,01 Just the opposite, HO value can be received when path parameter connection among latent variable indicates negative direction. Change of R– square can be used to measure impact of independent latent variable to dependent latent variable, is it has substantive impact
DATA ANALYSIS AND DISCUSSION
Descriptive Statistics
The data quesioners has been successfully collected 45 questionnaires from 51 questionnaires were expected. The descriptive profiles and descriptive respondents described below :
Description of Object Research
Respondents in this study are the owners and representatives of the owners and employees are entrusted decisions maker in SMEs in the region Semarang. The population of 51 SMEs questioner dissemination of food and drinks listed in MUI, until now only 46 questionnaires from SMEs foods and drinks listed MUI on the back to reseacher. SMEs food and drink consists of several clusters such as cooking oil, coffee, fish balls, wet bread, drinks, cassava chips, shredded, coffee, milk, tofu, tapioca flour, chicken pieces, wingko, syrup.
Evaluating Quality of Data
Output Laten Variable Coefficients
24 Table 1.
Output Laten Variable Coefficients
Prevention Appraisal
Internal Failure
Eksternal Failure
Accounting
Information Profitability
R-squred 0.810 0.835
Composite
reliab 0.913 0.901 0.832 0.898 0.881 0.916 Cronbach's
alpha 0.884 0.851 0.695 0.829 0.794 0.885
Avg. var.extrac 0.695 0.695 0.625 0.746 0.713 0.686
Full co lin VIF 36.339 6.411 2.753 6.752 23.559 17.684
Q-squared 0.814 0.837
Source : Primary data has been processed by Warp PLS 3.0, 2015
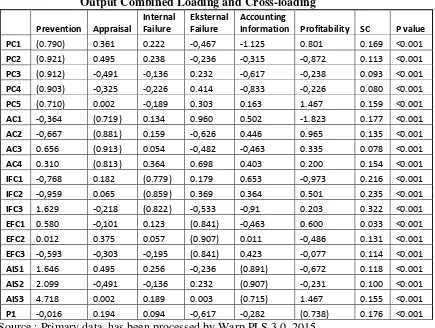
Output Combined loadings and Cross-loadings
Loading each indicator konstruk are bracketed and its p-value. There are two criteria for judging outer eligible models converge to construct reflective namely (1) loading must be above 0.70 and (2) significant p values (<0.05) (Hair et al, 2013). All loading marked all brackets already meets these criteria so all loading indicator qualify convergent validity. Examples PC 1 has a larger loading to construct P amounted to 0.790 above 0.70 and a significant p value (<0.05). This can be expressed as follow :
Table 2.
Output Combined Loading and Cross-loading Prevention Appraisal
Internal Failure
Eksternal Failure
Accounting
Information Profitability SC P value
PC1 (0.790) 0.361 0.222 -0,467 -1.125 0.801 0.169 <0.001
PC2 (0.921) 0.495 0.238 -0,236 -0,315 -0,872 0.113 <0.001 PC3 (0.912) -0,491 -0,136 0.232 -0,617 -0,238 0.093 <0.001
PC4 (0.903) -0,325 -0,226 0.414 -0,833 -0,226 0.080 <0.001 PC5 (0.710) 0.002 -0,189 0.303 0.163 1.467 0.159 <0.001
AC1 -0,364 (0.719) 0.134 0.960 0.502 -1.823 0.177 <0.001 AC2 -0,667 (0.881) 0.159 -0,626 0.446 0.965 0.135 <0.001
AC3 0.656 (0.913) 0.054 -0,482 -0,463 0.335 0.078 <0.001 AC4 0.310 (0.813) 0.364 0.698 0.403 0.200 0.154 <0.001
IFC1 -0,768 0.182 (0.779) 0.179 0.653 -0,973 0.216 <0.001 IFC2 -0,959 0.065 (0.859) 0.369 0.364 0.501 0.235 <0.001
IFC3 1.629 -0,218 (0.822) -0,533 -0,91 0.203 0.322 <0.001 EFC1 0.580 -0,101 0.123 (0.841) -0,463 0.600 0.033 <0.001
EFC2 0.012 0.375 0.057 (0.907) 0.011 -0,486 0.131 <0.001 EFC3 -0,593 -0,303 -0,195 (0.841) 0.423 -0,077 0.114 <0.001
AIS1 1.646 0.495 0.256 -0,236 (0.891) -0,672 0.118 <0.001 AIS2 2.099 -0,491 -0,136 0.232 (0.907) -0,231 0.100 <0.001
25 According to Table 2 seen that loading every indicator in the construct upper
0,70 and all p value significance (<0,05) ,Thus, instruments which been used is valid to use.
Result of Hypothesis Testing
In this research, there are 5 hypotheses, that are tested SEM-PLS with Warp PLS 3.0 ( Sholihin and Ratmono, 2013)
Testing of Hypothesis Quality Cost ( Prevention Cost and Appraisal Cost, Internal Failure Cost, Eksternal Failure Cost) with mediation Accounting Information System have impact to Profitability
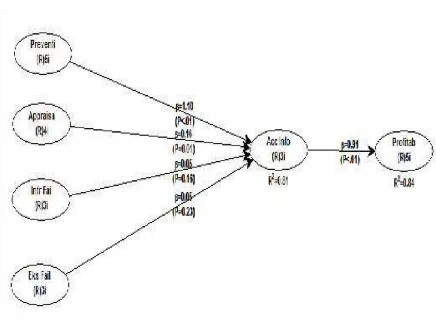
Outer Model and Inner Model Testing
Result of Outer Model whole of variables PC, AC, IFC,EFC, AIS , P show reliable enough loading value upper than 0,50 and p sig <0,05, that can be seen in picture 2 below.
Figure 2
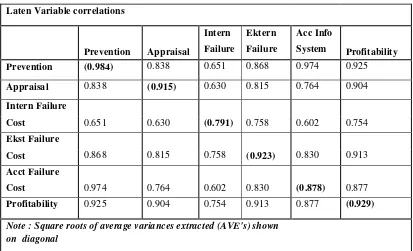
26 Output Correlations among Latent Variables :
This Output is important to evaluate discriminant validity of the study. Overall constructs in the model estimated discriminant validity meet the criteria. Display the output in table 3. Correlations between Latent Variables show where the roots AVE has a value greater than the correlation between constructs that have a lower value. Examples Discriminant validity of the construct Prvention Cost (PC) has a great value because the roots of AVE 0.984 greater than 0.838, 0.651,0.868,0.974,
0925
Table 3.
Output Correlations among Latent Variables Laten Variable correlations
Prevention Appraisal
Intern
Failure
Ektern
Failure
Acc Info
System Profitability
Prevention (0.984) 0.838 0.651 0.868 0.974 0.925
Appraisal 0.838 (0.915) 0.630 0.815 0.764 0.904
Intern Failure
Cost 0.651 0.630 (0.791) 0.758 0.602 0.754
Ekst Failure
Cost 0.868 0.815 0.758 (0.923) 0.830 0.913
Acct Failure
Cost 0.974 0.764 0.602 0.830 (0.878) 0.877
Profitability 0.925 0.904 0.754 0.913 0.877 (0.929)
[image:19.595.114.527.248.499.2]Note : Square roots of average variances extracted (AVE's) shown on diagonal
Tabel 4.
Output Laten Variable Coefficients
Prevention Appraisal
Internal Failure
Eksternal Failure
Accounting
Information Profitability
R-squred 0.810 0.835
Composite
reliab 0.913 0.901 0.832 0.898 0.881 0.916 Cronbach's
alpha 0.884 0.851 0.695 0.829 0.794 0.885
Avg. var.extrac 0.695 0.695 0.625 0.746 0.713 0.686
Full co lin VIF 36.339 6.411 2.753 6.752 23.559 17.684
Q-squared 0.814 0.837
Source : Primary Data has been processed by Wrap PLS 3.0 , 2015
[image:19.595.112.530.540.706.2]27 for Prevention Cost and 0.901 for Appraisal Cost, 0.832 for Internal Failure
Cost and 0.898 for Eksternal Failure Cost, 0.881 for Accounting Information System and 0.916 for Profitability
*Testing of Inner Model or Testing Model Struktural
At Table 4, R-square value as 0.835 it means that construct variability
Profitability can be explained by Construct Prevention Cost (PC), Appraisal Cost (AC), Internal Failure Cost (IFC), Eksternal Failure Cost (EFC), Accounting Information System (AIS) as 83,5 %, whereas the rest as 16,50% is explained other variable outside model. Result Path coefficient and P values as significance indicator are seen in output Table 5
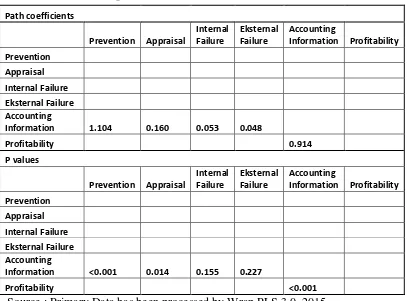
Table 5.
Output Path coefficient and P values
Path coefficients
Prevention Appraisal
Internal Failure
Eksternal Failure
Accounting
Information Profitability
Prevention
Appraisal
Internal Failure
Eksternal Failure
Accounting
Information 1.104 0.160 0.053 0.048
Profitability 0.914
P values
Prevention Appraisal
Internal Failure
Eksternal Failure
Accounting
Information Profitability
Prevention
Appraisal
Internal Failure
Eksternal Failure
Accounting
Information <0.001 0.014 0.155 0.227
Profitability <0.001
Source : Primary Data has been processed by Wrap PLS 3.0, 2015
28 significant because kooefisien 0.05, p = 0.22 (p> 0.01) This means that the
accounting information system at the time of their Internal Failure Cost and external Failure Cost do not be a mediating variable. The conclusion, Accounting Information System mediates the relationship between Prevention Cost and Cost Appraisal towards Profitability. At the time of dealing with Internal and External Failure Failure Cost, Accounting Information System does not mediate relationship with profitability.
Discussion
Hypothesis 1: There is a simultaneous effect between Appraisal Cost mediated by the accounting information system implementation towards profitability.
Output Path coefficient and P values are shown in Table 5, which examined the relationship between constructs can be concluded constructs Appraisal Cost is mediated by Accounting Information System affect the profitability of 0.16 significance at p <0,01. Result of this research was supported by Sutianingsih and Handayani (2011) good system accounting information is presented in the form of good financial statements both in terms of the completeness of the availability of cost assessment. It can make SMEs professional, because with the good financial statements properly , it will produce good quality information.
This may imply that based on the distribution of the data SMEs standart MUI, SMEs food and beverage are adopting cost of assessments in advance with the activities monitoring and supervision, inspection and testing. It gave a great impact on the good quality of products. This indicates that SMEs conducting periodic assessments can produce good product quality standards and the good feedback from buyer, thus increasing profitability SMEs
Hypothesis 2 : There is a simultaneous effect between Prevention Cost mediated Accounting Information Systems towards profitability.
Results test illustrate that the relationship between the constructs Prevention Cost is mediated Accounting Information Systems effect on the profitability of 1.10 significant at p <0.01
29 Hypothesis 3 : There is a simultaneous effect between Internal Failure Cost mediated Accounting Information Systems towards profitability.
Constructs Internal Failure Cost is mediated by Accounting Information System does not affect the profitability as 0.05, the results showed no significant because kooefisien 0.15 p = 0.15 (p> 0.01).
Internal failure costs here represented by reworking, re-examination and retesting has low value because there is still reworking and the re-evaluation activities is very low. There is a lot of researchers confirm to the respondents and the answering is the swelling costs and capital. So that activities are rarely carried out by SMEs. So based on this data distribution reject the hypothesis. The activities of internal failure costs reduce profitability.
Hypothesis 4 : There is a simultaneous effect between Eksternal Failure Cost mediated Accounting Information Systems towards profitability.
Constructs Eksternal Failure Cost is mediated by Accounting Information does not affect the profitability, the results showed no significant because kooefisien 0.05 p = 0.22 (p> 0.01). This means that the accounting information system is not the mediating variables Eksternal Failure Cost. External Failure Costs represented by warranty costs, repair costs and the cost of take care customer complaints have low value of the perception of employee SMEs. according to argument employee SMEs to provide the warranty is still lacking and to adopt a customer complaint facilities and infrastructure is also lacking. In this case the external failure cost allocation does not applied a lot. This activity has not increased profitability.
Hypothesis 5 :There is a positive and significant influence between Quality Cost (Prevention Cost, Appraisal Cost, External Failure Costs, and the Cost of Internal failure) mediated Accounting Information Systems towards
Profitability
At Table 5, Accounting Information System mediates the relationship between Prevention Cost and Cost Appraisal towards Profitability. At the time of dealing with Internal and External Failure Failure Cost, Accounting Information System does not mediate relationship with profitability.
R-square with a value of 0835, which means constructs Profitability variables can explained by construct Prevention Cost (PC), Appraisal Cost (AC), Internal Failure Cost (IFC), External Failure Cost (EFC), Accounting Information System (AIS) 83, 50%, with the remaining 16.50% is explained by other variables outside the model
CONCLUSION, IMPLICATIONS, SUGGESTIONS AND LIMITATIONS
30 Based on testing results and discussion, can be deduced :
1. The scale enterprises SMEs are indeed quite have the support of the standards of the MUI. Based on data Semarang SMEs centers are indeed more attention to Cost Appraisal and Preventing Cost with accurate Accounting Information. This cost support profitability Semarang SMEs.
2. The cost of external and internal failure average has not been implemented by the SMEs and reflected low supporting available of accounting information systems especially about aplication internal and external failure costs. As a result many product of SMESs have damaged before time of product expired.
3. The last three years, the owners of SMEs prefer quality to improve customer satisfaction, thereby increasing sales turnover. So these findings for the next , SMEs do not only consider the quality of the goods, but also held a review for internal and external failures to increase customer satisfaction impacting the increase in profitability sales
SUGGESTION
Due to very high benefits from the cost of quality and availability of good accounting information systems, it is advisable to further research and SMEs do not implement only the cost of quality assessment and appraisal costs but also pay attention to internal failure costs and external failure . So with good product quality, the products of SMEs will be sold in the market with increasingly higher profit and compete with export quality goods. The importance of attention to competitive prices, availability of good raw materials.
DAFTAR PUSTAKA
Carter. 2009. Cost of Accounting , Five Edition, Jakarta: Salemba Empat
Djoko. S,(2011), Strategi Pemberdayaan Usaha Kecil Batik Di Pekalongan, Eksplanasi Vol. 6, No. 1, pp.29-45
Dharma T Ediraras (2010), Akuntansi Dan Kinerja UKM, Jurnal ekonomi Bisnis Vol.15,. No.2, pp.152-158
Bruwer JP, Watkins JA .2010. Sustainability of fast moving consumer goods retail SMEs, Afr. J. Bus. Manage. 4(16):3550-3555
31 Carland, L.C, and Carland, J.W, (1999). Exploring the Existence of Entrepreneural Teams. International Journal of Management, 16,276-286
Iqbal Hasan,M. 2002, Pokok-Pokok Materi Metodologi Penelitian dan Aplikasinya, Ghalia Indonesia -Bogor.
Ghozali, Imam. 2008. Aplikasi Analisis Multivariate Dengan Program SPSS. BPFE Universitas Diponegoro Semarang.
Ghozali, Imam. 2006. Sruktural Equation Modeling ; Metode Alternatif dengan PLS. 2 nd Edition. Badan Penerbit Universitas Diponegoro Semarang
Gantino dan Erwin. 2011. Pengaruh Biaya Kualitas Terhadap Penjualan Pada
PT. Guardian Pharmatama. Journal Of Applied Finance And Accounting,Universitas Indonusa Esa Unggul, Jakarta.
Hair,J.,T.Hult,C.Ringle,dan M.Sarstedt,2013.A Primer on Partial Least Squares Stuctural Equation Modeling (PLS-SEM). Los Angeles:Sage.
Horngren,Charles. T. dkk .2000. Cost Accounting A Managerial Emphasis ,Page:30 Hansen dan Mowen.2009. Akuntansi Manajerial.Buku dua, Edisi Kedelapan, Jakarta: Penerbit Salemba Empat
Undang-Undang Nomor 20 Tahun 2008 Tentang Usaha Mikro, Kecil dan Menengah
LPPOM MUI Jateng produk. halal.or.id bersertifikat MUI 2015.
Margianin Pinasti .2007. Pengaruh penyelenggaraan dan penggunaan informasi akuntansi terhadap persepsi pengusaha kecil atas informasi akuntansi : suatu riset eksperimen, Simposium Nasional akuntansi X
Martusa dan Darmadi Haslim.2011. Peranan Analisis Biaya Kualitas Dalam
Meningkatkan Efisiensi Biaya Produksi. Akurat Jurnal Akuntansi Ilmiah Nomor 04 Tahun ke-2. Universitas Kristen Maranata.
32 Mulyadi. 2010. Akuntansi Biaya. Edisi Kelima,Yogyakarta: STIE YKPN
Prawirosentono, Suyadi. 2007 Manajemen Operasi Analisis dan Studi Kasus, Edisi Keempat, Bumi Aksara
Sholihin Mahfud, dan Ratmono Dwi, 2013. Analisis SEM-PLS dengan WARP PLS 3.0 untuk Hubungan Non Linear dalam Penelitian Sosial dan Bisnis. Andi Offset. Yogyakarta
Sutianingsih, Rini Handayani(2011) , Analisis Kualitas Informasi Keuangan Terhadap Kinerja Dan Kemampuan Perusahaan Mengakses Modal Jurnal Ekonomi dan Bisnis .Vol. 5, No. 2, Juli 2011 hal 163-172
Sawir A. 2001. Analisis kinerja keuangan dan perencanaan keuangan perusahaan., Jakarta: Gramedia Pustaka Utama
Ulfah Fitriana dan Susilo Toto Rahardjo .2013.Analisis Pengaruh Implementasi Manajemen Kualitas Terhadap Kinerja Organisasi pada UKM di Salatiga, Jurnal Studi Manajemen & Organisasi. Volume 10, Nomor 1, Januari, Tahun 2013 , Halaman 22