The 3'" International Conference on Mathematics and Statistics (ICoMS·3)
Institut Pertanian Bogor, Indonesia, 5-6 August 2008
zyxwvutsrqponmlkjihgfedcbaZYXWVUTSRQPONMLKJIHGFEDCBA
K-MEANS CLUSTERING VISUALIZATION
ON AGRICULTURE POTENTIAL DATA
FOR VILLAGES IN BOGOR USING MAPSERVER
Imas S. Sitanggang,
2Henri Harianja, and
3Lailan Syaufina
I.2Computcr Science Department, Bogor Agricultural University Jl. Meranti, Wing 20 Level V, Kampus !PB Darmaga, Bogor 16680 - Indonesia
3Departement of Silviculture, Bogor Agricultural University Jl. Lingkar Akademik Kampus !PB Darmaga, Bogor 16680 - lndonesia e-rnail :[email protected]@[email protected]
Abstract.zyxwvutsrqponmlkjihgfedcbaZYXWVUTSRQPONMLKJIHGFEDCBACentral Bureau of Statistics have conducted same surveys for vil/age potential which convey data ofpotential or condition including socialcondition, economical condition, land utilizing. structure and infrastructure up to level of village. This research aims to analyze 5808 records of the vil/age potentiat data especially Ihose which rela led la agriculture. 11could be done by applying data mining techniques in order la gelinformation
or knowledge as a decision support for agriculture sector developmenl. This research uses one of data mining techniques that is clustering using KMeons algorithm and result of clustering is visualized in a form of web based geographical information sys lem. The data
used in this research is data of villages especially related to rice jield and other attributes
zyxwvutsrqponmlkjihgfedcbaZYXWVUTSRQPONMLKJIHGFEDCBA
/01'non-agricultural in West Java in 2006 especial/y in Bogor. The results of thisresearch are mean valuesfromeach cluster and visualization
Jar
each componenI of the cluster in aformof web based geographical information system. The best clustering is reached when size of cluster is 4and random seed is20. having lalai value of SSE (sum of square error) 1.6702 with a distribution thatisnol divided well in each cluster. Members of cluster 0 and cluster 3 are regions with ricefield that quite narrow (mean value of attribute area 0/ricefield is 56.3103 Ha in cluster 0 and is 274.7950 Ha in cluster3). Members ofcluster 1are regions having large area ofrice field (mean value is2756 Ha). Members ofcluster 2are large non-agricultural regions (mean value is 8650.2 Ha).
Keywords : clustering, K-Means, swn of square error (SSE). web based geographical information system.
1. Introduction
Agriculture sector development in Indonesia needs to be improved in answering the demand of food. Central Bureau of Statistics have done some surveys for village potential which convey data of potential or condition including social condition, economical condition, land utilizing. structure and infrastructure up to level of village. Data mining is a process to extract information and patterns from huge databases
(HanzyxwvutsrqponmlkjihgfedcbaZYXWVUTSRQPONMLKJIHGFEDCBA&Kamber 2006). Clustering is one of the main tasks in data mining that groups a set of objects into classes of similar objects. K-Means is a widely used algorithm in nu merica I data clustering. This
research aims to I) apply the clustering technique using K-Means algorithm in agriculture potential data, 2) visualize clustering results in form of a web based geographical information system. The data used in this research include all villages in both district areas and urbane areas of Bogor in the year 2006. Users can use this application in decision making related to the development of agricultural sector in Bogor.
The main food crop for Indonesian is rice plant that are cultivated in rice field and dry rice field. Rice
Bureau of Statistics 2008). In this research, we select attributes related to rice field and other attributes for non-agricultural area that will be compared with attributes for agricultural area.
2.zyxwvutsrqponmlkjihgfedcbaZYXWVUTSRQPONMLKJIHGFEDCBA
Preliminaries
2.1 Clustering
Data muung tasks can be classified into two group based on its objectives (Kantardzic 2003): I) descriptive data mining and 2) predictive data mining. In descriptive data mining concepts or task-relevant data are described in concise, informative and discriminative form. Predictive task develops a model based on certain attributes to predict the value of others attributes. Generaly, clustering is process of grouping the data into c1asses or clusters, such that objects within a cluster have high similarity in
comparison to one another but are very dissimilar to objects in other c1ustcrs (HanzyxwvutsrqponmlkjihgfedcbaZYXWVUTSRQPONMLKJIHGFEDCBA& Kamber 2006). Clusters similarity and dissimilarity measures are assesed based on the attribute values describing the
objects.
2.2 K-Means Algorithm
K-Means is a partitional-c1ustering algorithm that assigns data objects into non-overlap c1ustcrs in which each object is exactly in one cluster. Square-error, also called within-cluster variation, is a common used criterion in partitional-c1ustering. By applying this criterion, we will have partitions of objects with minimal total square-error. Suppose the set of data objects N is partitioned into K clusters
{C"C2, .•. .Cj}, Each Ck has n, data objects and each object is exactly in one cluster so thatzyxwvutsrqponmlkjihgfedcbaZYXWVUTSRQPONMLKJIHGFEDCBA
L
nk=N.Mean vector Mk of a c1uster C, defined as a centroid of the cluster is calculated using the folIowing formula:zyxwvutsrqponmlkjihgfedcbaZYXWVUTSRQPONMLKJIHGFEDCBA
n,
Mk
=
(1/
nk)L>ik
... (I),zyxwvutsrqponmlkjihgfedcbaZYXWVUTSRQPONMLKJIHGFEDCBA ;= 1where Xik is iIh data object which is a mem ber of cluster Cj, Square-error of a cluster C, is the sum of squared Euc1idean distance from the object to its cluster centroid. Below is the square-error equation:
e
2
k
=t(Xik
-Mk)2
... (2). ;= 1Square-error for all K clusters called Total Sum of Square Error or Total SSE is the sum of within-c1uster variation as defined in the equation (3).
K
E
2
k=L>2k
...
(3). k=1The objective of a square error clustering method is to find a partmon containing K clusters that minimize E}k(total SSE) for a given K. K-means is a clustering algorithm that uses this approach. Below are the steps in K-Means algorithm (Tan et al.2006). Each clusters center is represented by the mean value of objects in the cluster.
Input' K: the number of clusters, 0: a data set containing n objects.
Output: A set of K c1usters that minimizes the square-error criterion. Method:
(1) arbitrarily choose k objects from D as the initial cluster centers; (2) repeat
(3) (re)assign each object to the cluster to which the object is the most similar, based on the mean value of the objects in the cluster;
(4) update the cluster means, i.e., ca1culate the mean value of the objects for each cluster; (5) until no change;
K-means algorithm has some characteristics as folio ws (Kantardzic 2003):
I. Complexity of K-Means algorithm isO(nkl) where nis the number of data objects, kis the number of cluster and Iis the number of iteration.
4. Because its complexity is linear, K-Means is more relatively scalable as well as efficient for processing the large number of data (higher-dimensionality).
2.3 Cluster evaluation
Cluster validation is a measure to evaluate the "goodness" of the resulting clusters. Measures in
cluster evaluation can be classified into three types as follows (TanzyxwvutsrqponmlkjihgfedcbaZYXWVUTSRQPONMLKJIHGFEDCBAel
zyxwvutsrqponmlkjihgfedcbaZYXWVUTSRQPONMLKJIHGFEDCBA
al. 2006):I. Unsupervised: measures the goodness of clustering structure without reference to extemal information. An example of this measure is the SSE. This measure is divided into two quantities: I) the cohesion of the cluster (compactness, tightness) which determine how closely related the objects in a cluster are, and 2) the separation of the cluster (isolation) which determine how distinct or well-separated a cluster is from other clusters.
2. Supervised: measures the extent to which the clustering structure discovered by a clustering algorithm matches some external structure. An example of this measure is entropy.
3. Relative: compares different clusterings. This measure is a supervised or unsupervised measure that is used for the purpose of comparison.
K-Means algorithm is an unsupervised technique evaluated using the SSE. SEE is a c1uster cohesion measure that apply Euc1idean distance. If cohesion is measured using Euclidean distance (SSE), then the value of separation of inter-clusters is group sum of squares (SSB), sum of squared distance from a c1uster centroid c, to others centroids c. We have total SSB by summing the values of SSB over all clusters, that is given in the folio wing equation:
K
Total SSBzyxwvutsrqponmlkjihgfedcbaZYXWVUTSRQPONMLKJIHGFEDCBA=
LI
C;
I
(C; _C)2
... (4).zyxwvutsrqponmlkjihgfedcbaZYXWVUTSRQPONMLKJIHGFEDCBA
j=l
The higher the value of total SSB, the more separated the clusters are from one another. In some cases, we have strong relation between cohesion and separation. Specifically, the sum of the total SSE and the total SSB is constant that equal to total sum of squares (TSS) (Tan et al. 2006). Therefore minimizing SSE (cohesion) is equivalent to maximizing SSB (separation).
2.4 Geographic Information System (GIS)
A GIS is a computer-based system which has ability to store, analyze, perform query, and visualize geographical data (Chang 2002). A GIS can be divided into four components (Chang 2002):
I. Computer system. This component includes hardware and an operating system to run a GIS. 2. A GIS software inc1uding computer programs and user interface to operate hardware.
3. Brainware. Brainware refers to the goa ls, objectives as well as reasons and justification in using GIS. 4. Infrastructure. This component refers to organization, administration and cultural environment to
operate GIS .
in GIS framework, data are classified into two categories (Chang 2002): I) spatial data including vector data and raster data. Vector data use x and y coordinate for creating spatial features such as points, lines and squares, while raster data use grid to represent spatial variation; 2) attribute data: describes characteristics of spatial features.
3.zyxwvutsrqponmlkjihgfedcbaZYXWVUTSRQPONMLKJIHGFEDCBA
Experiments
on the c1ustering method
The system is developed in two steps: I) data pre-processing including data selection, data transformation, and data cleaning; 2) applying the K-Means algorithm into the data of villages in Bogor in 2006; 3) evaluating clusters resulted from step 2 using Sum of Square Error (SSE); 4) c1ustering visua1ization in form of a web-based geographical information system. Softwares used in this research are Windows XP Home Edition as an operating system, WEKA version 3.5.7, ArcView GIS 3.1, Map Server For Windows (ms4w) 1.2.2, and Chameleon 2.4.1. These softwares run in a personal computer that has specifications: Processor intel Pentium M 1.73 GHz, Memory 512 MB RAM., monitor with resolution 1024x768, a mouse and a keyboard.
The village potential data for regions of West Java in 2006 consists of 5808 records and 443 attributes. This collection of data is stored in xls format with the size 36,129 KB. Beloware some activities in pre-processing phase for original data:
is implemented to the data related to agriculture. Therefore we select three numerical attributes. Those are area of rice field (Ha), area of worked irrigated rice field (Ha), and area of non-agriculture regions (housing/shoppingloffice/industries etc) (Ha). In addition to the three attributes, we also use others attributes including regions code i.e. province code, district code, sub district code, and village code as the prirnary key (record_id).
2. Data transformation and integration. Code attributes are merged in a new attribute as id in clustering.
The data are transformed into arff format in order to process using WEKA.zyxwvutsrqponmlkjihgfedcbaZYXWVUTSRQPONMLKJIHGFEDCBA
4. Discusion
[image:4.605.175.387.293.433.2]ln this research, we use K-means algorithm in WEKA version 3.5.7 to cluster the data. Some experiments are conducted for the number of cluster from 2 to 10. For each the size of cluster (k), we use random seed (s) 5, 10, 15, and 20. K-means algorithm will result c1uster centers (mcans) for cach c1uster. Clustering with the number of cluster (k) 4 and random seed 20 is the best result. Table I shows the value of each cluster centers where A, Band C represent attribute area of rice field, area of worked irrigated rice field, area of non-agriculture regions respectively. The number of members in each cluster as well as its percentage are detailed in Table 2.
Table I Cluster centers for k=4 and s=20
Cluster A (Ha) B (Ha) C (Ha)
0 56.3103 33.5966 175.8319
zyxwvutsrqponmlkjihgfedcbaZYXWVUTSRQPONMLKJIHGFEDCBA
I 2756.0000 2699.0000 2493.0000
2 962.6000 690.4000 8650.2000
3 274.7950 186.7871 300.8453
Table 2 Number 0 mem ersineae c uster an itspercentage or an Cluster Number of members Percen tage (%)
0 348 70
I 2 0
2 5 I
3 139 28
h I d· f k=4 d s=20
4.1 Cluster evaluation
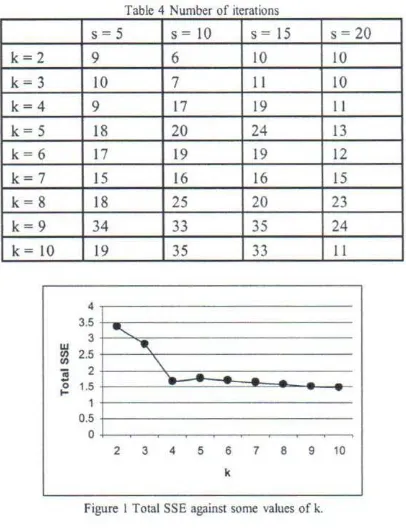
The c1ustering results for each pair of the size of cluster (k) and random seeds (s) are evaluated using total SSE (sum of square error). Minimizing the SSE (cohesion) is equivalent to maximizing the SSB (separation). The values of total SEE for each clustering are listed in Table 3. We can see in Table 3 that the values of total SSE are not significantly different from each other. For k=2 and all different values of s, the values of SSE are the same. This case also occurs in clustering with k =3. In fact, different values of s for k=2 and k=3 give influence only for number of iterations as showed in Table 4. Because this algorithm has linier complexity, time execution is not significantly influenced by the number of iterations. Total SSE ten ds to decrease when the number of clusters increases. This case agrees with the characteristic of an algorithm that use total squared distance in which the best clustering will happen when the number of clusters is the same as the number of objects (Witten & Frank 2005).
Toble 3 Totol SSE
s=5 s = 10 s = 15 s = 20
k-2 3.371368725 3.371368725 3.371368725 3.3 71368725
k=3 2.820783355 2.820783355 2.820783355 2.820783355
k=4 1.905395994 2.636225506 2.636225506 1.670206903
k=5 1.761038189 1.761038189 1.761038189 1.761038189
k=6 1.688190160 1.688190160 1.702948088 1.688190160
k=7 1.618720195 1.633211580 1.633241780 1.633396541
k=8 1.588942165 1.555171840 1.588941245 1.580563066
k=9 1.494895178 1.503285672 1.494895178 1.548650347
k= 10 1.474889124 1.479655912 1.4 74051309 1.551708014
a distinct knee at k=4. We can find the nature number of cluster in a data set by looking for the number of clusters at which there is a knee, peak, or dip in the pIot of the evaluation measure when it is plotted against the number of clusters (Tan et al. 2006). Therefore we conclude that the best clustering is for k=4 and s=20.
Table 4 Number of iterations
s = 5 s=IO s = 15 s = 20
k=2 9 6 10 10
k=3 10
zyxwvutsrqponmlkjihgfedcbaZYXWVUTSRQPONMLKJIHGFEDCBA
7 II 10k=4 9 17 19 II
k=5 18 20 24 13
k=6 17 19 19 12
k=7 15 16 16 15
k=8 18 25 20 23
k=9 34 33 35 24
k= 10 19 35 33 II
10
zyxwvutsrqponmlkjihgfedcbaZYXWVUTSRQPONMLKJIHGFEDCBA
4 , -3.5 •...
3 "'
2.5 '\
1.5
zyxwvutsrqponmlkjihgfedcbaZYXWVUTSRQPONMLKJIHGFEDCBA
1zyxwvutsrqponmlkjihgfedcbaZYXWVUTSRQPONMLKJIHGFEDCBAr
-0.5
-1---Figure I Total SSE against some values of k.
4.2 Clustering visualization application
We develop a web-based geographical information system (GrS) to visualize clustering results. This application plots spatial aspect of the data and displays mean values and all attributes values in data set. The architecture of th is system consists of MapServer as a web server, map file as configuration, Chameleon as the framework, php modules, and html files as the template.
Map files will store both all defmitions and configurations needed by MapServer such as the size of maps, path of shp files, and font. Php modules provide pages for data in detail for each cluster size. Some Widgets that have provided by Chameleon are inserted in html files. They are MapDHTML, KeyMap, Zoomln, ZoomOut, PanMap, Recenter, ZoomAllLayers, Extent, and Query. Attribute data in spatial data in format dbf consist of province code, district code, sub district code, village code, provinces, districts, sub districts, villages in Bogor. We use ArcYiew to combine attribute data in spatial data with clustering results. There is a village i.e. Sukagalih (sub district Jonggol) that exist in the data set, but it does not exist in spatial data. Besides, in spatial data we find an area that represent a forest in sub district Cijeruk, and this area is not available in the data set. Web pages have the folio wing components (Figure 2):
I. Map to display clustering results with the corresponding spatial data. Each cluster is plotted with different colors.
2. Keymap to navigate the map.
3. Legend to give additional information for each cluster based on its color. 4. Scalebar to give the actual distance for scale in a map.
The main page for best clustering result is in Figure 3.
zyxwvutsrqponmlkjihgfedcbaZYXWVUTSRQPONMLKJIHGFEDCBA
E
B
zyxwvutsrqponmlkjihgfedcbaZYXWVUTSRQPONMLKJIHGFEDCBA
MAP
NAV/GATION TOOLS
[image:6.605.111.449.119.492.2]---SCME~---I
MEANSINFORMA TlONI
Figure 2 The structure of web pages
zyxwvutsrqponmlkjihgfedcbaZYXWVUTSRQPONMLKJIHGFEDCBA
legend
~zoomln
~z.oomOVt
I±JReeenI.r
IQI••••
~ZoomtofulfExtcmt.
(!JQuert
zyxwvutsrqponmlkjihgfedcbaZYXWVUTSRQPONMLKJIHGFEDCBA
'S ) O escrlp tlo n
'I
1m
Ii_
zyxwvutsrqponmlkjihgfedcbaZYXWVUTSRQPONMLKJIHGFEDCBA
.0...
'
0"'-'
IIIIC J_2
.CI~3
-.-KABUPATEN BOGOR & KOTA BOGOR
Rioht.I01.2~
T D p "-6 Z 1 2
"'_X.101.~2
"
"
"
..
Inform ation M eans
C Iu ,te rO
Clulteri
C 1u lterZ
56.3103 2756.0000
952.6000
zyxwvutsrqponmlkjihgfedcbaZYXWVUTSRQPONMLKJIHGFEDCBA
274.795033.5963. 2699.0000
690.4000 136.1871
175.1319 2"93.OOOO 1650.2000 300.80453
Figure 3 The main page for best clustering result.
, I
zyxwvutsrqponmlkjihgfedcbaZYXWVUTSRQPONMLKJIHGFEDCBA
Figure 4 Members of clusters versus
zyxwvutsrqponmlkjihgfedcbaZYXWVUTSRQPONMLKJIHGFEDCBA
attributeA. Figure 5 Members of clusters versusartributeB.3618
clusterO cluster1
cluster?
'1809 3618
Figure 6 Attribute A versus attribute B. Figure 7 Membcrs of clusters versus attribute C.
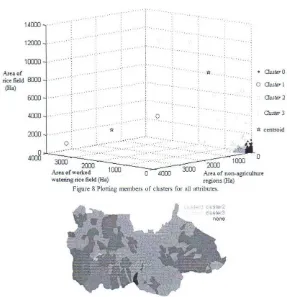
In Figure 7 we piot members of each cluster against the attribute C (area of non-agriculture regions) in which attribute values of members in cluster 2 are larger th an they in others c1usters (mean of attribute C is 8650.2000 Ha). Members of all clusters and four c1uster centers, indicated by star symbols, are given in a graph (Figure 8). Clustering results and the spatial aspect of the data are visualized in a map (Figure 9). Most of members of cluster 0 are regions in center of the map. All villages in districts in Bogor are members of cluster 0 except Situ Gede and Mulyaharja. Cluster 1 and cluster 2 are located in southwest.
14000
zyxwvutsrqponmlkjihgfedcbaZYXWVUTSRQPONMLKJIHGFEDCBA
• O u.siQ rO
zyxwvutsrqponmlkjihgfedcbaZYXWVUTSRQPONMLKJIHGFEDCBA
[image:8.600.134.421.106.403.2],., "
...
12000
10000
zyxwvutsrqponmlkjihgfedcbaZYXWVUTSRQPONMLKJIHGFEDCBA
Area of rice fie1d 8000
(Ha)zyxwvutsrqponmlkjihgfedcbaZYXWVUTSRQPONMLKJIHGFEDCBAo austgr!
6000 O u.sigr2
4000
zyxwvutsrqponmlkjihgfedcbaZYXWVUTSRQPONMLKJIHGFEDCBA
austor 32000
zyxwvutsrqponmlkjihgfedcbaZYXWVUTSRQPONMLKJIHGFEDCBA
*
centroido
Area cf'wcrked 0 4000 Area of ncn-agriculture
wateringrice field (Ha) region, (Ha)
Figure 8 Plorting members of clusrers for all artributes,
Figure 9 A map for c1ustering results with k=4 and 5=20.
5. Conclusion
In this paper we present the results of K-Means algorithm application to the data related to the area of rice field and the area of non-agricultural regions in Bogor in 2006. We develop a web-based geographical information system to visualize clustering results involving the spatial aspect of the data. Some experiments are conducted with number of cluster from 2 to 10 and random seed 5, 10, 15 and 20. We have the best clustering for the number of cluster 4 and random seed 20 having total SSE 1.670206903 in which objects are not spread well in all clusters. Members of cluster 0 and cluster 3 are regions with rice field that quite narrow (mean value of attribute area of rice field is 56.3103 Ha in cluster
o
and is 274.7950 Ha in cluster 3) therefore agricultural sector development in these regions should not be based on land. Land-based agriculture is suitable for the regions in cluster I because members of this cluster have large area of rice field (mean value is 2756 Ha). Regions in cluster 2 have larger non-agriculture area (mean value is 8650.2 Ha) th an rice field area (mean value is 962.6000 Ha). If agricultural development will still needed in this regions th en rice field should be protected from converting to non-agricultural regions. In this research we apply clustering algorithm to numerical data. In future work, other clustering algorithms such as Qrock can be implemented to cluster categorical data.6. References
Central Bureau of Statistics. 2008. Press Releases: Production of Paddy, Maize And Soybeans (Fixed Figures 2007 and Estimation Figures II 2008). http://www.bps.go.idlreleases/Production _ Of_ Paddy , Maize _And _ SoybeanslEnglish/
Chang Kang-tsung, 2002. introduction to Geographic information System.New York: McGraw-Hills. Han J, Kamber M. 2006. Data Mining: Concepts and TechniquesEdisi Ke-2. San Francisco: Morgan
Kantardzic M. 2003.zyxwvutsrqponmlkjihgfedcbaZYXWVUTSRQPONMLKJIHGFEDCBAData Mining: Concepts. Models, Methods, and Algorithm. New Jersey: John WileyzyxwvutsrqponmlkjihgfedcbaZYXWVUTSRQPONMLKJIHGFEDCBA
& Sons Inc.
Tan P, Michael S, Vipin K. 2006. Introduction to Data mining.Pearson Education, Inc.
Witten I, Frank E. 2005. Data mining: practical machine learning and techniques Edisi ke-2. San