DOI: 10.12928/TELKOMNIKA.v14i2A.4365 145
Experimental Investigation of Piezoelectricity of Near
Field Electrospun PVDF Nanofibers
Siyuan Ma, Qingqiang Sun, Yuanzhe Su, Ronghui Chen, Lingyun Wang* Department of Mechanical and Electrical Engineering Xiamen University, Xiamen, Fujian, China
*Corresponding author, e-mail: [email protected]
Abstract
In this paper, the roles of mechanical stretch and electric poling on phase transition and piezoelectric response of Poly (vinylidene fluoride) (PVDF) nanofibers during Near Field Electrospinning (NFES) are investigated. By adjusting applied voltage or speed of motion stage while keeping other parameters constant, PVDF nanofibers enduring different electric poling and mechanical stretch are prepared. The average fiber diameter is observed by scanning electron microscope (SEM). The crystal structure of the fiber is analyzed through Fourier Transform Infrared spectrum (FTIR) and X-Ray diffraction (XRD), and the β phase responsible for the piezoelectricity is calculated for the quantitative analysis. The piezoelectric response is investigated utilizing a home-made testing system. The experimental results show that the piezoelectric response increases although the β phase content remains almost the same under stronger electric poling. On the contrary, the piezoelectric response remains almost the same while the β phase content increases under stronger mechanical stretch. This indicates that electric poling resulted from electric field is the main reason for the piezoelectric performance of PVDF.
Keywords: piezoelectric performance, PVDF, NFES, crystal structure
1. Introduction
As a promising piezoelectric polymer, poly (vinylidene fluoride) (PVDF) has its unique features such as high piezoelectric constant, low acoustic impedance, wide frequency response, chemical stability, flexibility and light weight. It attracts interests from scientific to industrial areas and has been therefore investigated for applications such as pressure sensor [1], energy harvester [2], battery separation [3], etc. Generally, there are five crystal phases for PVDF, α-,
-, -, σ- and ξ-phase, among which the -phase is responsible for the piezoelectricity of PVDF, since it has the strongest spontaneous polarity. PVDF membranes prepared with traditional methods such as spin-coat contains are predominated with α- and - phase [4], and post treatments of mechanical stretching and electric poling are needed to make it piezoelectric, which is time consuming [5].
Compared with traditional processes, far field electrospinning combines mechanical stretching and in-situ electric poling simultaneously. And various methods have been applied to collect patterned PVDF fibers from nano to micro scale, such as parallel electrodes, rotating disk. However, this technique is not competent when it comes to the application in miniaturized devices, since it is hard to deposit the fiber precisely using far field electrospinning. The Near Field Electrospinning (NFES) shows its advantage to deposit fibers of nano or micro scale into patterns with high precision, apart from the features that far field electrospinning owns [6]. Chieh Chang, et al, utilized this method to prepare piezoelectric nanogenerator with high energy conversion efficiency [7]. Juan Pu, et al, studied the piezoelectric actuation of PVDF fibers prepared by NFES and found their average piezoelectric coefficient is about twice larger than that of reported PVDF films [8]. ZH Liu, et al, investigated the piezoelectric properties of PVDF/MWCNT nanofiber prepared with different NFES parameters [9].
2. Research Method
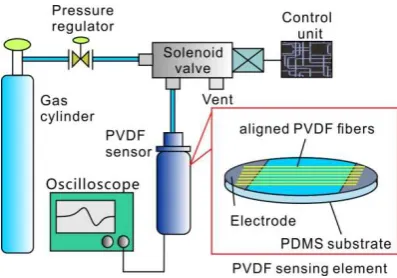
The solution is prepared by dissolving certain amount of PVDF powders (Aldrich-Sigma, 540,000) into solvent made of N-methyl-2-pyrrolidone (NMP) and Acetone whose volume ratio is 4:6. A 2.5mL syringe pumped by a precision pump (Harvard 11 Pico Plus) is used to contain and supply the solution to a metallic needle (inner diameter of 0.25mm) connected to a high DC voltage. A grounded X-Y motion stage is used to collect nanofibers, as shown in Figure 1. Once the applied voltage on the needle is high enough, the mutual charge repulsing force exceeds the surface tension on the pendent PVDF droplet, forming a Taylor cone and a polymer jet, as shown in Figure 1.b. When the polymer jet reaches the collector, it forms a fiber. The deposition is controllable and can be patterned through X-Y motion stage as shown in Figure 1.c.
Figure 1. Schematic of setup for NFES
The morphology of nanofibers was observed by a scanning electron microscope (SEM, LEO 1530). The Infrared Spectra of the fiber was recorded through a Fourier Transform Infrared Spectrometer (FTIR, Nicolet Avatar 360) in the range of 400-1500 cm-1, with a resolution of 2 cm-1.
The measurement of piezoelectric performance of the prepared PVDF nanofibers was done on a home-made air pressure testing system in our previous work [10]. Figure 2 shows the schematic of testing system. It consists of a gas scource, pressure and frequency control unit, oscilloscope and PVDF sensor (including sensing element and condition circuit). The sensing element contains polydimethylsiloxane (PDMS) layer (thickness of 0.7mm), two parallel Al electrodes (separation of 8mm) and aligned PVDF fibers, as depicted in the inset. To well pick up the very weak signal from the vibration, a signal condition circuit was embedded in the sensor which can filter the 50 Hz noise as well. The gas flowing into the sensor was controlled with expected pressure and frequency.
3. Results and Discussion
3.1. Morphology and Fiber Diameter
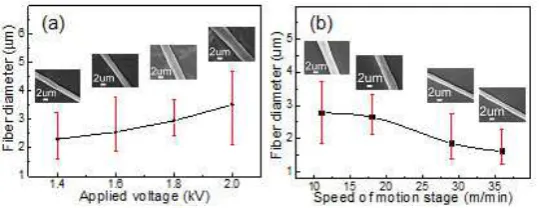
First, the feeding flow rate, the working distance and the speed of motion stage are kept at 50μL/hr, 21m/min and 2mm, respectively. The applied voltage is changed from 1.4kV to 2kV with interval of 0.2kV. The insets in Figure 3.a show the SEM picture of PVDF fibers electrospun at these four applied voltages. It can be seen that the four fibers are straight but the width is uneven along each fiber. Meanwhile, the statistical result in Figure 3.a shows that the average diameter of the fiber increases with the increment of applied voltage, and all the fibers have diameters less than 10 μm. Therefore the diameter of PVDF fiber relies on the applied voltage. The proportional relationship can be explained by the previous study that the increment of applied voltage increases the electrical force to the jet, speeding it up. Therefore more PVDF solution ejects from the spinneret per unit time, resulting in thicker fiber diameter [11].
Figure 3. Statistics of PVDF fiber diameter
Then, the applied voltage, the feeding flow rate and the working distance are kept at 1.4kV, 50μL/hr and 2mm, respectively. And the speeds of motion stage are 11m/min, 18m/min, 29m/min, and 36m/min. The insets in Figure 3.b show the SEM pictures of the fibers electrospun at different speeds of motion stage. And the statistical result in Figure 3.b shows that as the speed of motion stage increases, the mean fiber diameter decreases from about 2.7μm to 1.5μm. So the fiber diameter also depends on the speed of motion stage. This relationship can be explained by the reason that with increasing the speed of motion stage, the jet undergoes stronger mechanical stretching, resulting in thinner fiber.
3.2. Crystalline Structure
The crystalline structure of PVDF fibers is characterized with FTIR. Normally, there are five crystalline phases in PVDF, α, , , and . Among these phases the -phase is of the critical importance for the piezoelectricity of PVDF since it has a large spontaneous polarization. Therefore the FTIR spectrum of the PVDF fibers prepared with different parameters are presented for the analysis of crystal constitution.
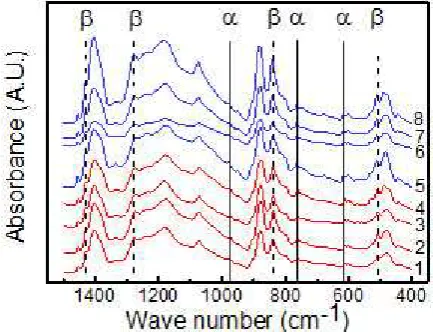
Figure 4 shows the FTIR spectrum of PVDF fibers electrospun with different parameters. The blue curves labeled 1, 2, 3 and 4 correspond to the FTIR spectrum of PVDF fibers electrospun with applied voltage of 1.6, 1.8, 2, and 2.3 kV while other three parameters are kept constant. The red curves labeled 5, 6, 7 and 8 correspond to the FTIR spectrum of PVDF fibers electrospun with speed of motion stage of 11, 18, 29 and 36 m/min while other three parameters are kept constant. According to previous FTIR data of PVDF [12, 13], peaks at wave numbers of 613, 762 and 975 cm-1 correspond to α-phase. The absorbance peaks observed at wave numbers of 510, 840, 1275 and 1431 cm-1 are assigned for -phase. Therefore all the prepared PVDF fibers contain α and phase in Figure 4. The existence of -phase can also be verified by the XRD results as shown in Figure 5.
The correspondingly calculated -phase contents of PVDF fibers prepared under different voltages are 55.03%, 55.41%, 55.31% and 53.38%. Obviously, the -phase content does not vary significantly when the applied voltage increases. According to previous simulating and experimental studies about effects of electric poling during traditional PVDF processing, the poling contributes to phase transition. That is, the transition from α-phase to -phase occurs during either mechanical stretch or electrical poling with electric field usually higher than 5MV/cm [14, 15]. However, the maximum electric field in our experiment is 0.0115MV/cm, which is much less than the threshold value given above, let alone inducing the phase transition. On the other hand, higher electric field results in thicker fiber, meaning bigger fiber volume, which decreases the volume ratio of -phase content from the mathematical perspective. Increasing the applied voltage contributes little to the mechanical stretch, therefore the -phase content is not increased [16,17].
Secondly, the calculated -phase contents of PVDF fibers prepared with four different speeds of motion stage are 51.89%, 51.18%, 55.45% and 60.82%, respectively. Apparently, the -phase content increases as the motion stage speeds up. This is due to the stronger mechanical stretch endured by the jet when the motion stage moves faster, enhancing the phase transition, thus increasing the -phase content.
Figure 4. FTIR spectrum of PVDF fibers prepared with different parameters: 1, 2, 3, 4 for fibers prepared using four applied voltages with other parameters kept constant; 5, 6, 7, 8 for fibers
prepared using four speeds of motion stage with other parameters kept constant.
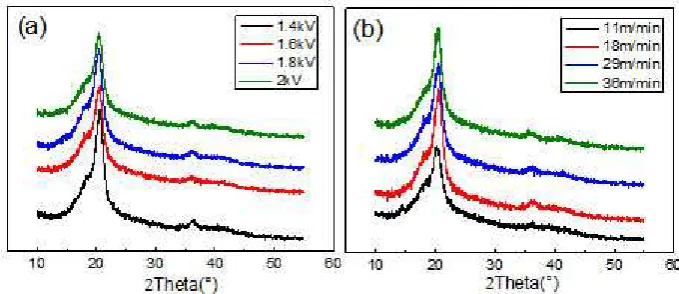
Figure 5 shows the X-ray diffraction(XRD) of PVDF fibers electrospun with different parameters. The black, red, blue and green curves in Figure 5(a) correspond to the XRD spectrum of PVDF fibers electrospun with applied voltage of 1.4, 1.6, 1.8, and 2 kV ,while other three parameters are kept constant. The black, red, blue and green curves in Figure 5(b) correspond to the XRD spectrum of PVDF fibers electrospun with speed of motion stage of 11, 18, 29 and 36 m/min while other three parameters are kept constant. A strong peak at wave numbers of 2θ=20.7°explained the presence of -phase, and a weak peak observed at wave numbers of 2θ=36.2°are assigned for -phase. Therefore all the prepared PVDF fibers contain
-phase and -phase, but the content of -phase is dominant.
5(b) shows that as the motion stage speeds up, the intensity of peaks grows, so the -phase content increases, which is compatible with the consequence of FTIR spectrum.
Figure 5. XRD of PVDF fibers prepared with different parameters: (a) fibers prepared using four applied voltages with other parameters kept constant; (b) fibers prepared using four speeds of
motion stage with other parameters kept constant.
3.3. Piezoelectric Performance
The piezoelectric performance of PVDF nanofibers is tested under different applied pressures. During the test, the acquired signal wave has its unique feature and it is worthy to discuss it first. Figure 6.a shows the signal wave during one on-off process of the gas valve, in which four peaks occur, reflecting the motion of PVDF fibers. First, when the valve opens, the gas flows to the substrate, causing the fiber starting to deform with it. Since the circuit is reversely connected, a negative signal appears and reaches its max value at Peak (1). Second, the signal crosses the Zero axis, reaching its max at Peak (2) due to the free damped oscillation of the fibers. However, the free damped oscillation does not last long, so the signal decreases to zero accompanied with a slight negative wave. Then the fibers stay at their maximum displacement statically until the gas valve begins turning off, during which the fibers start to release, leading to the reoccur of signal and its max value at Peak (3). Finally, as the release of fibers end, they undergo a
short duration of free damped oscillation again. And the signal reaches Peak (4) then fades to zero accompanied with a slight positive wave. Based on the above analysis and to make it uniform in the next paragraphs, the values of Peak (a) at all piezoelectric test result are adopted for the comparison and discussion.
Figure 6. Signal of PVDF nanofibers prepared with different speed of motion stage: (a) single piezoelectric test signal wave signal wave; (b) piezoelectric signals of fibers prepared under different applied voltages; (c) piezoelectric signals of fibers prepared under different speeds of
motion stage.
Since the -phase content does not increase with the applied voltage as discussed before, it must be the other effect that electric field has on the PVDF nanofiber during NFES, namely, the reorientation of dipoles.
4. Conclusion
In this paper, certain experimental results and analysis are provided for the better understanding of piezoelectric PVDF fibers fabricated with NFES. First, PVDF fibers in micro or nano scales were fabricated with different applied voltages and speeds of motion stage. Second, FTIR results show that these fibers contain α- and -phase. Further quantitative comparison also indicates -phase content remains almost the same as increasing the applied voltage, while increases with the speed of motion stage. However, the change of final piezoelectric response is converse with that of the -phase content, indicating that the electric poling plays a major role in piezoelectricity of PVDF prepared by NFES.
Acknowledgment
The authors would like to thank Mrs. Ru Xue at Nanotechnology Center of Xiamen University for the SEM work, Mrs Xinyu Liu and Mr. Yiwen Ye at Xiamen University for FTIR and XRD measurements, respectively. This research is supported by the National Natural Science Foundation for Youth of China (No. 51105320), the Fundamental Research Funds for the Central Universities (No. 2010121039).
References
[1] Shirinov WK. Schomburg. Pressure sensor from a PVDF film.Sens. Actuators, A: Physical. 2008;
142(1): 48-55.
[2] Micharl J Laudenslager, Raymond H Scheffler, Wolfgang M Simund. Electrospun materials for
energy harvesting, conversion, and storage. Pure. Appl. Chem. 2010; 82(11): 2137–2156.
[3] Yan X, Wu Q, Zhang C, Li W, Chen W, Luo W. An improved genetic algorithm and its application. Indonesian Journal of Electrical Engineering and Computer Science. 2012; 10(5): 1081-1086. [4] Subramaniyan Ramsundaram, Sun Yoon, Kap Jin Kim, et al. Direct Preparation of Nanoscale Thin
Films of Poly (vinylidene fluoride) Containing -Crystalline Phase by Heat-Controlled Spin Coating. Macromol. Chem. Phys. 2008; 209(1): 2516-2526.
[5] Andrew J Lovinger. Ferroelectric Polymers. Science. 1983; 220(4602): 1115-1121
[6] Gaofeng Zheng, Wenwang Li, Xiang Wang, et al. Precision deposition of a nanofibre by near-field
electrospinning. J. Phys. D: Appl. Phys. 2010; 43(41): 415501-415507
[7] Chieh Chang, Kevin Limkrailassiri, Liwei Lin. Continuous near- field electrospinning for large area
deposition of orderly nanofiber patterns.Applied Physics Letters. 2008; 93(12): 123111-123117.
[8] Juan Pu, Xiaojun Yan, Yadong Jiang, et al. Piezoelectric actuation of direct-write electrospun fibers. Sensors Actuators A: Physical. 2010; 164(1): 131-136.
neat-[10] Dadkhah M, Obeidat MM, Jazi MD, Sutikno T, Riyadi M. A. How can we identify hijacked journals? Bulletin of Electrical Engineering and Informatics. 2015; 4(2): 83-87.
[11] Chieh Chang, Kevin Limkrailassiri, and Liwei Lin. Continuous near- field electrospinning for large
area deposition of orderly nanofiber patterns.Applied Physics Letters. 2008; 93(12): 123111-123117.
[12] Salimi, AA Yousefi. FTIR studies of -phase crystal formation in stretched PVDF films. Polymer
Testing. 2003; 22(5): 699-704.
[13] Jie Zhao, Fenglin Yao, Shiqiao Gao. Structure and Mechanical Analysis of Single Cantilever
Piezoelectric Energy Harvester. TELKOMNIKA Indonesian Journal of Electrical Engineering. 2014;
12(9): 6479-6493.
[14] M Kobayashi, K Tashiro, H Tadokoro. Molecular vibrations of three crystal forms of poly (vinylidene fluoride). Macromolecules. 1975; 8(2): 158-171.
[15] GT Davis, JE Mckinney, MG Broadhurst, et al. Electric-field-induced phase changes in poly (vinylidene fluoride). J. Appl. Phys. 1978; 49(6): 4998-5003.
[16] Fu Xiang-ting, Zha Yan, Zhang An-liang. Droplets Fusion in a Microchannel on a Piezoelectric
Substrate. TELKOMNIKA Indonesian Journal of Electrical Engineering. 2013; 11(7): 3767-3773.
[17] Marta MD Ramos, Helena MG Correia, PS Lanceros-Mendez. Atomistic modeling of processes