DOI: 10.12928/TELKOMNIKA.v13i4.2156 1408
High Performance Computing on Cluster and Multicore
Architecture
Ahmad Ashari*1, Mardhani Riasetiawan2
Department of Computer Science and Electronics, Faculty of Mathematic and Natural Sciences Universitas Gadjah Mada
*Corresponding author, email: [email protected], [email protected]
Abstract
Computing needs that is growing rapidly and more and more the need to make extensive computing resources commensurate. High computing needs can be met by using cluster and high speed processor technology. This study analyzes and compares the performance between cluster and processor technology to determine the high performance computer architecture that can support the process of computation data. Research using Raspberry Pi devices that run with the model cluster then be tested to get the value of the performance, FLOPS, CPU Time and Score. FLOPS value obtained then made equivalent to the load carried by the cluster computing Raspberry Pi. Research is also doing the same thing on the i5 and i7 processor architecture. The research use himeno98 and himeno16Large to analysis the processor and the memory allocation. The test is run on 1000x1000 matrix then benchmark with OpenMP. The analysis focuses on CPU Time in FLOPS and every architecture score. The result shows on raspberry cluster architecture have 2576.07 sec in CPU Time, 86.96 MLPOS, and 2.69 score. The result on Core i5 architecture has 55.57 sec in CPU time, 76.30 MLOPS, and 0.92 score. The result in Core i7 architecture has 59.56 sec CPU Time, 1427.61 MLOPS, and 17.23 score. The cluster and multicore architecture result shows that the architecture models effect to the computing process. The comparison showed the computing performance is strongly influenced by the architecture of the processor power source indicated on the i5 and i7 performance is getting better. Research also shows that both models of cluster and core i5 and i7 alike can process the data to complete.
Keywords: high performance computing, cluster, multicore, processor, memory
Copyright © 2015 Universitas Ahmad Dahlan. All rights reserved.
1. Introduction
High performance computing are need to process the large data, data set and process. The process increase inline with the business, science, education and other needs. The Sciences area, especially astronomy, physics, chemistry, biology, mechanics are just a few examples of areas that most benefit from computer technology [1, 2]. However, it is undeniable that the application of computational load used was not a light load, but often require resources is very large. Various methods have been made to overcome this problem, one of which is by using a supercomputer and a mainframe computer.
Technologies that govern computing resources such as cluster, grid and cloud gives variation data channels will appear. Cluster that provides dedicated resources and facilitate the sharing of data generated by a faster time. Grid dedicating resources connected to the centralized settings can produce distributed data [3]. Cluster or often known as clustering, a group of nodes that operate independently and work closely with each other to be governed by a master computer (master node) and will be seen by the user as if the computer is connected a computer unit [4]. The computer clusters will have more computing power than a single computer either. Another advantage of computer cluster when compared with single computer processor in this case is the processor in the cluster can continue to increase with the number of processors conducted a cluster, so that it can be ascertained that the computer environment has had a better ability than the single computer.
perform certain computational load. With the above explanation, the authors argue that the Raspberry Pi can be built into a cluster and form a prototype of a supercomputer for the purpose of computing the specific load. This is the background of the research on the analysis of cluster performance Raspberry Pi. Clarification on the background research on the design and analysis of cluster performance Raspberry Pi.
Several research on cluster environment use single board somputing has conducted by previous researcher. Cox [5] discuss the making of cluster supercomputer with 64 Raspberry Pi using MPICH2 middleware. Total memory used for 1TB. Research conducted at the University of Southampton, UK. This study was conducted to find out the value of PI using MPI. The research on high performance computing clusters by design and analysis in Red Hat Enterprise Linux also has conducted to address performance issues [6]. the performance of cluster tested use CPI algorithm and shown it is work and can operate on cluster models. The approach on cluster on cloud has been implemented in an elastic data intensive computing [7]. The research use local resource and cloud resource in same periods of time. The research give opportunities on performance and resources. The high performance computer closed with supercomputer especially on the purposes. The issues are in the throughput and performance itself [8]. The research on GPU passthrough for high performance computing especially cloud defines that the core architecture that enable virtual machines is one of the most important components on the purposes [9]. The research use Xen Hypervisor to manage the performance of computation and run as HPC machines. The high perforamce computation also can be establish by optimzing the resource especially processor and memory. The research on multicore processor optimization shown that core speed and power consumptions have relation on overall performances. The research shown that there are idle-speed model and constant-speed model that can be introduce to handle the optimization [10].
This research have deep different with other research, more focus on resource performance analysis and benchmark. The research use cluster to manage several resources into single cluster environment and core i5 and i7 technology as representation of high speed processor. The benchmark purposes to state the core technology process and reliabity especially on computation process.
2. Research Method
Research start by build cluster architecture design 14 Raspberry Pi, Core i5 and Core i7 architectures. Which is then implemented and tested the performance by calculating the value of FLOPS (Floating Point Operations Per Second) in units of Mega and computing 1000x1000 matrix calculations are focused on the ability of the processor in the cluster to handle a number of computational load. Construction of the system by designing and implementing 14 Raspberry Pi so that it can run in a cluster. The first test on the system is done by calculating the value in units of Mega FLOPS using benchmark tools Himeno98. The second test is done by performing a parallel computing through a 1000x1000 matrix calculations. From the results obtained through the first and second test, carried out an equivalence between FLOPS value generated by the calculation of 1000x1000 matrix is then analyzed.
The system used in this thesis has the following functional requirements operating systems Raspbian Wheezy, MPICH2 middleware, the script Himeno98. The system can display the percentage of processor usage and memory when running the application Himeno98 using htop. The system can perform parallel calculations with a 1000x1000 matrix calculation
The first test performed on the cluster to test the performance of the cluster 14 Raspberry Pi to run the script Himeno98. Himeno98 run of the script will get the highest output in the form of clusters FLOPS value that has been built, the old calculation Himeno98 calculation of the script, as well as scores of calculation. Tests using Himeno98 requires a lot of its core or as a multiple of two nodes. Starting from 2, 4, 8, 16 and so on. In this study, the Raspberry Pi is used by 14, so that in its implementation, the nodes are used for the calculation using 16 nodes, so there are 2 nodes running double in the calculations. In this test, the test is not done in the same time, and through a parallel way. Tests performed sequentially, and performed in a different time durations.
30 trials, with the object of testing that is run of the script Himeno98 LARGE size, and use as many cores to 16 cores. This test was chosen because of several options the magnitude of the data used by Himeno98, SMALL, MEDIUM, LARGE and LARGE size clusters for 14 Raspberry Pi is allowed to run.
Results FLOPS value, CPU Time, and scores obtained from the first test and the time of matrix calculations in a second test will be an equivalence between the performance of the cluster 14 Raspberry Pi by computing the load matrix, which is then analyzed and conclusions can be drawn.
The first test parameters in this thesis are: the length of time calculation script Himeno98 LARGE 16 cores, resulting FLOPS value in units of Mega, then the resulting scores after doing the calculations. The second test parameters in this thesis are: long calculation parallel computing matrix calculations. Each of these parameters will be recorded when the test 30 times and analyzed in order to obtain comparative results between each value so it can be drawn a conclusion about the difference in values obtained.
Application used to perform testing is MPICH2, Himeno98, htop, as well as 1000x1000 matrix calculation script. The application will be installed as middleware MPICH2 cluster of 14 Raspberry Pi. Run of the application Himeno98, htop, as well as the script matrix calculations performed using the terminal. On the master node will run the installed MPICH2 Himeno98 command script execution and script matrix calculation involving 13 other nodes. While the application htop will show the work being done by the CPU so that it will notify the processor and memory usage for each node that is running.
Then after the cluster woke up, and it has been implemented, the first test will be carried out, namely the calculation of the value of the cluster FLOPS Raspberry Pi has been built using the application Himeno98. After the first test is completed, a second test is done by performing parallel computing using 1000x1000 dimensional matrix calculation. Results are issued in the form of time testing this second cluster calculations in calculating the matrix. The first and second testing will be done 30 times so that the data generated is valid. After that will be calculated the average of the 30 results of tests performed. From the results of the results obtained from the first and second test will then be conducted equivalence, between the values obtained with the old FLOPS calculation matrix was analyzed and conclusions drawn from the results of equivalence.
3. Results and Analysis
Research on the development of cluster 14 Raspberry Pi model B is a prototype of the development of a supercomputer that can perform certain computational load. Development of the cluster configuration steps prior research adopts [5]. The studies conducted in Department of Computer Science and Electronics, Faculty of Mathematics and Natural Sciences, Universitas Gadjah Mada, that used a 14 Raspberry Raspberry Pi model B and to obtain data on the performance of the cluster is done by calculating the Raspberry Pi FLOPS which is a benchmark of a computer cluster or supercomputer. Then, the value of performance is found, it will be compared to time calculation performed computational load, in this study, using the computational load calculation dimension 1000x1000 matrix.
3.1. Testing Cluster 14 Raspberry Pi
3.2. Test Results and Discussion
The test results are divided into two parts, using Himeno98 testing and using 1000x1000 matrix calculation script. The test results can then be carried out in the discussion of the value and performance of Raspberry FLOPS in handling certain computational load by performing matrix calculations. The results of the first test is the result of calculation of FLOPS, CPU Time and Score using tools Himeno98 benchmark to determine the performance of the cluster is indicated by the Raspberry Pi FLOPS value and the other two parameters were obtained. FLOPS is value in units of Mega. Tests carried out 30 times to get the best results and avoid anomalies in the data obtained. Following the presentation of the test data table cluster 14 Raspberry Pi using a script Himeno98 Large size and use 16 nodes.
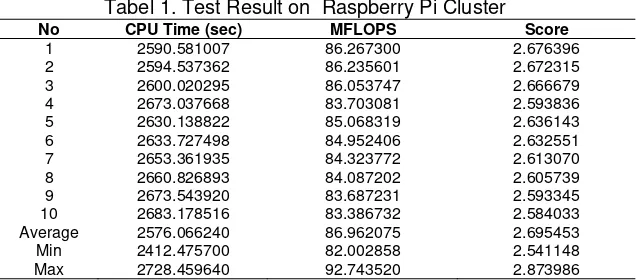
Tabel 1. Test Result on Raspberry Pi Cluster
No CPU Time (sec) MFLOPS Score
1 2590.581007 86.267300 2.676396
2 2594.537362 86.235601 2.672315
3 2600.020295 86.053747 2.666679
4 2673.037668 83.703081 2.593836
5 2630.138822 85.068319 2.636143
6 2633.727498 84.952406 2.632551
7 2653.361935 84.323772 2.613070
8 2660.826893 84.087202 2.605739
9 2673.543920 83.687231 2.593345
10 2683.178516 83.386732 2.584033
Average 2576.066240 86.962075 2.695453
Min 2412.475700 82.002858 2.541148
Max 2728.459640 92.743520 2.873986
Experimental data using Himeno98 as shown in Table 1 gives a pattern of data that can be analyzed. In the first experiment. The results obtained in the first phase of the experiment ranging from test 1 to test to 14. In the first phase of testing, the high FLOPS visible results on testing to 1, 2 to test performance decreased, until the test to 4. However, on testing to 5, experienced increase in performance, reaching a value of 85.065319 FLOPS. However, in testing to 6 until the end of the first phase of testing is testing to 14 FLOPS value decline, assessed as having decline computing performance by doing it continuously.
The result of the calculation can not be coupled FLOPS alone without taking into account the other two parameters namely CPU Time, and Score. CPU time is the time required to calculate the cluster script so get FLOPS value, will produce certain scores. The value in the first phase is decreasing, but in the second phase of testing tend to be higher value obtained FLOPS and more stable. CPU time, inversely proportional to the FLOPS value, the higher the value of FLOPS, then the calculation of time taken by the faster, in the sense of the smaller. Nodes are used as many as 14, but in testing, calculation scripts to impose 16 nodes, so that the testing process up to 30 to 1, the master node (192.168.0.201) and node 2 (192.168.0.202) to do two jobs at once, but node 3 up to 14 just doing one job only.
On the master node and node 2, the memory usage looks different from the other nodes in the amount of 264MB. But at the same processor that is used to allocate all processor capability, 100%. Raspberry cluster characteristics are shown in tests using Himeno98 generally seen in FLOPS value generated. FLOPS value tends to decline for every test thereafter. Processor and memory allocation has decreased after the test to compute (n) so that the test to the (n + 1) will almost certainly produced FLOPS value decreased. The second characteristic is shown cluster Raspberry Pi model B is seen in the first phase and the second phase testing testing. After phase without any task performed on the cluster of Raspberry Pi, the second phase of testing was repeated, resulting in FLOPS value is soaring, stomping number 92 MFLOPS. But back to the first characteristic cluster Raspberry Pi model B, the value of FLOPS on testing to (n + 1) would also be smaller than the value of the test to FLOPS (n), the meaning is almost always decreased. Inversely proportional to the value of FLOPS, CPU time has increased, along with the decline FLOPS value obtained in the testing process, demonstrated the same characteristics, almost certainly decreased performance for each test to the (n + 1).
largest value of 92.743520 MFLOPS. The average time that need by CPU to do calculations Himeno98 is during 2576.06624 seconds, the fastest time 2412.4757 seconds, and the longest time taken for 2728.45964 seconds. While the average scores cluster possessed 14 Raspberry Pi model B is at 2.69545318, with the lowest scores of the highest scores of 2.541148 and 2.873986.
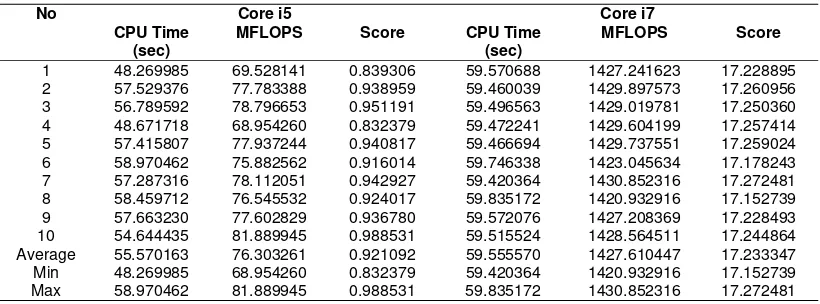
Tabel 2. Test Result on Core i5 & i7
No Core i5 Core i7
CPU Time (sec)
MFLOPS Score CPU Time
(sec)
MFLOPS Score
1 48.269985 69.528141 0.839306 59.570688 1427.241623 17.228895
2 57.529376 77.783388 0.938959 59.460039 1429.897573 17.260956
3 56.789592 78.796653 0.951191 59.496563 1429.019781 17.250360
4 48.671718 68.954260 0.832379 59.472241 1429.604199 17.257414
5 57.415807 77.937244 0.940817 59.466694 1429.737551 17.259024
6 58.970462 75.882562 0.916014 59.746338 1423.045634 17.178243
7 57.287316 78.112051 0.942927 59.420364 1430.852316 17.272481
8 58.459712 76.545532 0.924017 59.835172 1420.932916 17.152739
9 57.663230 77.602829 0.936780 59.572076 1427.208369 17.228493
10 54.644435 81.889945 0.988531 59.515524 1428.564511 17.244864
Average 55.570163 76.303261 0.921092 59.555570 1427.610447 17.233347
Min 48.269985 68.954260 0.832379 59.420364 1420.932916 17.152739
Max 58.970462 81.889945 0.988531 59.835172 1430.852316 17.272481
Table 2 shows Himeno98 with OpenMP test on Desktop PC with Core i5 and Core i7 architectures. Core i5 architecture have performance on CPU Time average 55,5701623 seconds, 76,3032605 MFLOPS and 0,9210921 score. Core i7 architecture have performance on CPU Time 59,5555699 seconds, 1427,610447 MFLOPS and 17,2333468 score.
The Raspberry Pi cluster, Core i5 and Core i7 shown the performance based on the resource capacities. Processor and memory shown the main resources give the performances.
3.3. Test Results Using Matrix Calculation
The results of the second test is the result of calculating the matrix with dimensions 1000x1000 performed by cluster 14 Raspberry Pi model of B. Table 3 shows the results of tests using a 1000x1000 matrix calculation script shown in Table 3.
Table 3. Matrix Test Results
No Raspberry Pi Cluster Core i5 Core i7
Dimension Time (s) Dimension Time (s) Dimension Time (s)
1 1000x1000 39.443008 500x500 0.739688 1000x1000 1.062685
2 1000x1000 39.058709 500x500 0.735486 1000x1000 1.060851
3 1000x1000 38.083262 500x500 0.733455 1000x1000 1.064384 4 1000x1000 38.038639 500x500 0.718637 1000x1000 1.069085 5 1000x1000 38.680501 500x500 0.769055 1000x1000 1.062433 6 1000x1000 37.974584 500x500 0.761147 1000x1000 1.062942 7 1000x1000 37.605260 500x500 0.712850 1000x1000 1.065662 8 1000x1000 37.520037 500x500 0.765559 1000x1000 1.062061 9 1000x1000 38.536223 500x500 0.744571 1000x1000 1.063572 10 1000x1000 38.293610 500x500 0.749248 1000x1000 1.063652
Average 38.679255 0.742970 1.063733
Min 36.934409 0.712850 1.060851 Max 40.327027 0.769055 1.069085
4. Conclusion
Conclusions drawn from examination and discussion are as follows. From the resulting data and characteristics on each test, there exists an equivalence, Cluster 14 Raspberry Pi model B which has a value of 86.9620747 MFLOPS performance, CPU Time 2576.06624 seconds, and 38.6792554 Score 2.69545318 takes seconds to complete the calculation of dimensions 1000x1000 matrix calculations. FLOPS calculation is likely to decline, increased CPU time, and scores comparable with FLOPS but tend to be more gentle, more stable results. With such characteristics, yield 30 times the matrix calculations that have trend tends to rise. The average time it takes the cluster 14 Raspberry Pi model B for computing this matrix calculations for 38.6792554 seconds. The fastest time that is obtained during 36.934409 seconds, and the longest time taken by the cluster, for 40.327027 seconds.
Test result on PC Mac OS X with Core i5 processor is use 500x500 matrix. The matrix implement because the limitation on memory. The result shown that in average Core i5 have 0,742966 seconds, or for the assumption test with 1000x1000 matrix will have 1.484 seconds. Core i7 with 1000x1000 matrix have 1.0637327 seconds.
Raspberry Pi Cluster even has limited resources, with 14 nodes can handle and finish the job with less performance. It is normal because limited resources will impacted the execution times. Core i5 architecture has more reliable resources and resulting the better performance than Raspberry Pi Cluster. Core i7 architecture has the best performance especially when executing the matrix.
High performance computing architecture that has been built on this result can give learn on the development of HPC architecture models, and baseline performance. In the future it will use for determine the delivery architecture model on HPC and can be test by more variation of load.
Acknowledgment
The research supported by Postgraduate Program in Computer Science, Department of Computer Science and Electronics, Faculty of Mathematic and Natural Science, Universitas Gadjah Mada. The research conducted in Computer System and Networks Laboratory, in Department of Computer Science and Electronics, Faculty of Mathematic and Natural Science, Universitas Gadjah Mada.
References
[1] Allock B, Foster J, Nefedova V, Chervenak A, Deelman A, Kesselman C, Leigh J, Sim A, Shoshani A, Drach B, Williams D. High-Performance Remote Access to Climate Simulation Data: A Challenge problem for Data Grid Technologies. SC2001. 2001
[2] Moore R, Rajasekar A. Data and Metadata Collections for Scientific Applications. High Performance Computing and Networking (HPCN 2001), Amsterdam, NL. 2001.
[3] Riasetiawan M, Mahmood AK. DALA Project: Digital archive system for long term access. 2010 International Conference on Distributed Framework and Applications (DFmA), Yogyakarta Indonesia. 2010: 1-5.
[4] Santoso J, van Alba GD, Nazief BA, Sloot PM. Hierarchical Job Schedulling for Clusters of Workstations. Proceedings of the sixth annual conference of the Advanced School for Computing and Imaging (ASCI 2000). 2000: 99-105.
[5] Cox SJ, Cox JT, Boardman RP, Johnston SJ, Scoot M, O’Brien NS. Iridis-pi: a low-cost, compact demonstration cluster. Journal of Cluster Computing. 2012; 17(2): 349-358.
[6] Rahman A. High Performance Computing Clusters Design and Analysis Using Red Hat Enteprise Linux. TELKOMNIKA Indonesian Journal of Electrical Engineering. 2015; 14(3): 534-542.
[7] Duan Z. An Elastic Data Intensive Computing Cluster on Cloud. TELKOMNIKA Indonesian Journal of Electrical Engineering. 2014; 12(10): 7430-7437.
[8] Raicu I, Foster IT, Zhaor Y. Many Task Computing for Grids and Supercomputers. Workshop on Many Task Computing on Grids and Supercomputers. 2008: 1-11.
[9] Younge AJ, Walters JP, Crago S, Fox GC. Evaluating GPU Passthrough in Xen for High Performance Cloud Computing. 2014 IEEE International Parallel & Distributed Processing Symposium Workshops. 2014: 852-859.