miRLAB: An R Based Dry Lab for Exploring
miRNA-mRNA Regulatory Relationships
Thuc Duy Le1*, Junpeng Zhang2, Lin Liu1, Huawen Liu3, Jiuyong Li1*
1School of Information Technology and Mathematical Sciences, University of South Australia, Adelaide, South Australia, Australia,2Faculty of Engineering, Dali University, Dali, China,3Department of Computer Science, Zhejiang Normal University, China
*[email protected](TDL);[email protected](JL)
Abstract
microRNAs (miRNAs) are important gene regulators at post-transcriptional level, and infer-ring miRNA-mRNA regulatory relationships is a crucial problem. Consequently, several computational methods of predicting miRNA targets have been proposed using expression data with or without sequence based miRNA target information. A typical procedure for applying and evaluating such a method is i) collecting matched miRNA and mRNA expres-sion profiles in a specific condition, e.g. a cancer dataset from The Cancer Genome Atlas (TCGA), ii) applying the new computational method to the selected dataset, iii) validating the predictions against knowledge from literature and third-party databases, and comparing the performance of the method with some existing methods. This procedure is time consum-ing given the time elapsed when collectconsum-ing and processconsum-ing data, repeatconsum-ing the work from existing methods, searching for knowledge from literature and third-party databases to vali-date the results, and comparing the results from different methods. The time consuming pro-cedure prevents researchers from quickly testing new computational models, analysing new datasets, and selecting suitable methods for assisting with the experiment design. Here, we present an R package, miRLAB, for automating the procedure of inferring and vali-dating miRNA-mRNA regulatory relationships. The package provides a complete set of pipelines for testing new methods and analysing new datasets. miRLAB includes a pipeline to obtain matched miRNA and mRNA expression datasets directly from TCGA, 12 bench-mark computational methods for inferring miRNA-mRNA regulatory relationships, the func-tions for validating the predicfunc-tions using experimentally validated miRNA target data and miRNA perturbation data, and the tools for comparing the results from different computa-tional methods.
Introduction
miRNAs are important gene regulators controlling a wide range of biological processes and are involved in several types of cancers (see [1] for a review). Thus, exploring miRNA functions is important for diagnostics and therapeutics. However, there are still no feasible experimental
a11111
OPEN ACCESS
Citation:Le TD, Zhang J, Liu L, Liu H, Li J (2015) miRLAB: An R Based Dry Lab for Exploring miRNA-mRNA Regulatory Relationships. PLoS ONE 10(12): e0145386. doi:10.1371/journal.pone.0145386
Editor:Julio Vera, University of Erlangen-Nuremberg, GERMANY
Received:August 11, 2015
Accepted:December 3, 2015
Published:December 30, 2015
Copyright:© 2015 Le et al. This is an open access article distributed under the terms of theCreative Commons Attribution License, which permits unrestricted use, distribution, and reproduction in any medium, provided the original author and source are credited.
Data Availability Statement:All relevant data are within the paper and its Supporting Information files.
Funding:This work has been partially supported by Australian Research Council Discovery Project DP130104090, (JL and LL), and the Applied Basic Research Foundation of Science and Technology of Yunnan Province, No. 2013FD038 (JZ). The funders had no role in study design, data collection and analysis, decision to publish, or preparation of the manuscript.
techniques to discover miRNA regulatory mechanisms. Computational methods are proved to be an effective approach to exploring miRNA functions by predicting miRNA-mRNA regula-tory relationships. These prediction methods help reduce the number of experiments that must be conducted and assist with the design of the experiments.
There is a large amount of data and tools for predicting miRNA targets. Sequence based pre-diction methods, which use the principal of sequence complementary and/or structural stabil-ity of the putative duplex, provide genome wide predictions of miRNA targets, but the results may contain a high rate of false discoveries [2]. Meanwhile, gene expression based methods are normally proposed to infer the miRNA-mRNA regulatory relationships in a specific condition, which can be classified as correlation based analysis [3,4], regression models [5,6], Bayesian inference [7], and causal inference [8–10]. Each of the methods has its own merits and different methods may discover complementary results [11]. There are also methods which integrate both sequence based target information and gene expression data for identifying miRNA tar-gets [7,12–14]. The computational methods help broaden our understanding of miRNA func-tions and generate hypotheses for wet lab experiments.
However, there is still a lack of tools which help researchers to quickly evaluate new compu-tational methods, analyse new datasets, and select suitable methods for assisting with the design of experiments. It is time consuming for both bioinformaticians and biologists to test new ideas and explore miRNA functions. Bioinformaticians may need to go through a long process of searching and pre-processing the matched miRNA and mRNA datasets, repeating the computational methods and applying them to the input datasets, evaluating the predic-tions, and comparing the performance of their proposed method with other benchmark meth-ods. Biologists may find it difficult to quickly explore the regulatory relationships in their new data using some computational methods, or select a suitable model for generating hypotheses for experiment design.
To fill this gap, here we present an R package, miRLAB, to provide a comprehensive facility for exploring and experimenting with miRNA-mRNA regulatory relationships. miRLAB pro-vides a dry or computational laboratory on a single computer where one can load or retrieve datasets, test or apply new or existing computational methods, and validate predicted results, all in an automated manner.
miRLAB contains a set of commonly used miRNA and mRNA expression datasets and a pipeline to retrieve datasets from TCGA, and the scripts for pre-processing gene expression data such as differently expressed gene analysis. A number of easy-to-use benchmark computa-tional methods for inferring miRNA-mRNA regulatory relationships are embedded in miR-LAB (normally just one line of code for function call for each of the computational methods). miRLAB includes functions for validating the predictions using experimentally validated miRNA target data and miRNA perturbation data, and functions for enrichment analysis of miRNA target genes.
Users can use the package in different scenarios, including using the processed data included in miRLAB, TCGA data, and/or user provided datasets for testing a new computa-tional method developed by a user, by comparing the prediction results with those predicted by the embedded benchmark methods; investigating the regulatory relationships in cancers by applying a benchmark method to cancer datasets from TCGA or a dataset provided by a user; or comparing the performance of different methods on a new dataset given by user in order to select a suitable prediction method for assisting with the experiment design.
Materials and Methods
Workflow of miRLAB
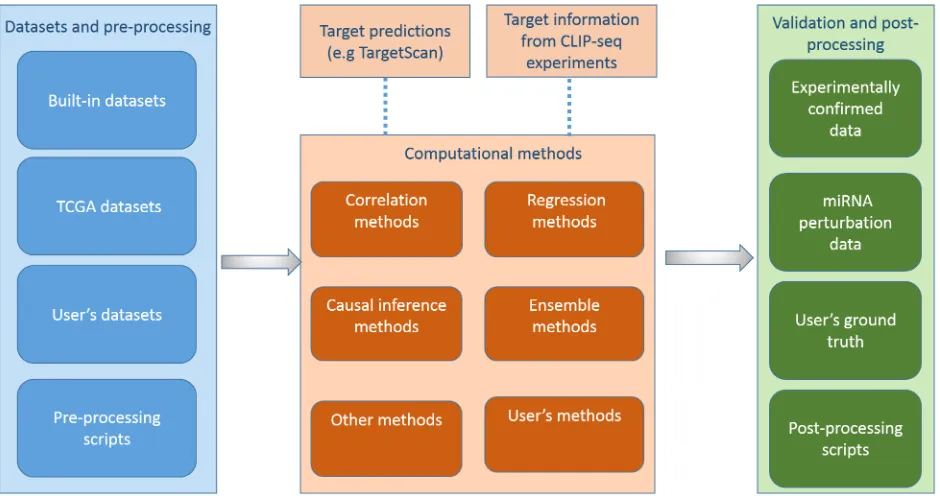
As illustrated inFig 1, miRLAB package provides a pipeline consisting of three components to identify and validate miRNA-mRNA regulatory relationships. In the following, we describe the workflow of miRLAB package in detail.
Datasets and pre-processing
We provide 3 processed gene expression datasets that can be downloaded from the package website at:http://sourceforge.net/projects/mirlab/files/?source = navbar, including the EMT (Epithelial to Mesenchymal Transition) [15], MCC (Multi-Class Cancer) [16,17], and PAN (Pan-Cancer in TCGA) [18] datasets. We use the limma package [19] of Bioconductor to iden-tify differentially expressed miRNAs and mRNAs. As a result of differential expression (DE) analysis, 35 miRNAs and 1154 mRNAs in the EMT dataset (adjusted p-value<0.05), and 108 miRNAs and 1860 mRNAs in the MCC dataset (adjustedp-value<0.05) are identified to be differentially expressed. Meanwhile, 103 miRNAs (adjustedp-value<10E-03) and 1553 mRNAs (adjustedp-value<10E-06) in the PAN cancer dataset are identified to be differen-tially expressed. The original expression dataset without the DE analysis are also available at the package website. Using theDiffExpAnalysisfunction in the package, users will be able to set their ownp-value thresholds for each dataset in the DE analysis.
We also provide the pipeline for downloading matched miRNA and mRNA expression pro-files for cancer datasets from TCGA based on TCGA Assembler [20]. Users can use abbrevi-ated cancer names as the input of thegetDatafunction of miRLAB to obtain matched miRNA and mRNA expression profiles in specific cancer.
Fig 1. The workflow of miRLAB package.The workflow mainly includes three components: Datasets and pre-processing, Computaional methods for exploration, and Validation and post-processing. It is optional to integrate miRNA target predictions and/or miRNA target binding information from CLIP-seq experiments to the computational models. Users can provide their own datasets/methods in each step of the workflow.
In addition, users can input their own datasets. It is noted that the input datasets should include matched samples of miRNA and mRNA expression data.
miRLAB provides several utilities for pre-processing input data, including data standardisa-tion (theStandardisefunction), missing value imputation and data normalisation (the Impute-NormDatafunction), and DE analysis (theDiffExpAnalysisfunction). Moreover, we have a function,convert, to convert between miRBase versions (currently versions 16-21) for a list of miRNAs. This function helps solve the problem of having multiple datasets with different miR-Base versions of miRNAs. We use miRmiR-Base version 17 for all miRNAs in our package, but users can change the miRBase version of the miRNAs in the output results to any other miR-Base version using theconvertfunction. We will also update the package when new versions of miRBase become available (and stable).
Computational methods
In miRLAB, we provide a number of commonly used computational methods for miRNA tar-get prediction. We have re-implemented the methods so that they are easy to use with a simple function call (just one line of code for calling most of the methods). We discuss the details of each of the implemented methods in the following. We will also describe how users can load an external method and run it in miRLAB, as well as how sequence based target information can be utilised with the embedded methods and user provided methods.
Correlation methods. Pearson’s correlation coefficient [21] is the commonly used mea-sure for the strength of the association between a pair of variables. For the miRNA target pre-diction problem, the correlations in the expression levels between pairs of miRNA and mRNA are calculated and the miRNA-mRNA pairs are ranked based on the correlation coefficient val-ues. As miRNAs mainly down-regulate mRNAs, negative correlations are ranked at the top.
Apart from Pearson’s correlation coefficient, in miRLAB we have implemented the other popular correlation methods, including Spearman [22], Kendall [23], Distance correlation (Dcov) [24], Hoeffding’s D measure (Hoeffding) [25], and Randomised Dependence Coeffi-cient (RDC) [26].
As correlation based methods are designed to capture only linear associations, and their useful-ness may be greatly reduced when the associations are non-linear [27], we also include the Mutual Information (MI) method [28] in the package to deal with non-linear relationship discovery.
Regression methods. Lasso [29] and Elastic-net [30] are popular high-dimensional regres-sion techniques which can be used to infer the association between variables. In our problem, each mRNA is presented as a linear expression of all miRNAs, and the coefficient of a miRNA in the regression model is used as the association strength between the miRNA and the mRNA. For each mRNA, we can perform Lasso or Elastic-net regression on all the miRNAs, using the R packageglmnet[31]. Similar to the correlation methods, the negative miRNA-mRNA effects are ranked at the top of the list to favour down-regulation.
Causal inference methods. Maathuis et al. [32,33] proposed a causal inference method, called Intervention calculus when the DAG (Directed Acyclic Graph) is Absent (IDA), which estimates the causal effect that a variable has on the other. The estimated causal effects simulate the effects of randomised controlled experiments. Recently, Le et al. [8] applied this method to gene expression datasets to infer the causal (regulatory) relationships between miRNAs and mRNAs. The discovered miRNA-mRNA causal regulatory relationships were found to have a large portion of overlap with the results of the follow-up gene knockdown experiments. There-fore, we include this method in miRLAB as one of the benchmark methods.
deviation of the expression level of each gene from the average expression of all genes. How-ever, in our study, we use observational data, i.e. gene expression data, as the input dataset. Therefore, the Z-score method is modified where we assume that the minimum expression value of the miRNA in a profile indicates the knockout experiment. In other words, we firstly locate the sample that contains the minimum value of the miRNA, and then we use the expres-sion value of the mRNA in the sample to calculate Z-score.
ProMISe [12] assumes that there is a competition between miRNAs to be attracted by a mRNA and between mRNAs to attract a miRNA for interactions. The method estimates the probability of a mRNA to be a target of the miRNA taking the competition between mRNAs and the competition between miRNAs into account. The method is implemented in the R packageRoleswitchfrom Bioconductor.
Ensemble methods. We also provide the scripts for creating ensemble methods from dif-ferent individual methods. The ensemble methods use the Borda count election method [35] to integrate the results from different individual methods. The aim of designing an ensemble method is to discover complement results using different individual methods [36]. In our implementation, we provide two slightly different versions of ensemble generation. The first version is faithful to the Borda rank idea, which outputs the average rank of all rankings from individual methods. In the second version, we do not use the whole ranking of each method to calculate the average, but only use the topktargets in each ranking. The second version is designed to appreciate the genes that are predicted within the topklists across methods. Genes outside the topklist of a method is assigned the maximal ranking for that method, i.e. the max-imum number of genes in the dataset. Although there is no theoretical background behind choosing the optimalk, the second version provides a tool for users to customise their experi-ments. For example, ones may want to find the targets of a miRNA predicted by the ensemble of three different methods, but they believe only the top 100 targets predicted by a method are of their interest, then in this case, the user can setk= 100.
Incorporating sequence based miRNA target information and gene expression data.
While gene expression data provides information of gene activities in a specific condition, sequence based target information indicates the actual binding activities between miRNAs and their target genes. In miRLAB, we provide an option to incorporate the target information from different sequence based prediction programs, e.g. TargetScan v6.2 [37], TargetScan v7.0 [38], DIANA-microT-CDS [39], or CLIP experiments, such as HITS-CLIP (also known as CLIP-Seq) [40], PAR-CLIP [41] and iCLIP [42] into each of the computational methods. We provide those databases in the package website. The results obtained by incorporating the tar-get information will be the interactions that are not only identified by the computational meth-ods using expression data but also predicted based on sequence information.
Validation and post-processing
It is difficult to validate computational results, as the number of experimentally confirmed tar-gets of miRNAs is still limited and there is no complete ground truth for evaluating and com-paring different computational methods [11]. In miRLAB, we provide two kinds of ground truth to validate the predictions of a computational method: experimentally confirmed miRNA target data and miRNA perturbation data.
duplicates, we have in total 62858 unique interactions for validations. Some of the interactions in miRTarBase and miRecords are validated using negative correlations in expression data only. We refer these interactions as weakly validated interactions, and provide another version of ground truth in which weakly validated interactions are removed. Both versions of the ground truth (with and without weakly validated interactions being removed) are available at the package website.
Secondly, we use the curated perturbation experiments from 177 tissues from [47] to vali-date the computational predictions. Perturbation experiments measure the gene expression levels in two groups, control group (without the miRNA of interest) and transfected group (with the miRNA of interest). The change in expression level of a gene in the two groups repre-sents the effect of the miRNA on the gene. We use the log2 fold-change (LFC) 1.0 as the thresh-old for cutting off the genes without significant changes. The genes with |LFC|>1 will be considered as the targets of the miRNA in the perturbation experiment.
To understand the underlying biological processes and pathways of miRNA targets, we pro-vide the pipeline for functional and pathway enrichment analysis, including two functions (GOBPenrichmentandKEGGenrichment) to conduct GO (Gene Ontology) [48] and KEGG (Kyoto Encyclopedia of Genes and Genomes) [49] enrichment analysis. Users only need to provide a list of gene symbols of interest and a p-value cutoff to get significant GO biological processes and KEGG pathways.
Results
The miRLAB package is designed to assist with exploring miRNA-mRNA regulatory relation-ships. The package is implemented in R and is available as a Bioconductor package athttp:// bioconductor.org/packages/miRLAB/. In the following, we present some typical scenarios of using the package with different purposes. All relevant datasets are available athttp:// sourceforge.net/projects/mirlab/files/?source = navbar. In this section, we demonstrate the usages of miRLAB in different scenarios.
Scenario 1: Using a built-in dataset for testing a new method
In this scenario, we suppose that a developer has created a new miRNA target prediction method and would like to quickly test its performance on a matched miRNA and mRNA gene expression dataset. We use the EMT dataset for demonstration in this scenario. The new method should return a matrix of prediction scores. Each cellcijof the matrix represents the score of the prediction that theithmRNA is a target of thejthmiRNA. As an example, we assume further that the new method is an ensemble method which combines the results of the Pearson correlation coefficient method and IDA. As illustrated below the whole procedure of creating and testing the new method includes only some lines of codes.
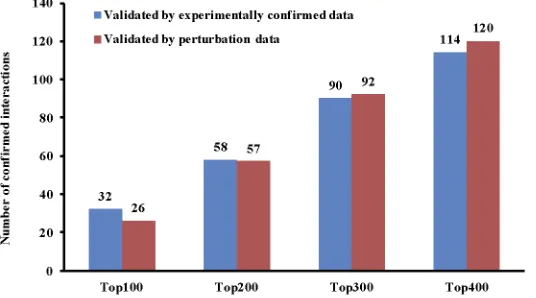
If we validate the results predicted by the new method for the top 100, 200, 300 and 400 tar-gets of each miRNA, we will come up with the total number of confirmed interactions shown inFig 2.
#Assume that the EMT35.csv has been downloaded from
#http://sourceforge.net/projects/mirlab/files/?source = navbar
#and placed in the working directory
library(miRLAB)
PearsonEMT=Pearson(“EMT35.csv”, cause=1:35, effect=36:1189)
IDAEMT=IDA(“EMT35.csv”, cause=1:35, effect=36:1189,“stable”,
NewMethod=Borda(list(PearsonEMT, IDAEMT)) #Validate the top 100 targets of each miRNA
#Assume that the groundtruth.csv is placed in the current directory
Result100=ValidateAll(NewMethod, topk=100,“groundtruth.
csv”,1.0)
Scenario 2: Comparing results of different methods on a new dataset
(user’s dataset)
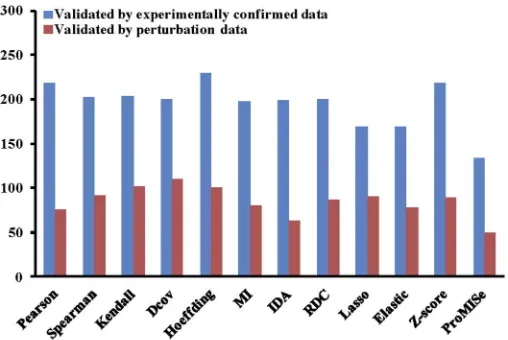
In this scenario, we assume that we have a new dataset and would like to apply different computational methods to the dataset and validate the results against current literature knowl-edge. As an example, we use the MCC dataset as the new dataset. In the following, we show the R code to compare the results of the 12 built-in methods for the MCC dataset. For each miRNA, we extract the top 100, 200, 300, and 400 target genes ranked by each method for vali-dation. We only keep the miRNAs that have at least one confirmed target predicted by all the methods. We calculate the ranking score of each method for the MCC dataset by summing up its ranking scores for all miRNAs. The higher the ranking score of a method, the better the method is. As shown inFig 3, when using experimentally confirmed data as ground truth, Pearson correlation coefficient performs the best. If the ground truth is perturbation data, Hoeffding outperforms the other methods.
#Assume that“MCC.csv”plays the role of a user’s dataset
#and has been placed in the working directory
library(miRLAB)
cause=1:108 #in the MCC dataset, the first 108 columns are
miRNAs
effect=109:1968
pearson=Pearson(“MCC.csv”, cause, effect)
spearman=Spearman(“MCC.csv”, cause, effect)
kendall=Kendall(“MCC.csv”, cause, effect)
Fig 2. The number of confirmed miRNA-mRNA interactions by experimentally confirmed data and perturbation data.The top 100, 200, 300, and 400 interactions for each miRNA are selected for the validation in the EMT dataset.
dcov=Dcov(“MCC.csv”, cause, effect)
hoeffding=Hoeffding(“MCC.csv”, cause, effect)
mi=MI(“MCC.csv”, cause, effect)
ida=IDA(“MCC.csv”, cause, effect,“stable”, 0.01)
rdc=RDC(“MCC.csv”, cause, effect)
lasso=Lasso(“MCC.csv”, cause, effect)
elastic=Elastic(“MCC.csv”, cause, effect)
zscore=Zscore(“MCC.csv”, cause, effect)
promise=ProMISe(“MCC.csv”, cause, effect)
all = list(pearson, spearman, kendall, dcov, hoeffding, mi, ida, rdc, lasso, elastic, zscore, promise)
allresultsTop100=experiment(all, topk=100,“groundtruth.
csv”,1.0)
compareTop100=filterAndCompare(allresultsTop100, 1)
Scenario 3: Running a benchmark method for a TCGA cancer dataset
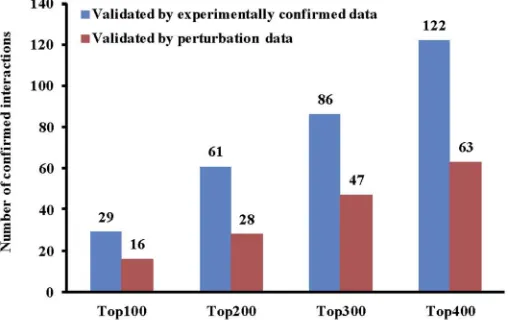
It is very useful to utilise the wealth amount of data in TCGA for exploring miRNA functions in cancer. In this scenario, we assume that we would like to apply a causal inference method (IDA) for predicting miRNA targets in the Prostate adenocarcinoma (PRAD) dataset. We will firstly use the built-ingetDatafunction to get the matched samples of miRNA and mRNA expression profiles from TCGA directly. We can then conduct the DE analysis for the down-loaded PRAD dataset using the functionDiffExpAnalysis. After pre-processing the dataset, we use IDA to infer miRNA-mRNA interactions and validate them by using two types of ground truth (experimentally confirmed data and miRNA perturbation data). The R code for the whole process is shown in the following. If we respectively validate the top 100, 200, 300, 400 targets of each miRNA and summarise the results, we will have the total number of confirmed interactions as shown inFig 4.
library(miRLAB)
RawPRAD=getData(“PRAD”)
Fig 3. Comparison of the 12 built-in miRNA target prediction methods.The experimentally confirmed data and perturbation data are used for the validation in the MCC dataset. The top 100 targets of each miRNA are extracted for validation.
write.csv(RawPRAD,“RawPRAD.csv”) #Diffrentially expressed analysis.
#Preparing csv files for miRNA and mRNA in each condition, #e.g. tumor vs normal.
PRAD=DiffExpAnalysis(“miRNA_Tumor.csv”,“miRNA_Normal.csv”,
“mRNA_Tumor.csv”,“mRNA_Normal.
csv”,50,1000)
write.csv(PRAD,“PRAD-50.csv”, row.names=FALSE)
datacsv=“PRAD-50.csv”
idaPRAD=IDA(datacsv, cause=1:50, effect=51:1050,“stable”,
0.01)
ResultsPRAD100=ValidateAll(idaPRAD, topk=100,
“Groundtruth”,1.0)
Scenario 4: Using target information together with a built-in method
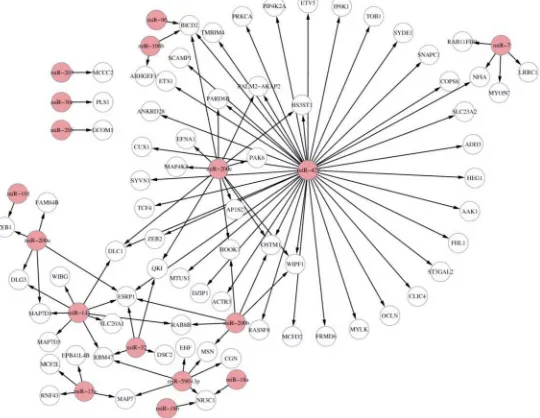
In this scenario, we incorporate target binding information and gene expression data to infer the miRNA-mRNA relationships. Suppose that we use TargetScan v6.2 as target information together with IDA as the computational method to infer miRNA-mRNA interactions. We use the built-in EMT dataset for demonstration in this scenario. In order to understand the poten-tial biological processes and pathways of the top miRNA-mRNA interactions, we also make GO and KEGG enrichment analysis of miRNA targets using theGOBPenrichmentand KEG-Genrichmentfunctions, respectively. The code for running this procedure is as follows and the top 100 miRNA-mRNA interactions for all miRNAs are shown inFig 5. The results of signifi-cant GO and KEGG terms (adjustedp-value<0.05) are found inS1 File.
library(“miRLAB”)
#Assume that the“EMT.csv”dataset and the target information
file,
#“Targetscan.csv”, have been placed in the working directory.
Fig 4. The number of confirmed miRNA-mRNA interactions by experimentally confirmed data and perturbation data.The top 100, 200, 300, and 400 interactions for each miRNA are selected for the validation in the PRAD dataset from TCGA.
idaTargetscan =IDA(datacsv, cause=1:35, effect=36:1189,
“stable”, 0.01, targetbinding=“TargetScan.
csv”)
idaTop100=Extopk(idaTargetscan,topk=100)
idaGO=GOBPenrichment(unique(idaTop100[,2]),0.05)
idaKEGG=KEGGenrichment(unique(idaTop100[,2]),0.05)
Scenario 5: Comparing results predicted from external methods
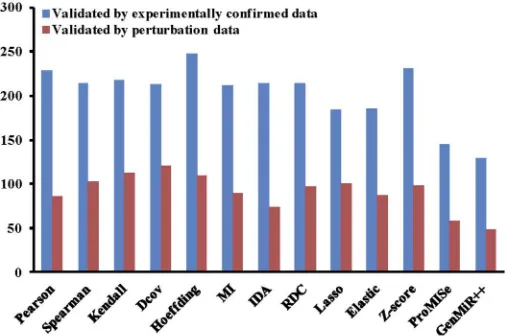
There are other miRNA target prediction methods that are either implemented in R or in other programming languages. It is possible to validate the predicted results from those methods using miRLAB, and comparing the performance of those methods with the miRLAB built-in methods. In this scenario, we demonstrate how to validate the results generated by GenMiR++ [7], which was implemented in Matlab. The output result of GenMiR++ for the MCC dataset is available on the package website at:http://sourceforge.net/projects/mirlab/files/?source = navbar. We can also compare the performance of the external method with other built-in methods in miRLAB.Fig 6shows the comparison results of GenMiR++ and the 12 methods in miRLAB for the MCC dataset using the ranking scores as in Scenario 2.
library(“miRLAB”)
#Assume that the“MCC.csv”dataset and the GenMiR++ output file,
#“gmMCC.csv”, have been placed in the working directory.
cause=1:108 #in the MCC dataset, the first 108 columns are
miRNAs
effect=109:1968
#Read results predicted by GenMiR++
Fig 5. Visualisation of top 100 miRNA-mRNA interactions for all miRNAs in the EMT dataset.
TargetScan is used as the putative target information. The pink nodes are miRNAs, and the white nodes are mRNAs.
genmir=ReadExtResult(“MCC.csv”, cause, effect,“gmMCC.csv”)
#Validate the top 100 targets of each miRNA
#Assume that the groundtruth.csv is placed in the current directory
Result100=ValidateAll(genmir, topk=100,“groundtruth.csv”,1.0)
Discussions
In this paper, we provide an R environment to explore miRNA functions. The 12 built-in meth-ods can be applied to expression data with or without target information. As we do not have the complete ground truth for evaluating the models, it is impossible to conclude which method is better than the other. Using the current knowledge on the experimentally confirmed miRNA tar-gets, our previous experimental results show that there is no superior method that outperforms all other methods in the three datasets [36]. Moreover, different computational methods may predict different sets of miRNA targets [11], suggesting that each method has their own merits. In the following, we briefly discuss the characteristics of different groups of computational meth-ods which may serve as a guide for selecting the methmeth-ods for a particular dataset.
Correlation and mutual information methods are suitable for high dimensional datasets. Since these groups of methods only consider the pairwise relationships between a miRNA and a mRNA, the methods are good candidates for datasets with large number of features (miRNAs and mRNAs). The assumption on the relationships between miRNAs and mRNAs will decide which method in this category should be used. For example, if we assume linear relationships between miRNAs and mRNAs, Pearson correlation coefficient would be suitable. Meanwhile, for non-linear relationships, a mutual information method should be chosen.
For datasets with small number of miRNAs, regression methods would be great candidates. In the regression model, a mRNA is represented as a function of all miRNAs in the dataset. Therefore, with relatively small number of samples in real world datasets, the regression meth-ods would achieve better results when we do not have too many miRNAs in a dataset.
The causal inference methods have been demonstrated to be effective in removing spurious relationships. However, the complexity of the causal inference is high and therefore it would be suitable for datasets with relatively small number of features (miRNAs and mRNAs).
Fig 6. Comparison of the 12 built-in miRNA target prediction methods and the external method GenMiR++.The experimentally confirmed data and perturbation data are used for the validation of the results the MCC dataset. The top 100 targets of each miRNA are extracted for validation.
Alternatively, these causal inference methods would require high performance computers to run with large datasets.
In the general case, users may want to use an ensemble method which integrates the predic-tions from different methods. The ensemble approach has been proved theoretically and exper-imentally to outperform individual methods across different datasets [35], especially, when integrating methods from different approaches. In the package we provide a function to gener-ate an ensemble method by combining different built-in computational methods. Moreover, users can also read results from any external methods into R using theReadExtResultfunction as demonstrated in Scenario 5, and then the ensemble method can be formed by combining the external methods or combining external methods with the built-in methods. This would help users create new ensemble methods when novel computational methods become available in the future.
Conclusion
In recent years, miRNAs have been found to play pivotal roles at the post-transcriptional level. By fine-tuning the expression levels of target genes, miRNAs play important roles in many bio-logical processes and different diseases, including cancer. Thus, exploring miRNA-mRNA reg-ulatory relationships is vital in understanding biological processes and may provide insights into the regulatory mechanism of miRNAs in the pathophysiology of diseases.
To date, several computational methods have been proposed to infer miRNA-mRNA regu-latory relationships using expression data with or without miRNA target information. Each of the methods has its own merits and no single method always performs the best in all datasets. There is still a lack of tools for evaluating computational methods and exploring miRNA func-tions in a new dataset, validating miRNA prediction results, and selecting suitable methods for assisting experiment design.
To address the problem, we propose the idea of creating a comprehensive dry lab environ-ment on a single computer. Following the idea, we have developed an R package called miR-LAB, to provide such a computational lab for exploring and experimenting with miRNA-mRNA regulatory relationships. miRLAB includes three components: Datasets and pre-pro-cessing, Computational methods, and Validation and post-processing. In this paper, we have used five different scenarios to show how to use the package. Details of all functions are listed in the user manual and users may design their own workflow using those easy-to-use functions.
Supporting Information
S1 File. Significant GO terms and KEGG pathways generated in Scenarios 4.
(XLSX)
Author Contributions
Conceived and designed the experiments: TDL JL. Performed the experiments: TDL JZ HL. Analyzed the data: TDL JZ LL. Contributed reagents/materials/analysis tools: TDL HL. Wrote the paper: TDL LL JL JZ.
References
1. Liu B, Li J, Cairns MJ. Identifying miRNAs, targets and functions. Briefings in bioinformatics. 2012; 15:1–19. doi:10.1093/bib/bbs075PMID:23175680
2. Rajewsky N. microRNA target predictions in animals. Nature genetics. 2006; 38:S8–S13. doi:10.1038/ ng1798PMID:16736023
3. Liu H, Brannon AR, Reddy AR, Alexe G, Seiler MW, Arreola A, et al. Identifying mRNA targets of micro-RNA dysregulated in cancer: with application to clear cell Renal Cell Carcinoma. BMC systems biology. 2010; 4(1):51. doi:10.1186/1752-0509-4-51PMID:20420713
4. Van der Auwera I, Limame R, Van Dam P, Vermeulen P, Dirix L, Van Laere S. Integrated miRNA and mRNA expression profiling of the inflammatory breast cancer subtype. British journal of cancer. 2010; 103(4):532–541. doi:10.1038/sj.bjc.6605787PMID:20664596
5. Lu Y, Zhou Y, Qu W, Deng M, Zhang C. A Lasso regression model for the construction of microRNA-tar-get regulatory networks. Bioinformatics. 2011; 27(17):2406–2413. doi:10.1093/bioinformatics/btr410 PMID:21743061
6. Muniategui A, Nogales-Cadenas R, Vázquez M, Aranguren XL, Agirre X, Luttun A, et al. Quantification of miRNA-mRNA interactions. PloS one. 2012; 7(2):e30766–e30766. doi:10.1371/journal.pone. 0030766PMID:22348024
7. Huang JC, Babak T, Corson TW, Chua G, Khan S, Gallie BL, et al. Using expression profiling data to identify human microRNA targets. Nature methods. 2007; 4(12):1045–1049. doi:10.1038/nmeth1130 PMID:18026111
8. Le TD, Liu L, Tsykin A, Goodall GJ, Liu B, Sun BY, et al. Inferring microRNA–mRNA causal regulatory relationships from expression data. Bioinformatics. 2013; 29(6):765–771. doi:10.1093/bioinformatics/ btt048PMID:23365408
9. Zhang J, Le TD, Liu L, Liu B, He J, Goodall GJ, et al. Identifying direct miRNA–mRNA causal regulatory relationships in heterogeneous data. Journal of biomedical informatics. 2014; 52:438–447. doi:10. 1016/j.jbi.2014.08.005PMID:25181465
10. Zhang J, Le TD, Liu L, Liu B, He J, Goodall GJ, et al. Inferring condition-specific miRNA activity from matched miRNA and mRNA expression data. Bioinformatics. 2014;p. btu489.
11. Le TD, Liu L, Zhang J, Liu B, Li J. From miRNA regulation to miRNA–TF co-regulation: computational approaches and challenges. Briefings in bioinformatics. 2015; 16(3):475–496. doi:10.1093/bib/bbu023 PMID:25016381
12. Li Y, Liang C, Wong KC, Jin K, Zhang Z. Inferring probabilistic miRNA–mRNA interaction signatures in cancers: a role-switch approach. Nucleic acids research. 2014; 42(9):e76–e76. doi:10.1093/nar/ gku182PMID:24609385
13. Liu B, Li J, Tsykin A, Liu L, Gaur AB, Goodall GJ. Exploring complex miRNA-mRNA interactions with Bayesian networks by splitting-averaging strategy. BMC bioinformatics. 2009; 10(1):408. doi:10.1186/ 1471-2105-10-408PMID:20003267
14. Le TD, Liu L, Liu B, Tsykin A, Goodall GJ, Satou K, et al. Inferring microRNA and transcription factor regulatory networks in heterogeneous data. BMC bioinformatics. 2013; 14(1):92. doi: 10.1186/1471-2105-14-92PMID:23497388
15. Søkilde R, Kaczkowski B, Podolska A, Cirera S, Gorodkin J, Møller S, et al. Global microRNA analysis of the NCI-60 cancer cell panel. Molecular cancer therapeutics. 2011; 10(3):375–384. doi:10.1158/ 1535-7163.MCT-10-0605PMID:21252286
17. Ramaswamy S, Tamayo P, Rifkin R, Mukherjee S, Yeang CH, Angelo M, et al. Multiclass cancer diag-nosis using tumor gene expression signatures. Proceedings of the National Academy of Sciences. 2001; 98(26):15149–15154. doi:10.1073/pnas.211566398
18. Cheng WY, Yang THO, Shen H, Laird PW, Anastassiou D, et al. Multi-cancer molecular signatures and their interrelationships. arXiv preprint arXiv:13062584. 2013;.
19. Smyth GK. Limma: linear models for microarray data. In: Bioinformatics and computational biology solutions using R and Bioconductor. Springer; 2005. p. 397–420.
20. Zhu Y, Qiu P, Ji Y. TCGA-Assembler: open-source software for retrieving and processing TCGA data. Nature methods. 2014; 11(6):599–600. doi:10.1038/nmeth.2956PMID:24874569
21. Pearson K. Notes on the history of correlation. Biometrika. 1920;p. 25–45.
22. Spearman C.“General Intelligence,”objectively determined and measured. The American Journal of Psychology. 1904; 15(2):201–292. doi:10.2307/1412107
23. Kendall MG. A new measure of rank correlation. Biometrika. 1938;p. 81–93. doi:10.2307/2332226
24. Székely GJ, Rizzo ML, Bakirov NK, et al. Measuring and testing dependence by correlation of dis-tances. The Annals of Statistics. 2007; 35(6):2769–2794. doi:10.1214/009053607000000505
25. Hoeffding W. A non-parametric test of independence. The Annals of Mathematical Statistics. 1948;p. 546–557. doi:10.1214/aoms/1177730150
26. Lopez-Paz D, Hennig P, Schölkopf B. The randomized dependence coefficient. In: Advances in Neural Information Processing Systems; 2013. p. 1–9.
27. Speed T. A correlation for the 21st century. Science. 2011; 334(6062):1502–1503. doi:10.1126/ science.1215894PMID:22174235
28. Moon YI, Rajagopalan B, Lall U. Estimation of mutual information using kernel density estimators. Physical Review E. 1995; 52(3):2318–2321. doi:10.1103/PhysRevE.52.2318
29. Tibshirani R. Regression shrinkage and selection via the lasso. Journal of the Royal Statistical Society Series B (Methodological). 1996;p. 267–288.
30. Zou H, Hastie T. Regularization and variable selection via the elastic net. Journal of the Royal Statistical Society: Series B (Statistical Methodology). 2005; 67(2):301–320. doi:10.1111/j.1467-9868.2005. 00503.x
31. Friedman J, Hastie T, Tibshirani R. Regularization paths for generalized linear models via coordinate descent. Journal of statistical software. 2010; 33(1):1. doi:10.18637/jss.v033.i01PMID:20808728
32. Maathuis MH, Kalisch M, Bühlmann P, et al. Estimating high-dimensional intervention effects from observational data. The Annals of Statistics. 2009; 37(6A):3133–3164. doi:10.1214/09-AOS685
33. Maathuis MH, Colombo D, Kalisch M, Bühlmann P. Predicting causal effects in large-scale systems from observational data. Nature Methods. 2010; 7(4):247–248. doi:10.1038/nmeth0410-247PMID: 20354511
34. Prill RJ, Marbach D, Saez-Rodriguez J, Sorger PK, Alexopoulos LG, Xue X, et al. Towards a rigorous assessment of systems biology models: the DREAM3 challenges. PloS one. 2010; 5(2):e9202. doi:10. 1371/journal.pone.0009202PMID:20186320
35. Marbach D, Costello JC, Küffner R, Vega NM, Prill RJ, Camacho DM, et al. Wisdom of crowds for robust gene network inference. Nature methods. 2012; 9(8):796–804. doi:10.1038/nmeth.2016PMID: 22796662
36. Le TD, Zhang J, Liu L, Li J. Ensemble Methods for MiRNA Target Prediction from Expression Data. PloS one. 2015; 10(6):e0131627. doi:10.1371/journal.pone.0131627PMID:26114448
37. Lewis BP, Shih Ih, Jones-Rhoades MW, Bartel DP, Burge CB. Prediction of mammalian microRNA tar-gets. Cell. 2003; 115(7):787–798. doi:10.1016/S0092-8674(03)01018-3PMID:14697198
38. Agarwal V, Bell GW, Nam JW, Bartel DP. Predicting effective microRNA target sites in mammalian mRNAs. eLife. 2015; 4. doi:10.7554/eLife.05005
39. Paraskevopoulou MD, Georgakilas G, Kostoulas N, Vlachos IS, Vergoulis T, Reczko M, et al. DIANA-microT web server v5.0: service integration into miRNA functional analysis workflows. Nucleic Acids Research. 2013; 41(W1):W169–W173. Available from:http://nar.oxfordjournals.org/content/41/W1/ W169.abstractdoi:10.1093/nar/gkt393PMID:23680784
40. Darnell RB. HITS-CLIP: panoramic views of protein–RNA regulation in living cells. Wiley Interdisciplin-ary Reviews: RNA. 2010; 1(2):266–286. doi:10.1002/wrna.31PMID:21935890
42. König J, Zarnack K, Luscombe NM, Ule J. Protein–RNA interactions: new genomic technologies and perspectives. Nature Reviews Genetics. 2012; 13(2):77–83. doi:10.1038/nrg3141PMID:22251872
43. Vergoulis T, Vlachos IS, Alexiou P, Georgakilas G, Maragkakis M, Reczko M, et al. TarBase 6.0: cap-turing the exponential growth of miRNA targets with experimental support. Nucleic acids research. 2012; 40(D1):D222–D229. doi:10.1093/nar/gkr1161PMID:22135297
44. Xiao F, Zuo Z, Cai G, Kang S, Gao X, Li T. miRecords: an integrated resource for microRNA–target interactions. Nucleic acids research. 2009; 37(suppl 1):D105–D110. doi:10.1093/nar/gkn851PMID: 18996891
45. Dweep H, Sticht C, Pandey P, Gretz N. miRWalk–database: prediction of possible miRNA binding sites by walking the genes of three genomes. Journal of biomedical informatics. 2011; 44(5):839–847. doi: 10.1016/j.jbi.2011.05.002PMID:21605702
46. Hsu SD, Tseng YT, Shrestha S, Lin YL, Khaleel A, Chou CH, et al. miRTarBase update 2014: an infor-mation resource for experimentally validated miRNA-target interactions. Nucleic acids research. 2014; 42(D1):D78–D85. doi:10.1093/nar/gkt1266PMID:24304892
47. Li Y, Goldenberg A, Wong KC, Zhang Z. A probabilistic approach to explore human miRNA targetome by integrating miRNA-overexpression data and sequence information. Bioinformatics. 2013;p. btt599.
48. Ashburner M, Ball CA, Blake JA, Botstein D, Butler H, Cherry JM, et al. Gene Ontology: tool for the unifi-cation of biology. Nature genetics. 2000; 25(1):25–29. doi:10.1038/75556PMID:10802651