THE IMPACT OF CONSERVATISM TO EARNINGS QUALITY OF LISTED MANUFACTURING COMPANY IN INDONESIA
Melisa Stefani Dewi Ratnaningsih
International Financial Accounting Program, Faculty of Economics, Universitas Atma Jaya Yogyakarta
Jalan Babarsari 43-44, Yogyakarta
ABSTRACT
This study aimed to investigate the impact of conservatism to the quality of earnings information. Conservatism is one of accounting topic that become an important issue, as its impact to accounting fieldwork can be positive and negative. While earnings information is crucial information needed for the users to make economic decision. Samples in this study are listed manufacturing companies in Indonesia. Conservatism is the independent variable. Earnings quality as dependent variable will be represented by earnings management.
The result of this study show positive impact of conservatism to earnings quality. Conservatism is proven to increase earnings quality by decreasing the level of earnings management in the company. The result of this study complement previous studies findings.
Key words: Conservatism; Earnings Quality; Earnings Management; Market to Book Value; Discretionary Accruals
I. Introduction A. Background
One of components in financial statement is earnings. Earnings can be considered as the most important information in financial statement to make investment decision. From earnings number, investors do not only get the insight about company performance but also its ability to pay dividend. A company needs to have sustainable growing earnings to attract investors. Sustainable and growing earnings mean the company will be profitable in the future and able to continuously pay dividend, while company with small and unsustainable earnings may less profitable in the future. The latter tend to be less attractive in investors point of view. Hence, management will carefully present earnings and try to make earnings more appealing.
Appealing earnings, however, does not always show good earnings quality. Many practices can be used by management to provide appealing earnings. Most of them, although not all, can reduce the quality of information present in financial statement. Earnings information could be manipulated due to the advantage held by manager over investor. Manager has more information about company’s condition compare to investor as outside party who does not involve in company activity. This information asymmetry will give opportunity to manager to perform earnings manipulation. Hence, appealing earnings reported by manager have high possibility to be manipulated.
Criteria for good earnings quality also mention in Dechow et al. (2010) and Schipper and Vincent (2003), as they defined earnings quality as the quality that earnings should have to make it useful for decision making. If earnings cannot provide information that can be used to make decision, then it can be said as poor earnings quality. Srinidhi et al. (2011), Bellovary et al. (2005), and Li (2011) stated that good earnings quality means that current period earnings can be used as benchmark to predict future earnings. In other words, earnings information will not significantly change from time to time. Hence, we can say good earnings quality can be achieve if the information useful to make decision, which is to predict the future earnings.
This study follows the view that good earnings quality is earnings information which contains no manipulation practice. The act of earnings manipulation by managers or earning management will result in misleading information. This type of information will not be able to fulfill the objective of financial statement which is provides information that assist its user to make decision. To limit the practice of earnings management, company can use prudence or conservatism. Conservatism is one principle that able to reduce manager’s opportunity to do earnings management. Eventually, it will lead to the achievement of good earnings quality.
Prudence as mention earlier, it is one component of qualitative characteristic that require higher degree of caution in presenting information when uncertainty occur. Conservatism also can be means as the action to choose decision that will less not overstating income and assets when dealing with uncertainty condition. Conservatism from Kimmel et al. (1998) and Marshal et al. (2002) point view is the principle used by accountant to make judgment and estimates that will result in lower profits and asset valuation estimates. Conservatism principle contradicts with earnings management as it does not allowed manager to overstate earnings number to get certain amount of bonus or incentives. Hence, conservatism practice in the company can reduce the level of earnings management.
This study supports the view of conservatism role in reducing earnings management practice. The low level of earnings management results in higher earnings quality, as earnings information reflect company’s real condition. Previous studies result shows that applying conservatism result in lower earnings management level. As mention by Watts (2003), LaFond and Watts (2008), and Haniati and Fitriany (2010) conservatism reduce the manipulation practices by management as its limit manager’s opportunity to overstate assets and earnings number. Moreover, conservatism principle also requires manager to use higher degree of caution when dealing with uncertainty. Hence, it can be said that conservatism lead to more precise presentation of earnings information and less uncertainty earnings information which mean good earnings quality.
Does conservatism give impact to earnings quality of listed companies in Indonesia? C. Research Objective
This study will provide the answer along with empirical evidence whether conservatism gives impact to earnings quality of listed companies in Indonesia.
II. Theoretical Background and Hypothesis Development
Earnings quality is the quality of earnings information reported in financial statement. Good earnings quality should be able to help users in assessing company’s financial condition. In order to be useful in helping users to make economic decision, information should be presented faithfully and contain no error and bias. In addition, earnings information should be precise or contain less uncertainty.
In reality, good earnings quality sometimes does not pleased investors. This is due to the actual earnings number appeared low or negative in financial statements as company face bad economic condition. When managers deal with such condition, it is hard to achieve appealing earnings number. Hence, they will try to manipulate earnings number to pleased investors. This manipulation practices are widely known in accounting fieldwork as earnings management.
In company’s life cycle, uncertainty conditions are difficult to avoid. It gives management room to choose different accounting method and policies. As often happens, opportunistic managers may choose different accounting method and policies to obtain personal goals. Their action will eventually lead to earnings manipulation practices or known as earnings management. Since earnings management result in bias and less precise earnings information, earnings management practice decrease earnings quality.
In order to reduce the opportunistic behavior of managers in uncertainty condition, accounting standards propose conservatism principle. Under conservatism principle, managers are required to have higher degree of caution in dealing with uncertainty situation. It also requires managers to choose accounting method and policies that will not overstate income and assets. Hence, managers have limited accounting method and policies to choose in order to fully implement conservatism.
Watts study entitled “Conservatism in Accounting” (2003) mentioned that conservatism asymmetric verification limits incentives and opportunity of manager to give bias and noise information. In other word, conservatism limits manager opportunity in practicing earnings management. This bias and noise information decrease earnings quality, as good earnings quality should faithfully represent company’s real condition and contain no bias and error. Watts suggest that conservatism decrease earnings management and eventually lead to higher earnings quality.
Supporting Watts (2003) study, Lafond and Watts (2008), Lara et al. (2012), and Haniati and Fitriany (2010) also found conservatism implementation decrease earnings management. Due to its requirement to not overstated assets and earnings, managers attempt to perform earnings management that lead to higher earnings number is decreased. This study attempts to find the same result as previous studies, which is conservatism lead to good earnings quality. The way conservatism increase earnings quality is with decreasing management opportunity in practicing earnings management. These arguments lead to the following hypothesis:
H1: Conservatism increase earnings quality of listed companies in Indonesia.
III. Research Metodology
1. Population and Research Samples
(2014), that accrual model used as proxy for earnings management is proven to be more suitable for manufacturing companies in Indonesia. This study use purposive sampling in order to obtain suitable sample based on criteria.
2. Data Collection Method
This study use secondary data collection method. The data will be collected from existing database of listed company financial statements and stock price. From the database, this study will download complete financial statements that consist of statement of comprehensive income, statement of financial statement, statement of changes in owners’ equity and statement of cash flow. For stock price data, this study use information from Yahoo Finance website.
3. Operational Definition and Measurement of Research Variables a. Independent Variable
This study will measure conservatism using the measurement developed by Beaver and Ryan (2000). They use market to book value ratio to measure conservatism. This proxy has been proven to be used as conservatism measurement by fellow researcher Watts (2003). The proxy for conservatism is
Where,
= the level of conservatism
= company’s outstanding shares at the end of period = company’s shares price at the end of period
= company’s total equity
This measurement is in accordance with conservatism as accounting principle that will result in lower company’s book value compare to its market value. The company’s book value represent by its total equity, while its market value represent by its shares market price. The value of more than one means company implements conservatism principle, because company record book value lower than its market value.
b. Dependent Variable
This study use earnings management as proxy for earnings quality. Earnings management is deliberate action of managers to manipulate or manage earnings to provide result that will give huge benefit for them. This action will decrease the quality of information reported on financial statements, because the information contain bias that will lead to investor misinterpretation. Hence, the dependent variable in this study is earnings quality that measure by earnings management.
This study will measure earnings management using modified Jones model of abnormal accrual. This proxy has been proven to be the best measurement for accrual earnings management by Dechow et al. (1995) and Suranggane (2007). Below is regression model to find abnormal accrual, widely known as Modified Jones model:
Where
= total accruals in period t = The change in revenue
= the change in account receivable = total assets in period t-1
= the sum of property, plant, and equipment
Where
= total accruals in period t = net income in period t
= cash flow from operational activity in period t
Total accruals consist of two components, namely discretionary and non-discretionary accrual. The abnormal accrual is represents by non-discretionary accrual. Discretionary accrual in the regression model is the .
| | Where,
= Discretionary accruals in period t
The expected value of error is negative, hence the absolute is needed to make it positive. The higher the result of means the higher earnings management practices or the lower its earnings quality. On the contrary, the lower the result means decrease earnings management or higher earnings quality.
c. Control Variables
This variable may influence dependent variable, however the level of influence is not high. Hence, this study include control variable to reduce the bias result if this variable being omitted. There are three control variables in this study.
Leverage
The first control variable in this study is leverage. It has been prove by DeAngelo et al. (1994) and Permatasari (2005) that this variable influences the earnings management in the company. The higher the leverage ratio means the higher discretionary accruals of the company. This is due to the financial pressure of high leverage firm will lead them to do income-decreasing accruals in order to renegotiate debt covenant. This study will measure leverage using equation below:
Firm Size
The second control variable in this study is based on Nelson et al. (2002), Kim et al. (2003), Permatasari (2005), and Llukani (2013) study. They found firm size influence the earnings management. Both small size and big size firm use earnings management to achieve certain objective. The bigger the size of the firm means the higher abnormal accruals or discretionary accruals. This is due to the higher bargaining power held by big size firm to the auditor. The auditor will loosen the earnings management practice done by big size firm. This study will measure firm using natural logarithm of total assets
Auditor
The third control variable in this study is based on Becker et al. (1998), Gore et al. (2001), and Permatasari (2005) study. They found audit firm which perform the audit process have influence to earnings management level in the company. As in the previous studies, this study will divide the audit firm into two groups. First group is audit firm which include in big four audit firms, such as Deloitte, KPMG, PwC, and EY. Second group is audit firms which not include in big four audit firms. The result of previous studies shows lower earnings management practices in big four audit firms.
Where is equal 1 for The Big Four audit firms and 0 for audit firms outside The Big Four.
4. Data Analysis
Based on sample criterias, there are 86 companies that can be used as samples from period 2010-2014. Hence, the total final sample for this study is 430. The samples have been check thoroughly and all variable required can be obtained.
a. Normality Test
This study will test the normality of data using Kolmogorov-Smirnov Normality Test. This test will provide information about the normality of data distribution. The criteria to make decision are shown below:
If significance value > 0.05, then it can be said that the data have normal distribution.
If significance value < 0.05, then it can be said that the data have abnormal distribution.
b. Multicollinearity Test
This study will test the relation between each independent variable. The relation between each independent variable should not be existed to fulfill regression model requirement. This study use Value Inflation Factor (VIF). The criteria to make decision are shown below:
If VIF < 10 and Tolerance > 0.1, then it can be said there is no multicollinearity
If VIF > 10 and Tolerance < 0.1, then it can be said there is multicollinearity c. Heteroscedasticity Test
This study will test the distribution of residual value or error for each independent variable using Glejser Test. It regresses independent variable with its absolute residual value. To fulfill the regression model requirement, the residual value should be the same (no unequal variance) for each independent variable. The criteria to make decision are shown below:
If significance value > 0.05 then it can be said there is no heteroscedasticity. If significance value < 0.05 then it can be said there is heteroscedasticity. d. Autocorrelation Test
This study will test the correlation between residual value in one period and other period. The requirement for regression model is the absence of correlation of residual value from period to period. Durbin-Watson (DW) test will be used to find the existence of correlation. The criteria to make decision are shown below:
If d < dL or d > 4-dL, then it can be said there is autocorrelation If dU < d < 4-dU, then it can be said there is no autocorrelation e. Hypothesis Test
To test the hypothesis, this study uses multiple regression model below:
Where
= the discretionary accruals = the level of conservatism
= the level of company leverage
= the dummy variable that identify audit firm which perform audit process for the company
The criteria used to make decision about the hypothesis are shown below: Ha accepted if P-value < 0.05 and < 0
Ha rejected if P-value ≥ 0.05 and ≥ 0
The higher the level of conservatism will result in lower earnings management or discretionary accruals . The lower the discretionary accruals result in higher earnings quality, hence alternative hypothesis will be accepted if there is negative relationship between and .
IV. Result
The samples in this study are listed manufacturing companies in Indonesia from period 2010-2014. It should fulfill three criteria mentioned in previous chapter, 1) listed manufacturing company that publish financial statements persistently from year 2010-2014, 2) company use Rupiah as their functional currency 3) company has positive equity number. Based on these criteria, there are 86 companies that can be used as samples from period 2010-2014. Hence, the total final sample for this study is 430. The samples have been check thoroughly and all variable required can be obtained.
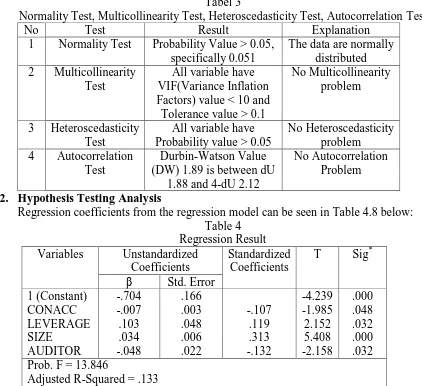
[image:7.595.95.517.345.731.2]1. Normality Test, Multicollinearity Test, Heteroscedasticity Test, Autocorrelation Test
Tabel 3
Normality Test, Multicollinearity Test, Heteroscedasticity Test, Autocorrelation Test
No Test Result Explanation
1 Normality Test Probability Value > 0.05, specifically 0.051
The data are normally distributed 2 Multicollinearity
Test
All variable have VIF(Variance Inflation Factors) value < 10 and
Tolerance value > 0.1
No Multicollinearity problem
3 Heteroscedasticity Test
All variable have Probability value > 0.05
No Heteroscedasticity problem 4 Autocorrelation
Test
Durbin-Watson Value (DW) 1.89 is between dU
1.88 and 4-dU 2.12
No Autocorrelation Problem
2. Hypothesis Testing Analysis
Regression coefficients from the regression model can be seen in Table 4.8 below: Table 4
Regression Result Variables Unstandardized
Coefficients
Standardized Coefficients
T Sig*
β Std. Error 1 (Constant) CONACC LEVERAGE SIZE AUDITOR -.704 -.007 .103 .034 -.048 .166 .003 .048 .006 .022 -.107 .119 .313 -.132 -4.239 -1.985 2.152 5.408 -2.158 .000 .048 .032 .000 .032 Prob. F = 13.846
Testing of this hypothesis is done by multiple linear regression model of the following:
DA = -0.704 – 0.007CONACC + 0.103LEVERAGE + 0.034SIZE – 0.048AUDITOR + ε
Where,
DA = Discretionary Accruals CONACC = the level of conservatism LEVERAGE = the level of company leverage
SIZE = the firm size represent by natural logarithm of total assets of the company
AUDITOR = the dummy variable that identify audit firm which perform audit process for the company
ε = error
The Conservatism variable as the independent variable in this study have significance value of 0.048 which is smaller than 0.05. The value of its β is -0.007. From this value, it can be seen that there is a negative relationship between Discretionary Accruals variable and Conservatism variable. The higher the level of conservatism will result in lower discretionary accruals. The lower the discretionary accruals mean the higher the earnings quality. Hence, the hypothesis of this study (H1) is accepted.
From the table above, it can be seen the coefficient of determination (Adjusted R-Squared) regression model used in this study. The value of Adjusted R-Squared is 0.133. This value show that independent variable, CONACC, and control variables, LEVERAGE, SIZE and AUDITOR can explain 13.3% variation of dependent variable, DA. The remaining value 86.7% is explained by other variables or factors beyond the regression model used in this study.
3. Discussion
Earnings quality represents the quality of information reported by manager to the users of financial statements. Good earnings quality will assist the users to make good economic decision. One of determinants of earnings quality is management decision, as mention in Francis et al. (2006). Management decision can either result in good earnings quality or bad earnings quality. The one that lead to personal gain and result in bias information, widely known as earnings management, will decrease earnings quality.
The discretionary accruals used as proxy for earnings management capture management decision in choosing accrual policy. This type of accrual is called abnormal accrual. The amount of discretionary accrual component that changes in financial statements is entirely due to management decision. While non-discretionary accrual component changes is due to company condition that require certain adjustment. The lower the discretionary accruals number means the lower the manipulation level of earnings number.
From the result of statistical test, it can be seen that the hypothesis is accepted. Conservatism decrease earnings management practice, shown by negative relationship between discretionary accruals and conservatism. This finding supports previous studies, such as Watts (2003), Lafond and Watts (2008), Lara et al. (2012), and Haniati and Fitriany (2010) that found conservatism decrease earnings management. The decrease of earnings management practice means higher earnings quality. Hence, it is proved that conservatism principle increase earnings quality. V. Conclusion and Suggestion
1. Conclusion
Based on the analysis and discussion in the previous chapter, this study has the objective to test the impact of conservatism principle to earnings quality. The earnings quality in this study is measured by accounting-based measurement for earnings quality, namely abnormal accruals or discretionary accruals. This study uses financials statements of 86 listed manufacturing companies in Indonesia from period 2010-2014 (5 years) as data. The total sample for this study is 430 samples.
The regression model used in this study is called multiple linear regression model. In order to meet the criteria of good regression model for parametric statistical hypothesis testing, the model should pass four classical assumption tests, which consist of normality, autocorrelation, multicollinearity, and heteroscedasticity. Based on the result of four classical assumption tests, the regression model used in this study meet the criteria of good regression model for parametric statistical hypothesis testing.
The result of the analysis shows that the hypothesis of this study is accepted. It means conservatism increase earnings quality of listed companies in Indonesia. In the context of earnings management as measurement for earnings quality, conservatism implementation will increase earnings quality by decreasing earnings management practice. From this result, the users of financial statement can see that conservatism gives positive impact to the quality of information reported in financial statements, especially earnings information.
2. Limitations and Suggestions
The main objective of this study is to find answer along with empirical evidence whether conservatism gives impact to earnings quality of listed companies in Indonesia. Based on the result, it is proved that conservatism gives positive impact to earnings quality. However, this result is limited to one context of earnings quality, which is based on abnormal accruals. This measurement of earnings quality is one of accounting-based measurements of earnings quality. There are several other accounting-based measurements, such as accruals quality, persistence, predictability and smoothness. In addition, there are market-based measurements of earnings quality.
Some suggestion and idea that can be used by future researchers;
1. Subsequent studies may use other accounting-based measurement of earnings quality, such as accruals quality, persistence, predictability and smoothness. For more perspective, future researcher can combine two or more measurement to find the average result of accounting-based measurement.
2. For Conservatism variable, future research may use other measurement, such as Basu Asymmetric Timeliness and negative non-operating accruals.
References
Basu, S. (1997). The conservatism principle and the asymmetric timeliness of earnings.
Journal of Accounting and Economics 24, 3-37.
Beaver, W. H., & Ryan, S. G. (2000). Biases and Lags in Book Value and Their Effects on the Ability of the Book-to-Market Ratio to Predict Book Return on Equity. Journal of
Accounting Research 38, 127-148.
Becker, C. L., Defond, M. L., Jiambalvo, J., & Subramanyam, K. R. (1998). The Effect of Audit Quality on Earnings Management. Contemporary Accounting Research 15, 1-24.
Bedard, J., & Biggs, S. F. (1991). Pattern recognition, hypotheses generation, and auditor performance in analytical task. The Accounting Review 66, 622-642.
Bellovary, J. L., Giacomino, D. E., & Akers, M. D. (2005). Earnings Quality: It's Time to Measure and Report. The CPA Journal 75, 32.
Bonner, S., & Lewis, B. (1990). Determinants of auditor expertise. Journal of Accounting
Research 28, 1-2.
Chen, L. H., Folsom, D. M., Paek, W., & Sami, H. (2014). Accounting conservatism, earnings persistence, and pricing multiples on earnings. Accounting Horizons 28, 233-260.
DeAngelo, H., DeAngelo, L., & Skinner, D. J. (1994). Accounting Choice in Troubled Companies. Journal of Accounting and Economics 17, 113-143.
Dechow, P. M., & Schrand, C. M. (2004). Earnings Quality. Research Foundation of CFA
Institute Publications, 1-152.
Dechow, P. M., Ge, W., & Schrand, C. M. (2010). Understanding Earnings Quality: A Review of the Proxies, Their Determinants and Their Consequences. Journal of
Accounting and Economics Volume 50, 344-401.
Dechow, P. M., Sloan, R. G., & Sweeney, A. P. (1995). Detecting Earnings Management.
The Accounting Review 70, 193-225.
Dechow, P., & Dichev, I. (2002). The quality of accruals and earnings: The role of accrual estimation errors. The Accounting Review 77, 35-59.
Francis, J., LaFond, R., Olsson, P., & Schipper, K. (2004). Cost of Equity and Earnings Attributes. The Accounting Review 79, 967-1010.
Francis, J., Olsson, P., & Schipper, K. (2006). Earnings Quality. Foundations and Trends in
Accounting 1, 259-340.
Givoly, D., & Hayn, C. (2000). The changing time-series properties of earnings, cash flows, and accruals: Has financial reporting become more conservative? . Journal of
Accounting and Economics 29, 287-320.
Guay, W., Kothari, S. P., & Watts, R. (1996). A market-based evaluation of discretionary accrual models. Journal of Accounting Research 34, 83-105.
Haniati, S., & Fitriany. (2010). Pengaruh konservatisme terhadap asimetri informasi dengan menggunakan beberapa model pengukuran konservatisme. Simposium Nasional
Akuntansi XIII Purwokerto, 1-28.
Jensen, M. C., & Meckling, W. H. (1976). Theory of the firm: Managerial behavior, agency costs and ownership structure. Journal of Financial Economics 3, 305-360.
Khan, M., & Watts, R. L. (2009). Estimation and empirical properties of a firm-year measure of accounting conservatism . Journal of Accounting and Economics 48, 132-150.
Khrisnan, G. (2003). Does Big 6 auditor industry expertise constrain earnings management?
Accounting Horizons 17, 1-16.
Kim, Y., Liu, C., & Rhee, S. G. (2003). The Effect of Firm Size on Earnings Management.
College of Business Administration University of Hawai'i.
Kimmel, P. D., Weygandt, J. J., & Kieso, D. E. (1998). Financial Accounting: Tools for
Business Decision Making. New York: John Wiley & Sons.
LaFond, R., & Watts, R. (2008). The information role of conservatism. The Accounting
Review 83, 447-478.
LaFond, R., & Watts, R. L. (2006). The information role of conservatism. 1-57.
Lara, J. M., Osma, B. G., & Penalva, F. (2012). Accounting conservatism and the limits to earnings management. 1-55.
Li, Y. (2011). Accounting Conservatism and the Consequences of Covenant Violations.
Thesis for Doctor of Philosophy, University of Waterloo.
Llukani, T. (2013). Earnings Management and Firm Size: An Empirical Analyze in Albanian Market. European Scientific Journal , 135-143.
Marshall, D. H., McManus, W. W., & Viele, D. F. (2002). Accounting: What the Numbers
Mean. New York: McGraw-Hill.
Mayangsari, S., & Wilopo. (2002). Konservatisme Akuntansi, Value Relevance, dan Discretionary Accruals: Implikasi Empiris Model Feltham-Ohlson (1996). Jurnal
Riset Akuntansi Indonesia, 291-310.
Nelson, M. W., Elliott, J. A., & Tarpley, R. L. (2002). Evidence from Auditors about Managers and Auditors Earnings Management Decision . The Accounting Review 77, 175-202.
Pae, J., Thornton, D., & Welker, M. (2005). The link between earnings conservatism and the price-to-book ratio. Contemporary Accounting Research 22, 693-717.
Palmrose, Z., Richardson, V. J., & Scholz, S. (2004). Determinants of market reactions to restatement announcements. Journal of Accounting and Economics 37, 59-89.
Permatasari, I. (2005). Manajemen Laba dan Status Keterlambatan Perusahaan dalam Menyampaikan Laporan Keuangan Tahunan. Jurnal Akuntansi dan Keuangan
Indonesia , 49-72.
Purbayu, A. (2005). Analisis Statistik dengan Microsoft Excel & SPSS. Yogyakarta: Penerbit Andi.
Sari, N. H., & Ahmar, N. (2014). Revenue Discretionary Model Pengukuran Manajemen Laba: Berdasarkan Sektor Industri Manufaktur di Bursa Efek Indonesia. Jurnal
Akuntansi dan Keuangan, 43-51.
Scott, W. R. (2011). Financial Accounting Theory. New York: Prentice Hall.
Srinidhi, B., Gul, F. A., & Tsui, J. (2011). Female Directors and Earnings Quality.
Contemporary Accounting Research Volume 28, 1610-1644.
Suranggane, Z. (2007). Analisis Aktiva Pajak Tangguhan dan Akrual Sebagai Prediktor Manajemen Laba: Kajian Empiris Pada Perusahaan Manufaktur yang Terdaftar di BEJ . Jurnal Akuntansi dan Keuangan Indonesia 4, 77-94.
Trisnawati, R., Wiyadi, & Sasongko, N. (2012). Pengukuran Manajemen Laba: Pendekatan Terintegrasi (Studi komparasi perusahaan manufaktur yang tergabung pada indeks JII dan LQ 45 Bursa Efek Indonesia periode 2004-2010). Universitas Muhammadiyah
Surakarta.
Vincent, L., & Schipper, K. (2003). Earnings Quality . Accounting Horizons 17, 97.
Watts, R. L. (2003). Conservatism in Accounting Part I: Explanations and Implications.
Accounting Horizons 17, 207-221.
Watts, R. L. (2003). Conservatism in Accounting Part II: Evidence and Research Opportunities. Accounting Horizons 17, 287-301.
Watts, R. L., & Zimmerman, J. L. (1986). Positive Accounting Theory. Prentice-Hall.
Widya. (2004). Analisis Faktor-Faktor yang Mempengaruhi Pilihan Perusahaan Terhadap Akuntansi Konservatif. Prosiding Simposium Nasional Akuntansi VII Bali , 709-724.
Wolk, H., Tearney, M., & Dodd, J. (2001). Accounting Theory. Cincinnati, OH: South-Western College Publishing.