Abstract - The aim of this study is to develop a methodology to select the most significant features contributing in Coronary Artery Disease (CAD) diagnosis. To achieve the above mentioned objective, first, the features are ranked based on the significance level by using Pearson’s Chi-square test and analysis of variance (ANOVA) for categorical and continuous features respectively. Then, a heuristic procedure is proposed to choose an appropriate set of features which minimizes errors in four well-known classification methods, namely, Probabilistic Neural Network (PNN), Support Vector Machine (SVM), Linear Discriminant Analysis (LDA), and Naïve Bayes (NB). It is concluded that the most significant features where the minimum error rate is achieved are the features for which the p-value of the related test statistics is near zero and the null hypothesis, stated as if all the different classes of response have the same mean as predictors, is rejected at a very high significance level.
Keywords – Classification, Coronary Artery Disease, Data Mining, Dimension Reduction
I. INTRODUCTION
Coronary heart disease (CHD) is a common term for the buildup of plaque in the heart’s arteries that could lead to heart attack [1]. CHD is actually a result of coronary artery disease (CAD).It is the largest killer disease of American males and females, which caused about one of every six deaths in the United States in 2006. The estimated direct and indirect cost of CAD in the US in 2010 is $177.1 billion [1]. The Coronary Arteries are blood vessels that supply blood to heart. They branch off of the aorta at its base. The right coronary artery, the left main coronary, the left anterior descending, and the left circumflex artery, are the four major coronary arteries [1]. Blockage of these arteries is a common cause of angina, heart disease, heart attacks, and heart failure.
The premium method for diagnosis of CAD is Coronary angiogram. It is an accurate, expensive, and invasive approach that’s not possible as a diagnosis for many patients. Exercise stress test (EST) is most typically used method on diagnosis of angina. It is a noninvasive, economical, easy operable, safe, and reproducible method. Therefore, EST is one of the main noninvasive diagnostic tools in the diagnosis of CAD. Nevertheless, the relatively low sensitivity and specificity of EST for
diagnosing CAD has led to limit its clinical usage [2,3].
Since the medical diagnosis by nature is an intricate process, soft computing methods such as neural networks have shown great potential to be applied in the development of medical decision support systems of heart diseases. Several computer aided diagnosis methods have been recommended in the literature for the diagnosis of CAD, more specifically, the use of approaches as artificial neural networks [4,5], support vector machine [6], multiplayer perceptron-based decision support system [7], PSO based fuzzy expert system [8].
Babaoglu et al. [9] have applied binary particle swarm optimization (BPSO) and genetic algorithm (GA) techniques as feature selection models on determination of CAD existence based upon EST data. Afterward they used support vector machine (SVM) with k-fold cross-validation as the classifier system of CAD existence in both BPSO and GA feature selection techniques.
Another research in this field is the application of particle swarm optimization (PSO)-based fuzzy expert system for the diagnosis of CAD [8]. They have used a four step approach for disease classification. In the first stage, the missing data are imputed using nearest neighbor hot deck imputation, while in the second stage, decision tree induction and set of rules is extracted from it. In the third stage, the crisp rules are transformed into fuzzy rule base using fuzzy membership functions. Finally, in the fourth stage, the fuzzy membership functions are tuned by PSO. They have designed a system based on the Cleveland and Hungarian Heart Disease datasets. The major advantage of their approach is the ability to interpret the decisions made from the created fuzzy expert system, when compared with other approaches.
Another research on Cleveland datasets has been done by Polat and Güneş [10] who have combined feature selection, fuzzy weighted pre-processing, and artificial immune recognition system (AIRS) to design a medical decision support system. Their proposed approach consists of three stages. In the first step, the dimensions of heart disease datasets are reduced to 9 from 13 in the feature selection (FS) sub-program by means of C4.5 decision tree algorithm (CBA program), respectively. In the second step, heart disease
Dimension Reduction of Coronary Artery Disease Diagnosis by Artificial
Intelligence Techniques and Analysis of Variance
A. Azadeh
1, M. Abdollahi
1, M. Hosseinabadi Farahani
1, H. RezaeiSoufi
11Department of Industrial Engineering and Center of Excellence for Intelligent Based Experimental Mechanics, College of
datasets are normalized in the range of [0,1] and are weighted via fuzzy weighted pre-processing. In the final step, weighted input values found from fuzzy weighted pre-processing are classified using AIRS classifier system.
Anbarasi et al. [11] have used Genetic algorithm to determine the attributes which are the most significant to the diagnosis of heart ailments and indirectly reduces the number of tests that are needed to be taken by a patient. Based on their work 13 attributes are reduced to 6 attributes using genetic search. Yan et al. [7] have applied a multiplayer perceptron-based medical decision support system to diagnose five types of heart diseases. They have designed a multiplayer perceptron network with one input layer, one hidden layer, and one output layer. The input layer of the system includes 40 input variables categorized into four groups and then encoded using the proposed coding schemes. They have determined the number of the neurons of hidden layer by means of cascade learning process. They have trained the whole network with back propagation (BP) algorithm.
The rest of the paper is organized as follows. the methodology of this paper is described in section II. In Section III-IV-V, the tools applied in this article namely missing value imputation, feature ranking, and classification tools is described respectively. Section VI presents results and the last section presents conclusion.
II. METHODOLOGY
The heart disease database has been taken from University of California Irvine (UCI) machine learning source. The database contains 303 records of which 297 are complete samples and six are samples with missing attributes. Originally, the database has 76 raw attributes. However, all the published experiments only refer to 14 of them, which 13 attribute as input and one of them as target attribute. In this research, we have only concentrated on presence form absence. It means we have assumed healthy (value 0) and sick (1,2,3,4) as value 1 or presence of CAD.
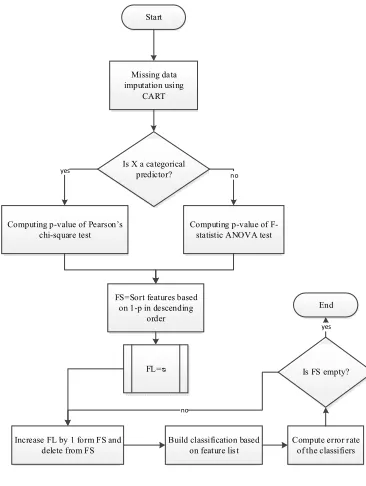
In the first step, the missing data have been imputed using Classification and Regression Tree (CART) algorithm. In second step, the features have been ranked based on ANOVA and Pearson’s chi square test p-value then Feature-Set (FS) has been created based on the ranked features, and Feature-Lists (FLs) have been constructed based on FS gradually. For each of 13 FLs, classification methods namely SVM, PNN, LDA, and NB have been applied, and the error rate for test dataset has been computed. Finally the FL where minimum error rate has been achieved in all classifiers has been chosen as the best subset of features. The proposed approach has been illustrated in Fig.1.
Start
Missing data imputation using
CART
Is X a categorical predictor? yes
Computing p-value of F-statistic ANOVA test
no
Computing p-value of Pearson’s chi-square test
FS=Sort features based on 1-p in descending
order
Increase FL by 1 form FS and delete from FS
FL=ᴓ
Build classification based
on feature list Compute error rate of the classifiers Is FS empty?
no
End yes
Fig.1. Framework of proposed approach
III. MISSING VALUE IMPUTATION
For Missing value imputation, CART model has been built for each field to be imputed using all other input fields as predictors. For each record that has been imputed, the model for the field to be imputed has been applied to the record to produce a prediction, which is used as the imputed value.
IV. FEATURE RANKING
Feature selection is an important scientific requirement for a classifier when p is large [12]. Feature selection allows the variable set to be reduced in size, creating a more manageable set of attributes for modeling. The accuracy of classifiers may be improved if the classifier uses only significant features. Hence feature selection is one of the most steps in classification and pattern recognition. In this paper for selecting the most significant features for categorical predictors the importance value of each variable is calculated as 1-p, where p is the p-value of the Pearson’s chi-square test of association between the candidate predictor and the response variable. The p-value
based on Pearson’s chi-square χ02 is calculated by:
2 2
Pr( 0)
p value d (1)
where,
2 0
1 1
2 ˆ
( )
ˆ
I J
i j
Nij Nij N ij
(2). .
number of cases, and I is the number of categories in considered predictor X and, J is the number of categories in target variable Y. Under the null hypothesis, Pearson’s chi-square converges asymptotically to a chi-square distribution χd2 with
d=(I-1)(J-1) degrees of freedom. For continuous predictors p-value based on the F statistic are used and like categorical predictors 1-p is used as
based on the F statistic is calculated by:
1 criteria of the features.
V. CLASSIFICATION
In this section, we have provided a brief explanation of four classifiers applied in this paper as follows:
A. Support Vector Machine
Support Vector Machine (SVM) belongs to the category of maximum margin classifiers. It has emerged as very successful pattern recognition methods in recent years. The goal of maximum margin classification in binary SVM classification is to separate the two classes by a hyper plane such that the distance to the support vectors is maximized. SVM performs pattern recognition between two classes by finding a hyper plane that has maximum distance to the closest points in the training set which are termed support vectors. This hyper plane is called the optimal separating hyper plane (OSH).
The procedure starts with N training pairs(x1,y1),(x2,y2),…,(xn,yn), where i=1,2,3,…,N
and each point belongs to one of two classes identified by the
Label yiϵ{-1,1}. First a hyper plane has been
defined by{ : ( ) 0 0}
T
x f x x where β is a unit vector.
A classification rule induced by f(x) is:
0
( ) [ T ]
G x sign x (6)
The training data might be separable or non-separable. For separable data, the OSH has been founded by solving the below optimization problem:
By changing above optimization problem, a more convenient problem has been resulted as follows:
max 1 2 writing the support vector criterion for separated data. The above mentioned model is a convex optimization problem (quadratic objective function, linear inequality constraints), and the solution is characterized by use of Lagrange multipliers as the quadratic programming problem. Suppose that the classes overlap in feature space. One way to deal with the overlap is to still maximize M, but allow for some points to be on the wrong side of the margin. The slack variables has been defined as
TABLE I
P-VALUE FOR FEATURES
ξ=( ξ1,ξ2,…,ξN). So we have
0
( T ) (1 )
i i i
y x M hyper plane for non-separable data which ξi is the proportional amount by which the prediction ( ) 0
B. Probabilistic Neural Network
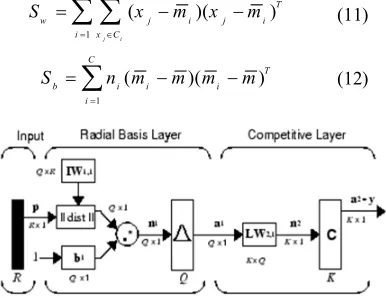
The Probabilistic Neural Network (PNN) introduced by Specht [14] is basically based on the well-known Bayesian classifier technique usually used in many classical pattern-recognition problems. This model learns to approximate the probability density function of the training samples through training processes [15]. In PNN when an input is presented, the first layer computes distances from the input vector to the training input vectors and produces a vector whose elements indicate how close the input is to a training input. The second layer sums these contributions for each class of inputs to produce as its net output a vector of probabilities. Finally, competing transfer function on the output of the second layer picks the maximum of these probabilities and produces a 1 for that class and a 0 for the other classes [16]. The architecture for this system is shown in Fig.2. In the PNN classifier, all biases in the radial basis layer has been set to Ln0.8 /S , where S=spread
is a constant of PNN. If S is near zero, the network will act as a nearest neighbor classifier, and the network will take into account several nearby design vectors if its value becomes larger.
C. Linear Discriminant Analysis
Linear discriminant analysis (LDA) searches for those vectors in the feature space which best discriminate among classes rather than those best describe the data [17]. LDA maximizes between
Fig. 2. Probabilistic Neural Network structure.
Where
m
i is the ith class mean and,mis the global mean, ni is the number of samples in the ith class. Fisher’s linear discriminant is given by the vectorW which maximizes [18]: largest Eigen values of the matrix, 1
w b
S S
D. Naïve Bayes
A Bayesian network provides a succinct way of describing the joint probability distribution for a given set of random variables. Let V be a set of categorical random variables and G = (V, E) be a directed acyclic graph with nodes V and a set of directed edges E. A Bayesian network model consists of the graph G together with a conditional probability table for each node given values of its parent nodes. Given the value of its parents, each node is assumed to be independent of all the nodes that are not its descendants. The joint probability distribution for variables V can then be computed as a product of conditional probabilities for all nodes, given the values of each node’s parents. This algorithm is based on a main assumption, i.e. the Naïve Bayes assumption: The features should be independent with respect to the targets. This algorithm uses the Bayes equation, which calculates the posterior probability of a record Y
having the target Cj.
VI. RESULTS AND DISCUSSION
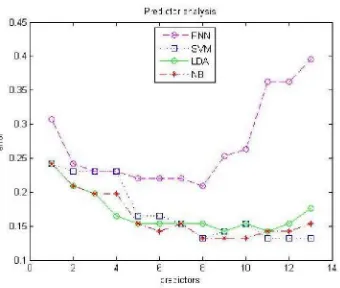
In our study, all procedure implemented in Matlab software (v2012a) published by the MathWorks Inc. The dataset has been divided into training and test set randomly (for the purpose of generalization).70% of the dataset has been used to train the classifiers and the rest of them has been used to test the performance of classifiers for unseen data. Based on the proposed methodology and training dataset the classification models has been built and for test dataset number of attributes versus error rate has been plotted and presented in Fig.3. The confusion matrix of ANOVA-SVM has been presented in Fig.4.
Fig.3. Prediction error rate for test dataset.
Fig.3. Confusion matrix for ANOVA-SVM.
VII. CONCLUSION
In this study, a multi-step algorithm for dimension reduction of CAD diagnosis has been presented. Based on table I, we have sorted predictors in descending order of their importance. Hence we have [cathalold peak thalach cp exang slope sex age restecg trestbps fbs chol] which is named Feature Space (FS). Then we have used form 1st predictor to build the models, and we increase the predictor list by one in each step. The Fig.3 shows the mentioned procedure, and we can see that the best number of predictors in predicting CAD is 8. It means that the best Feature List (FL) which the classifiers achieve the minimum error is [ca thal oldpeak thalach cp exang slope sex], which matches with those predictors that the p-value of Pearson’s chi-square and F-statistic is very low and they null hypothesis that was tests if all the different classes of Y have the same mean as X in any significance level will be rejected.
References
[1] American Heart Assiciation (AHA); Available from:http://www.heart.org/HEARTORG/Conditions/Mor
e/MyHeartandStrokeNews/Coronary-Artery-Disease---The-ABCs-of-CAD_UCM_436416_Article.jsp.
[2] San Roman, J., et al., Selection of the optimal stress test
for the diagnosis of coronary artery disease. Heart, 1998.
80(4): p. 370-376.
[3] Thom, T., et al., Heart disease and stroke statistics—
2006 update. Circulation, 2006. 113(6): p. e85-e151.
[4] Patil, S.B. and Y. Kumaraswamy, Intelligent and
effective heart attack prediction system using data mining and artificial neural network. European Journal
of Scientific Research, 2009. 31(4): p. 642-656.
[5] Das, R., I. Turkoglu, and A. Sengur, Effective diagnosis
of heart disease through neural networks ensembles.
Expert systems with applications, 2009. 36(4): p.
7675-7680.
[6] Babaoğlu, İ., et al., A Comparison of Artificial
Intelligence Methods on Determining Coronary Artery Disease. Advances in Information Technology, 2010: p. 18-26.
[7] Yan, H., et al., A multilayer perceptron-based medical
decision support system for heart disease diagnosis.
Expert Systems with Applications, 2006. 30(2): p.
272-281.
[8] Muthukaruppan, S. and M.J. Er, A hybrid particle swarm
optimization based fuzzy expert system for the diagnosis of coronary artery disease. Expert Systems with Applications, 2012.
[9] Babaoglu, İ., O. Findik, and E. Ülker, A comparison of
feature selection models utilizing binary particle swarm optimization and genetic algorithm in determining coronary artery disease using support vector machine.
Expert Systems with Applications, 2010. 37(4): p.
3177-3183.
[10] Polat, K. and S. Güneş, A hybrid approach to medical
decision support systems: Combining feature selection, fuzzy weighted pre-processing and AIRS. Computer
methods and programs in biomedicine, 2007. 88(2): p.
164-174.
[11] Anbarasi, M., E. Anupriya, and N. Iyengar, Enhanced
prediction of heart disease with feature subset selection using genetic algorithm. International Journal of
Engineering Science and Technology, 2010. 2(10): p.
5370-5376.
[12] Friedman, J., T. Hastie, and R. Tibshirani, The elements
of statistical learning. Vol. 1. 2001: Springer Series in Statistics.
[13] Cortes, C. and V. Vapnik, Support-vector networks.
Machine learning, 1995. 20(3): p. 273-297.
[14] Specht, D.F., Probabilistic neural networks. Neural
networks, 1990. 3(1): p. 109-118.
[15] Giri, D., et al., Automated Diagnosis of Coronary Artery
Disease Affected Patients Using LDA, PCA, ICA and Discrete Wavelet Transform. Knowledge-Based Systems, 2012.
[16] Kannathal, N., et al., Classification of Cardiac Patient
States Using Artificial Neural Networks. Advances in Cardiac Signal Processing, 2007: p. 187.
[17] Lee, J., et al. Arrhythmia classification with reduced
features by linear discriminant analysis. in Engineering in Medicine and Biology Society, 2005. IEEE-EMBS 2005. 27th Annual International Conference of the. 2006. IEEE.
[18] Mika, S., et al. Fisher discriminant analysis with kernels.