Trade Performance of Meat and Meat Preparation Sector in
Malaysia: The Case of Non-Ruminant
Mohd Mansor Ismail1* & Mohammad Amizi, A.2
1Institute of Agricultural and Food Policies Studies (IKDPM)
Universiti Putra Malaysia 43400 Serdang, Selangor.
2 Integrated Agrotechnology and Resource Management Center
University Technology MARA Perlis, 02600 Arau Perlis *e-mail: [email protected]
Abstract
Over the years Malaysia has undergone a substantial and persistent food trade deficit. It is continue to grow at an alarming rate as the figures climbed to a staggering RM 10.1 billion in 2008. Registered at 3.4 billion in 2005, it swelled to RM 4.9 billion in 2000. If this detrimental trend continues unimpeded, the food trade deficit is expected to reach RM12.4 billion by 2010 with food imports at RM27.3 billion, far outweighing exports worth RM14.9 billion. This phenomenon has to be arrested, which requires Malaysia to boost its food exports and it is a need of the policy makers, practitioners, producers and the government agencies to undertake appropriate action related this issues. This study is to evaluate the related factors and to evaluate the competiveness of 10 food commodities in the meat and meat preparation sector. The data cover non ruminant commodities in the HS 6 digits group which are expected to have high potential in the future. The studies will be based on the concept of revealed comparative advantage (RCA). The basic logic behind RCA is that it evaluates comparative advantage on the basis of a country’s specialization in (net) exports relative to some reference group. A different interpretation of comparative advantage is furnished by Vollrath indices, which are adopted in this study. Vollrath offers three alternative specifications of revealed comparative advantage, they are; relative export advantage (RXA), relative import advantage (RMA) and relative trade advantage (RTA). From this studies contributed and demonstrated the potential performance of sub selected sector in the non ruminants.
Introducton
Malaysa has undergone a substantal and persstent food trade defct. It contnues to grow at an alarmng rate as the fgures clmbed to a staggerng RM 10.6 bllon n 2009. In lne wth the global food crss n 2008, t has heghtened government awareness and brought ths ssue to the forefront of publc nterest. Ths phenomenon has to be addressed, whch requres Malaysa to boost ts food exports and to substtute mports. There s a need to determne the local commodtes that are capable of substtutng mported products and at the same tme, searchng for varetes of potental products for export. Ths s partcularly mportant for the food processng ndustry, as the scheduled lberalzaton of trade under the World Trade Organzaton (WTO) and the ASEAN Free Trade Area (AFTA) would produce greater challenges and stff competton to Malaysan food producers. Thus, to penetrate a wder range of foregn markets, along wth the effort to curtal the food trade defct, t s crucal for Malaysan food processors to dentfy food sub-sectors that are nternatonally compettve and vable.
The meat and meat preparaton sector n Malaysa has been chosen as to date, t s manly an mported tem. It s the am of ths study to evaluate the compettveness of 10 food commodtes n the meat and meat preparaton sector (dvson 01) cover-ng the perod of 1997 to 2008. The data cover only the non rumnant commodtes n the HS 6 dgts group whch are expected to have hgh potental n the future.
Our nvestgaton s based on the concept of revealed comparatve advantage (RCA). Vollrath offers three alternatve specfcatons of revealed comparatve advantage. The major dfference between the Balassa ndex and the Vollrath ndces s that the latter elmnate country and product double-countng. Tme seres data were obtaned from Global Trade Atlas (GTA) and Internatonal Fnancal Statstcs (IFS).
The remander of ths paper s structured as follows: Secton II reports a revew of some of the related lterature. Secton III dscusses the methodology. Secton IV reveals the fndngs and the conclusons are summarzed n Secton V.
Recent Studes on Compettveness and Comparatve Advantage
For many decades, the concept of compettveness has been wdely used n economc research and economc polcy from varous ponts of vew. A large and growng body of lterature attempts to assess the ssue theoretcally and empr-cally. The defnton of compettveness tself may also vary wth respect to the level consdered (Havrla & Gunawardana, 2006). The dversty of the concepts and measures largely pertans to the varety of polcy analyss needs, perspectves and objectves of the research.
nvest-gate the level, composton, and dfferences n agro-food relatve trade advantages/ dsadvantages for eght Central European and Balkan countres on the European Unon (EU) markets and ther mplcatons for food polcy. Hgher and more stable relatve trade advantages were found for bulk prmary raw agrcultural commodtes and less so for consumer-ready foods, mplyng compettveness shortcomngs n food processng and n nternatonal food marketng. Duraton analyss showed that the EU enlargement has had a negatve mpact on agro-food relatve trade advan-tages for all eght analyzed countres. Estmatons mply that the duraton of agro-food relatve trade advantages were the hghest for Hungary and Poland, and also for Bulgara n dfferentated products, ndcatng ther agro-food trade potental n the EU-15 markets.
Bojnec and Ferto (2006) examned the comparatve advantage and compet-tveness of Hungaran and Slovenan agro-food trade n the EU markets. Applyng a hghly dsaggregated trade dataset, they descrbed the pattern of agro- food trade n Hungary and Slovena usng the Balassa ndex. Ther fndngs ndcated that both countres have lost ther comparatve advantage for a number of product groups over tme. The ndces of specalzaton have tended to converge. For partcular product groups, the ndces dsplayed greater varaton. They are stable for product groups wth a comparatve dsadvantage, but product groups wth a weak to strong com-paratve advantage show sgnfcant varaton.
Wth the am to move the attenton away from advanced ndustralzed econo-mes, Uchda and Cook (2005) examned the trends for trade and technologcal spe-calzaton among the East Asan developng economes. The analyss s confned to seven East Asan economes: Hong Kong, South Korea, Sngapore, Indonesa, Ma-laysa, the Phlppnes, and Thaland. Important dfferences are found n the patterns of specalzaton, and n the relatonshp between them among the advanced East Asan economes and those catchng up. The country level analyss ndcated that a dfference n the patterns of compettve advantage among the East Asan economes was greater for technology than for trade. Cumulatve or path-dependent technolog-cal change was found to be mportant n Hong Kong, South Korea, and Sngapore.
Methodology
A dfferent nterpretaton of comparatve advantage s furnshed by the Vollrath ndces, whch offer three alternatve specfcatons of revealed comparatve advan-tage. They are relatve export advantage (RXA), relatve mport advantage (RMA), and relatve trade advantage (RTA), expressed as,
$7.- 24+/#4; 4#9 #)4+%7.674#. %1//1&+6+'5 #0& .'55 51 (14 %1057/'44'#&; (11&5 +/2.;+0) %1/2'6+6+8'0'555*146%1/+0)5+0(11&241%'55+0)#0&+0+06'40#6+10#.(11&/#4-'6+0)74#6+10 #0#.;5+55*19'& 6*#66*''0.#4)'/'06*#5 *#& #0')#6+8'+/2#%610#)41(11&4'.#6+8'64#&' #&8#06#)'5 (14 #.. '+)*6 #0#.;<'& %17064+'5 56+/#6+105 +/2.; 6*#6 6*' &74#6+10 1( #)41(11& 4'.#6+8' 64#&' #&8#06#)'5 9'4' 6*' *+)*'56 (14 70)#4; #0& 1.#0& #0& #.51 (14 7.)#4+# +0 &+(('4'06+#6'&241&7%65+0&+%#6+0)6*'+4#)41(11&64#&'216'06+#.+06*' /#4-'65
1,0'%#0&'461':#/+0'&6*'%1/2#4#6+8' #&8#06#)'#0&%1/2'6+6+8'0'551(70)#4+#0 #0&.18'0+#0#)41(11&64#&'+06*'/#4-'6522.;+0)#*+)*.;&+5#))4')#6'&64#&'#5'6 6*';&'5%4+$'& 6*'2#66'401(#)41 (11&64#&'+070)#4;#0&.18'0+#75+0)6*'#.#55#+0&': *'+4(+0&+0)5+0&+%#6'& 6*#6$16*%17064+'5*#8'.156 6*'+4 %1/2#4#6+8'#&8#06#)'(14#07/$'4 1( 241&7%6 )41725 18'4 6+/' *' +0&+%'5 1( 52'%+#.+<#6+10 *#8' 6'0&'& 61 %108'4)' 14 2#46+%7.#4 241&7%6 )41725 6*' +0&+%'5 &+52.#;'& )4'#6'4 8#4+#6+10 *'; #4' 56#$.' (14 241&7%6 )417259+6* # %1/2#4#6+8'&+5#&8#06#)'$76241&7%6)417259+6* # 9'#-6156410)%1/2#4#6+8' #&8#06#)'5*195+)0+(+%#068#4+#6+10
!+6*6*'#+/61/18'6*'#66'06+10#9#;(41/#&8#0%'&+0&7564+#.+<'&'%101/+'5%*+&##0& 11- ':#/+0'& 6*' 64'0&5 (14 64#&' #0& 6'%*01.1)+%#. 52'%+#.+<#6+10 #/10) 6*' #56 5+#0 &'8'.12+0) '%101/+'5 *' #0#.;5+5 +5 %10(+0'& 61 5'8'0 #56 5+#0 '%101/+'5 10) 10) 176* 14'# +0)#214' 0&10'5+# #.#;5+# 6*' *+.+22+0'5 #0& *#+.#0& /2146#06 &+(('4'0%'5 #4' (170& +0 6*' 2#66'405 1( 52'%+#.+<#6+10 #0& +0 6*' 4'.#6+105*+2 $'69''0 6*'/ #/10) 6*' #&8#0%'& #56 5+#0 '%101/+'5 #0& 6*15' %#6%*+0) 72 *' %17064; .'8'. #0#.;5+5 +0&+%#6'& 6*#6 # &+(('4'0%' +0 6*' 2#66'405 1( %1/2'6+6+8' #&8#06#)' #/10) 6*' #56 5+#0 '%101/+'5 9#5 )4'#6'4 (14 6'%*01.1); 6*#0 (14 64#&' 7/7.#6+8' 14 2#6*&'2'0&'06 6'%*01.1)+%#.%*#0)'9#5(170&61$'+/2146#06+010)10)176* 14'##0&+0)#214' 5611.+66.'#66'06+10*#5$''02#+&61':#/+0'6*'&'8'.12+0)%17064+'5>%1/2#4#6+8'#&8#06#)' +0 5'48+%'5 ';17/ #66'/26'& 61 (+.. 6*+5 )#2 $; #0#.;<+0) 6*' %1/2'6+6+8'0'55 1( 5'.'%6'& 5'48+%'5 $75+0'55 (+0#0%+#. 64#052146 #0& 64#8'. 5'48+%'5 +0 &'8'.12+0) %17064+'5 +0 4'.#6+10616*#61(6*'4'561(6*'914.&$#5'&106*4''+0&+%'51(4'8'#.'&%1/2#4#6+8'#&8#06#)' 6410) %1/2#4#6+8' #&8#06#)'5 ':+56 (14 /#0; &'8'.12+0) %17064+'5 +0 64#052146 #0& 64#8'. 5'48+%'5 *'4' +5 57$56#06+#. 411/ (14 +/2418'/'06 +0 (+0#0%+#. #0& $75+0'55 5'48+%'5 4#&' .+$'4#.+<#6+10#0&.#%-1( #&'37#6'24'2#4#6+10#22'#4561*#8'4'57.6'&+0#9'#-'0+0)1(6*'+4 1( 6*' 241&7%65 #0&4 4'24'5'06+0) 6*'4'561(6*'914.&%%14&+0)61 1..4#6*215+6+8'8#.7'51( 6*' +0&': +0&+%#6' # %1/2#4#6+8'#&8#06#)'9*'4'#50')#6+8'8#.7'5+0&+%#6'16*'49+5' 1..4#6* 21+06'&1766*#6 6*' #224#+5+0)1(%1/2#4#6+8'#&8#06#)'#6#))4')#6'#0&&+5 #))4')#6'&.'8'.5%#0=+&'06+(;6*'18'4#.. &+4'%6+10#0&&4+8'+09*+%* #%17064;>5+08'56/'06 #0& 64#&' 5*17.& 6#-' +0 14&'4 61 ':2.1+6 +06'40#6+10#. &+(('4'0%'5 +0 241&7%6 #0& (#%614 5722.;
Where X are the exports and M are the mports of sector (or product) of country j, n s the rest of the products and r representng the rest of the world. Accordng to Voll-rath, postve values of the RTA ndex ndcate a comparatve advantage, whereas negatve values ndcate otherwse.
Vollrath (1991) ponted out that the apprasng of comparatve advantage at aggregate and ds-aggregated levels can ‘dentfy the overall drecton and drve n whch a country’s nvestment and trade should take n order to explot nternatonal dfferences n product and factor supply and demand’ as well as ‘to evaluate socally desrable specalsaton patterns along narrow product lnes’. He further argued that the estmaton of comparatve advantage may be partcularly benefcal when con-sderng trade between countres wth dfferent factor endowments.
Results and Dscusson
Concluson
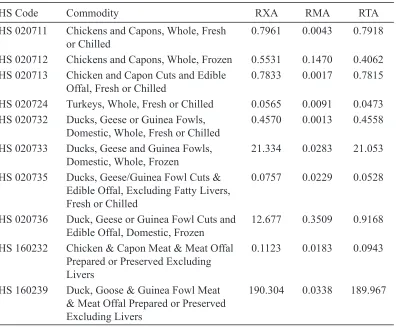
The analyss provded here revealed that Malaysa s generally very compettve n the non rumnant sector. A good compettve performance was observed n HS 160239 (Duck, Goose & Gunea Fowl Meat & Meat Offal Prepared or Preserved Excludng Lvers) whch s confrmed by both ts relatve export advantage (RXA) and relatve trade advantage (RTA) ndces, whereas the RTA ndex shows strong compettveness. Malaysa demonstrates a good performance n ths selected sub sector. A great deal of attenton should be gven, through aggressve research and development of new products and producton technques, to mantan and mprove the compettveness of the Malaysan food sector.
Table 1. Average relatve export, relatve mport and relatve trade advantage for selected meat and meat preparaton sectors n Malays
HS Code Commodty RXA RMA RTA
HS 020711 Chckens and Capons, Whole, Fresh or Chlled
0.7961 0.0043 0.7918
HS 020712 Chckens and Capons, Whole, Frozen 0.5531 0.1470 0.4062 HS 020713 Chcken and Capon Cuts and Edble
Offal, Fresh or Chlled
0.7833 0.0017 0.7815
HS 020724 Turkeys, Whole, Fresh or Chlled 0.0565 0.0091 0.0473 HS 020732 Ducks, Geese or Gunea Fowls,
Domestc, Whole, Fresh or Chlled
0.4570 0.0013 0.4558
HS 020733 Ducks, Geese and Gunea Fowls, Domestc, Whole, Frozen
21.334 0.0283 21.053
HS 020735 Ducks, Geese/Gunea Fowl Cuts & Edble Offal, Excludng Fatty Lvers, Fresh or Chlled
0.0757 0.0229 0.0528
HS 020736 Duck, Geese or Gunea Fowl Cuts and Edble Offal, Domestc, Frozen
12.677 0.3509 0.9168
HS 160232 Chcken & Capon Meat & Meat Offal Prepared or Preserved Excludng Lvers
0.1123 0.0183 0.0943
HS 160239 Duck, Goose & Gunea Fowl Meat & Meat Offal Prepared or Preserved Excludng Lvers
190.304 0.0338 189.967
References
Bojnec, S., & Ferto, I. 2009. Agro-food trade compettveness of Central EuropeanAgro-food trade compettveness of Central European and Balkan countres. Food Polcy. 34(5):417-425.
Bojnec, S., & Ferto, I. 2006. Comparatve Advantages and Compettveness of Hun-garan and Slovenan Agro- Food Trade n the EU Markets. Paper prepared for presentaton at the 98th EAAE Semnar ‘Marketng Dynamcs wthn the Global Tradng System: New Perspectves’.
Havrla, I. a. 2003. Analysng comparatve advantage and compettveness: an ap-plcaton to Australa’s textle and clothng ndustres. Australan Economc Paper, 42(1):103-117.
Seyoum, B. 2007. Revealed comparatve advantage and compettveness n servces: A study wth specal emphass on developng countres. Journal of Economc Studes 34(5):376-388.
Uchda, Y., & Cook, P. 2005. The Transformaton of Compettve Advantage n East Asa: An Analyss of Technologcal and Trade Specalzaton. World Develop-ment 33(5):701-728.