A New Two Points Method for Identify Dominant Harmonic
Disturbance Using Frequency and Phase Spectrogram
M. H. Jopri
1, N. A. Abidullah
2, G. Z. Peng
3, A. R. Abdullah
4Abstract – This paper is focused on a practical new method for dominant harmonic disturbance detection implemented using phase and frequency spectrogram based on two-point method. The first measurement point is measured at the incoming of the point of common coupling while the second measurement point at the incoming of the load. After that, the data is processed with phase and frequency spectrogram. By comparing the data, the dominant harmonic disturbance can be identified clearly. The proposed method is compared with power direction method which is the earliest method normally used in commercial product. Then, simulation and experiment are conducted to verify the accuracy of the proposed method. Finally, the results show the proposed method is more accurate than power direction method. Further work is needed to investigate the performance of the proposed method by field measurement. Copyright © 2014 Praise Worthy Prize S.r.l. - All rights reserved.
Keywords:Harmonic Disturbance, Frequency Spectrogram, Phase Spectrogram
Nomenclature
PCC Point of common coupling
PDM Power direction method
SLQI Supply load quality index
HGI Harmonic global index
SM Superposition method
CIM Critical impedance method
Vh Harmonic voltage
Ih Harmonic current
cos( ) Phase shift angle
P1 Fundamental active power
P Total active power
m Harmonic order with negative
active power
n Harmonic order with positive
active power
FS Frequency spectrogram
PS Phase spectrogram
STFT Short-time Fourier transform
x(t) Input signal
w(t) Observation window
Ih(pcc) Summation of Ih(load1) and Ih(load2)
Ih(load1) Harmonic current of load 1
Ih(load2) Harmonic current of load 2
Vh(pcc) Particular order amplitude
voltage
Vpcc The summation of Vh(pcc) from
harmonic order 0 to 50
Ipcc The summation of Ih(pcc) from
harmonic order 0 to 50
Ih(pcc) Particular order amplitude current
Zh(tsi) Total source impedance
Zh(supply_impedance) Supply impedance
Zh(transmission_impedance) Transmission impedance
Zh(load_impedance) Load impedance
Ph Power for harmonic order
I.
Introduction
In recent years, along with continual development of market economy and extension of industrial scale, more and more control equipments based on computer system and electrical equipment are used in many fields in order to improve work productivity and automation level [1].
These equipments have better performance and higher efficiency, but very sensitive response on variation of power supply quality. If the equipments operated with low power supply quality can contribute many economy losses. Moreover, accidents often occur because of low power supply quality, example the temperature of the wire increased when the wire conduct with high frequency current due to skin depth concept. In a nutshell, power quality improvement is the imperative task for power department and electricity consumer. In order to improve the power quality, the limitation of harmonics pollution present at the point of common coupling (PCC) had been control by IEEE Std. 519 [2] which widely accepted in industry. To be precise, the voltage waveform at the PCC is cover by EN 50160 [3]. The IEC 61000 [4], [5] standards mention about the limit of current waveform distortion and methods to measure the harmonic waveform distortion.
Many methods have been proposed in the previous papers. The power direction method (PDM) is the earliest
method to detect the dominant harmonic disturbance [6]. The negative active power value means the dominant harmonic disturbance is downstream; otherwise, dominant harmonic disturbance considered upstream. But the PDM is founded theoretically incorrect [7].
Supply load quality index (SLQI) [8] is a method to indicate the dominant harmonic disturbance. The SLQI in negative value means downstream as dominant harmonic disturbance and vice versa. The SLQI method cannot measure dominant harmonic disturbance individually and theoretically incorrect because the SLQI method is proposed base on PDM [7], [9]. The harmonic global index (HGI) is a method to indicate the dominant harmonic disturbance but theoretically incorrect because the HGI method is proposed base on PDM [7], [9].
Superposition method (SM) is proposed base on proper modeling with circuit analysis [10]. SM cannot be done accurately without the information for impedance of the entire system. Practically, SM is not a practical method because the impedance for the entire system is hard to be determined. Critical impedance method (CIM) is not a practical method because the analysis method is based on harmonic impedance [11]. Where by the harmonic impedance is hard to determine correctly. In order to overcome the shortages of previous method, a practical new method for dominant harmonic disturbance detection is implemented by using phase and frequency spectrogram based on two-point method.
This paper is focused on a practical new method for dominant harmonic disturbance detection is implemented by using phase and frequency spectrogram based on two-point method. The first measurement two-point is measured at the incoming of the point of common coupling. Then the second measurement point is measured at the incoming of the load. After that, the data is processed with phase and frequency spectrogram. By comparing the data, the dominant harmonic disturbance can be identified clearly. The proposed new method is compared with power direction method which is the earliest method and it used in commercial product [6]. Then, simulation and experiment are conducted to verify the accuracy of the proposed method. Finally, the results show the proposed method is more accurate than power direction method.
Further work is needed to investigate the performance of the proposed method by field measurement.
II.
Previous Technique Used
Method (a) - power direction method (PDM)
The PDM is the earliest method to detect the dominant
harmonic disturbance [6]. The Eq. (1) shows the formula for PDM. Where by, Vh and Ih is the particular harmonic
voltage and current respectively. The cos( ) is the phase shift angle for the particular voltage and current. The positive active power value means the dominant harmonic disturbance is upstream; otherwise, dominant harmonic disturbance considered downstream.
h h h Vh Ih
P V I cos (1)
Method (b) - Supply load quality index (SLQI)
Supply load quality index (SLQI) [8] is a method to indicate the dominant harmonic disturbance. The SLQI in negative value means downstream as dominant harmonic disturbance and vice versa. The Eq.2 shows the formula for SLQI. Where by, P1 and P is the fundamental active power and total active power respectively:
1 P SLQI
P (2)
Method (c) - Harmonic global index (HGI)
The harmonic global index (HGI) is a method to
indicate the dominant harmonic disturbance but theoretically incorrect because the HGI method is proposed base on PDM [7], [9]. The Eq. (3) shows the formula for HGI. Where by, the m and n is the harmonic order with negative and positive active power proper modeling with circuit analysis. Practically, SM and CIM are not a practical method because the harmonic impedance for the entire system is hard to be determined accurately.
III. Proposed Analysis Technique
Time frequency analysis technique is used in this research. In this part, the theory of time-frequency analysis is discussed. The amplitude of the waveform can be computed by frequency spectrogram. However the phase angle of the waveform can be defined by using phase spectrogram.
A. Frequency spectrogram
where x(t) is the input signal and w(t) is the observation window which is hanning window. The standard IEC defined that the hanning window can perform better in analyzing harmonic [12]. The parameter instantaneous root means square value is defined by [13].
B. Phase spectrogram
In order to obtain PS, the signal is processed with short-time Fourier transform(STFT) at first. Where x(t)
is the input signal and w(t) is the observation window which is rectangular window. The t (Eq. (6)) is 0.02s (1/fundamental frequency where by the fundamental frequency is 50Hz). number of phase angle of the STFT result. The PS result obtained by average the phase angle of the STFT result.
The PS is taken into accounts and expressed as:
2
IV. Principle of Proposed Method
The schematic harmonic load is shown in Fig. 1 consists of two harmonic loads. In order to determine the dominant harmonic disturbance, two measurement points are taken. The Ipcc and Ih(load2) are measured to determine the dominant harmonic disturbance whether the dominant harmonic disturbance is Ih(load1) or Ih(load2).
Fig. 1. Schematic for harmonic load
The Eq. (10) until (14) show the equation for addition of supply impedance (Zh(supply_impedance)), transmission impedance (Zh(transmission_impedance)), and load impedance (Zh(load_impedance)) [17]. The Zh(supply_impedance) is contributed by the transformer impedance. However the Zh(transmission_impedance) is generated by the distance wire on the transmission line. Lastly, the Zh(load_impedance) depends on the load:
Zh(tsi) = Zh(supply_impedance) + Zh(transmission_impedance) +
+Zh(load_impedance) (13)
Next, the particular order voltage (Vh(pcc)) is produced by multiplied Ih(pcc) and Zh(tsi) which following ohm’s law:
Vh pcc h pcc Ih pcc Ih pcc Zh tsi Zh tsi (14)
In this proposed method, the total source impedance is not involved to determine the dominant harmonic disturbance due to the complexity on measuring the total source impedance. Only Kirchhoff's Current Law is used to determine the dominant harmonic source. Eq. (15) and (16) show equation for upstream and downstream
The first case is about the power direction method. However the second case is about the proposed method. In the case study, the particular method is analyzed based on its accuracy.
a) Case study for power direction method
The method b and c are generated base on power direction method (method a) [9]. The case study is emphasized on power direction method because the method is been used commercially [6] and it is the basic method for method b and c. Eq. (17) shows the equation for power direction method.
If the Ph in negative value means the harmonic source occurred at the customer side (downstream); otherwise, it is consider as upstream:
h
h h pcc h pcc V h I
P V I cos (17)
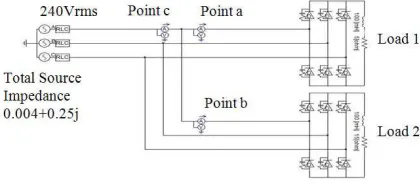
For the case study for power direction method, the total source impedance is assumed as 0.004+0.25j. Fig. 4 shows the schematic for harmonic load for case study power direction method.
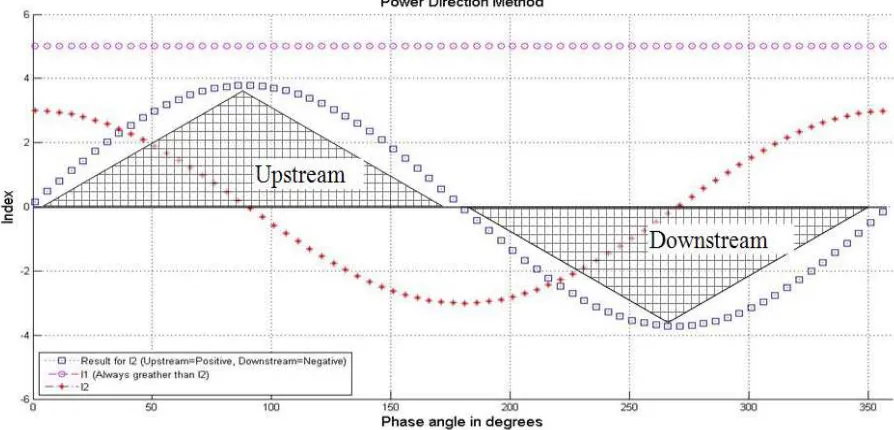
Fig. 2 shows the correlation between power direction method and the current value.
Based on Fig. 4, the amplitude of Ih(load1) (5 0°) always greater than Ih(load2) (3 various from 0° to 360°).
The Ih(load2) is various from 0° to 360° because there is no limitation phase shift angle for harmonic current [18]. The actual result is upstream for Ih(load2) with any phase angle occurred.
Fig. 2. Correlation between the power direction method and current value
Fig. 4. Schematic for case study
Based on the correlation result in Fig. 2, the power direction’s result gives 50 % chance that the contradiction can occur [18] because the result various between upstream and downstream.
b) Case study for proposed method
For the case study for proposed method, the value for total source impedance, Ih(load1), Ih(load2) and schematic (see Fig. 4) are similar with the case study for power direction method. Fig. 3 shows the correlation between the proposed method and current value. As usual, the amplitude of Ih(load1) (5 0°) always greater than Ih(load2) (3 various from 0° to 360°). The actual result is upstream for Ih(load2) with any phase angle occurred. The proposed method can provided a constant upstream result with any phase angle occurred at the Ih(load2). Based on the correlation result in Fig. 2 correlation between the power direction method and current value, Fig. 3, the proposed method’s result gives 100 % accuracy.
VI. Simulation Result and Analysis
In this research, the simulation is done by PSCAD. Fig. 5 shows PSCAD simulation schematic circuit. The simulation consists of two harmonic loads. The total source impedance is assumed as 0.004+0.25j.
The measurement point a and b is used to measure load 1 and load 2 respectively. However the measurement point c is used to measure the total load of the simulation. In the simulation, the power supplied with pure 240Vrms, 50Hz.
Fig. 5. PSCAD simulation schematic
Table I shows the PSCAD simulation result. The actual harmonic source is on load 1 because the load 1 (Measurement point a) is generated more harmonic current than load 2 (Measurement point b). The result for power direction method via Eq. (17) is not similar with the actual harmonic source.
But the proposed method shows the same result with the actual harmonic source.
The proposed method can be computed via Eq. (15) and (16). For 5th and 7th order harmonic, the calculation for proposed method is shown Eq. (18) and (19) respectively.
In the nutshell, the simulation result shows that the proposed method more accurate than the power direction method:
14 10 5 4 5 4 (18)
10 40 3 32 3 32 (19)
TABLE I PSCADSIMULATION RESULT
1 232 -95° 62 -105° 5 20 -87° 9 13° 7 16 -120° 7 -42° 1 232 -95° 27 -107°
5 20 -87° 5 4° Up Down Up 7 16 -120° 3 -32° Up Up Up 1 232 -95° 88 -105°
5 20 -87° 14 10° 7 16 -120° 10 -40°
VII. Experiment Result and Analysis
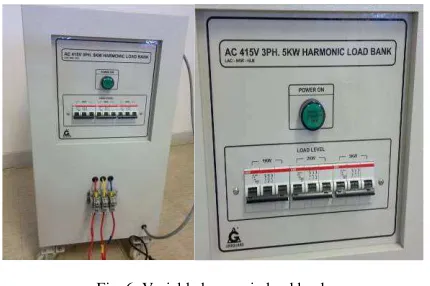
In this research, the experiment is done by harmonic generator (see Fig. 6) and the connection similar with PSCAD. The harmonic generator can variable the harmonic load level between 1kW to 5kW. In this experiment, the load 1 and load 2 are defined as 1kW and 5kW respectively. The experiment (see Fig. 7) is supplied with pure 240 Vrms, 50 Hz and the source impedance is unknown practically. Two measurement points are conducted in this experiment to identify the dominant harmonic disturbance.
Ipcc is the first measurement point to identify the total harmonic generated by the system. However, Iload2 is the second measurement point to identify the harmonic generated by the particular load. With the information of Ipcc and Iload2 the dominant harmonic disturbance can be identified by equation (Eq. (18) and (19)) weather is load 1 or load 2.
Fig. 6. Variable harmonic load bank
However, Eq. (22) and (23) show the method for the proposed method. The result show the proposed method are similar with actual result. Finally, the experiment
PRACTICAL EXPERIMENT RESULT
1 239.40 0° 6.68 0°
In this paper, a new two point method is proposed for identify the dominant harmonic disturbance at the PCC.
Based on the analysis of the method, the proposed new method is performed 100% (see Fig. 3) accuracy while the power direction is performed accuracy with 50% (see Fig. 2). Moreover, the result in Tables I and II show the proposed new method is more accurate than the power direction method. The proposed new method does not require any data other than the voltage and current waveforms at the measuring point. But the cost of instrument setup required for proposed new method is more than power direction method because the proposed new method needs to take two measurement points at the PCC while power direction only take one measurement point. Taking into account on the advantages and accuracy, the proposed method can be considered as practical, easy to implement and compatible. The proposed method was tested via simulations and experiment. Simulation and experiment results have verified the accuracy of the proposed method. However, further work is needed to investigate the performance of the proposed method by field measurement.
Acknowledgements
[1] P. Li, L. Zhao, H. Bai, and Y. Zhang, "Power Quality Monitoring of Power System Based on Spectrum Analysis," in Product E-Service and E-Entertainment (ICEEE), 2010 International Conference on, 2010, pp. 1-4.
[2] T. M. Blooming and D. J. Carnovale, "Application of IEEE STD 519-1992 Harmonic Limits," in Pulp and Paper Industry Technical Conference, 2006. Conference Record of Annual, 2006, pp. 1-9.
[3] "Voltage characteristics of the electricity supplied by public distribution systems," EN 50160, 1994.
[4] "Limitation of Emission of Harmonic Currents in Low-Voltage Power Supply Systems for Equipment with Rated Current Less Than 16A," IEC 61000-3-2, 2000.
[5] "Assessment of Emission Limits for Distorting Loads in MV and HV Power Systems," IEC 61000-3-6, 1996
[6] L. Cristaldi and A. Ferrero, "Harmonic power flow analysis for the measurement of the electric power quality," Instrumentation and Measurement, IEEE Transactions on, vol. 44, pp. 683-685, 1995.
[7] X. Wilsun, L. Xian, and L. Yilu, "An investigation on the validity of power-direction method for harmonic source determination,"
Power Delivery, IEEE Transactions on, vol. 18, pp. 214-219, 2003.
[8] A. M. A. Ferrero, R. Sasdelli, "Measurement of the Electric Power Quality and Related Problems," ETEP, vol. 6, p. 5. [9] M. E. Balci, O. Karacasu, and M. H. Hocaoglu, "A detection
method for harmonic producing loads," in Electrical and Electronics Engineering, 2009. ELECO 2009. International Conference on, 2009, pp. I-149-I-153.
Power Delivery, IEEE Transactions on, vol. 15, pp. 804-811, 2000.
[11] C. Chaoying, L. Xiuling, D. Koval, X. Wilsun, and T. Tayjasanant, "Critical impedance method - a new detecting harmonic sources method in distribution systems," Power Delivery, IEEE Transactions on, vol. 19, pp. 288-297, 2004. [12] J. Barros and R. I. Diego, "On the use of the Hanning window for
harmonic analysis in the standard framework," Power Delivery, IEEE Transactions on, vol. 21, pp. 538-539, 2006.
[13] A. R. Abdullah and A. Z. Sha'ameri, "Power quality analysis using linear time-frequency distribution," in Power and Energy Conference, 2008. PECon 2008. IEEE 2nd International, 2008, pp. 313-317.
[14] G. C. Laurent Navarro , Jean-Charles Pinoli "Continuous frequency and phase spectrograms: a study of their 2D and 3D capabilities and application to musical signal analysis," Journal of Zhejiang University SCIENCE A vol. 9, pp. 199-206, 2008. [15] "Recommended practices in monitoring electric power quality "
MS 1533:2002 (CONFIRMED:2012)
[16] P. Feldmann and R. A. Rohrer, "Proof of the number of independent Kirchhoff equations in an electrical circuit," Circuits and Systems, IEEE Transactions on, vol. 38, pp. 681-684, 1991. [17] P. Clarkson, P. S. Wright, A. J. Wheaton, and J. H. Belliss,
"Power source impedance measurement system for testing compliance to IEC 61000-3-3," in Precision Electromagnetic Measurements (CPEM), 2010 Conference on, 2010, pp. 345-346. [18] W. Xu, "Power direction method cannot be used for harmonic
source detection," in Power Engineering Society Summer Meeting, 2000. IEEE, 2000, pp. 873-876 vol. 2.
[19] Ç. Arikan and M. Özdemir, "Classification of power quality disturbances using support vector machines and comparing classification performance," International Review of Electrical Engineering (IREE), vol. 8(2), pp. 776-784, 2013.
[20] Z. Moravej and M.Pazoki, "Application of a new combined technique to power quality events classification," International Review of Electrical Engineering (IREE), vol. 7(2), pp. 4172-4182, 2012.
Authors’ information
1, 2, 3, 4Faculty of Electrical Engineering, Universiti Teknikal Malaysia Melaka.
Mohd Hatta Bin Jopri was born in Johor, Malaysia on 1978. He received his B.Sc from University of Technology Malaysia in 2004 and Msc. in Electrical Power Engineering from Rheinisch-Westfälische Technische Hochschule Aachen(RWTH), Germany in 2011. Since 2005, he has been an academia staff in the Universiti Teknikal Malaysia Melaka (UTeM). His fields of interests are power quality, motor drives and power electronics.
Noor Athira Abidullah was born in Melaka, Malaysia, on August 16 1989. She received B. Eng. degrees with honours in electrical engineering from the University Teknikal Malaysia Melaka (UTeM) on 2013. Currently, she is a master degree student researcher in power quality in electrical engineering at Universiti Teknikal Malaysia Melaka (UTeM).
Goh Zai Peng was born in Perak, Malaysia, on January 21 1987. He received B. Eng. degrees with honours in electrical engineering from the University Tun Hussein Onn Malaysia (UTHM) on 2013. Currently, he is a master degree student researcher in power quality in electrical engineering at Universiti Teknikal Malaysia Melaka (UTeM).