Submitted: July 28, 2013 Accepted: August 06, 2013 Published: April 19, 2014
Corresponding Author: Faiz Arith, Faculty of Electronic and Computer Engineering, Universiti Teknikal Malaysia Melaka, Hang Tuah Jaya, 76100 Durian Tunggal, Melaka, Malaysia
Effects of Exciton-polariton on Mach-zehnder Interference Devices
1, 2
Faiz Arith, 2A. Nizamuddin, 1IdzdiharIdris, 1A.A. Latiff and 2T. Katsuyama
1
Faculty of Electronic and Computer Engineering, Universiti Teknikal Malaysia, Melaka, Hang Tuah Jaya, 76100 Durian Tunggal, Melaka, Malaysia
2
Graduate School of Engineering, University of Fukui, Bunkyo 3-9-1, Fukui 910-8507, Japan
Abstract: A new optoelectronic device based on excitonpolariton was studied. In particular a Mach-Zehnder interference device fabricated by using a GaAs quantum well was studied. We simulated the output characteristics of Mach-Zehnder interference device by using a Finite Difference Time Domain (FDTD) method. Then we compared them with the experimental results measured in a low-temperature. After that we obtained the numerical values of electro-optic effect coefficients. Those were as large as 105×10-11 m/V for 4.5 K, while 74×10-11 m/V for 77 K. Therefore this estimation is considerably large, showing 57 (4 K) and 41 (77 K) times larger than conventional KDP crystal. This effect is probably caused by the excitonpolariton effect. Furthermore, we performed a photocurrent experiment to understand the transmitted light phase change characteristics, causing such large electro-optics effect at a comparatively higher temperature. Temperature dependence of photocurrent showed that the absorption edge and exciton peak remained constant up to 77 K, and then shifted to lower energy as the temperature increased. This probably explains how the large electro-optic effect can be obtained at a comparatively high temperature, i.e., 77 K.
Keywords: Electro-optic effect coefficient, Finite Difference Time Domain (FDTD), photocurrent, quantum well waveguide
INTRODUCTION
Optical communication systems utilize optical devices to modulate, to transmit and to process optical signal. Rapid development of the information society has led to an increase in the speed of data transfer. Therefore, it becomes inevitable to develop the optical devices to increase bandwidth, to increase the response and to minimize the system size (Ismail et al., 2014; Latiff et al., 2013; Chuang, 1999).
In order to realize such devices, we examined the basic characteristics of the Mach-Zehnder (MZ) type interference device. The MZ type interference device can be used as an optical modulator in an optical communication system (Cvijetic, 2004). Our device, the MZ interference device with a multiple quantum well waveguide can be a promising candidate for an ultrafast modulator due to excitonicpolariton effect (Tada et al., 2005; Katsuyama and Ogawa, 1994; Jeffrey and Ashley, 1994). The concept of excitonicpolariton was introduced by Pekar (1958), Hopfield (1958) and Hopfield and Thomas (1963). An excitonpolariton is a composite quasi-particle formed by coupling of an exciton and photon. One of the most significant inherent features of excitonicpolariton is high sensitivity to an electric field (Liew et al., 2010; Hosomi et al., 1999).
In this research, we analyzed the characteristics of MZ interference device fabricated by using a GaAs quantum well. We performed a numerical simulation using a Finite Difference Time Domain (FDTD) method to understand the propagating light. Then we compared the simulation results with the experimental results and calculated the electro-optic effect. We also measured photocurrent of the device to understand the phase shift relating to the interference effect (Steger et al., 2012).
MATERIALS AND METHODS
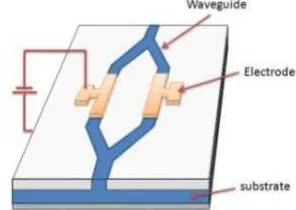
Sample structure: Figure 1 shows a schematic illustration of the MZ interference device, which
Fig. 2: Layer structure of the quantum well waveguide
Fig. 3: Mach-zehnder interference device
consists of a 2 μm-wide GaAs/AlGaAs single-mode
waveguide and a 1.06 mm-long electrode for applying
the electric field. The cross-sectional structure of the wave guide (Fig. 2) which is made of p-i-n GaAs/AlGa Aslayers. A 1.8 μm-thick Al0.13Ga0.87As core layer is
sandwiched between Al0.17Ga0.83As cladding layers. At
the center of the core layer, ten layers of 7.5 nm GaAs/Al0.3 Ga0.7As Quantum Wells (QWs) are formed.
The resonance wave length of the quantum well is 803 nm at 4.5 K. The total length of the device is 2.45 mm. Figure 3 is a microscopic image of the actual device, which has the shielding electrodes that are necessary for stable operation (Katsuyama and Hosomi, 2002).
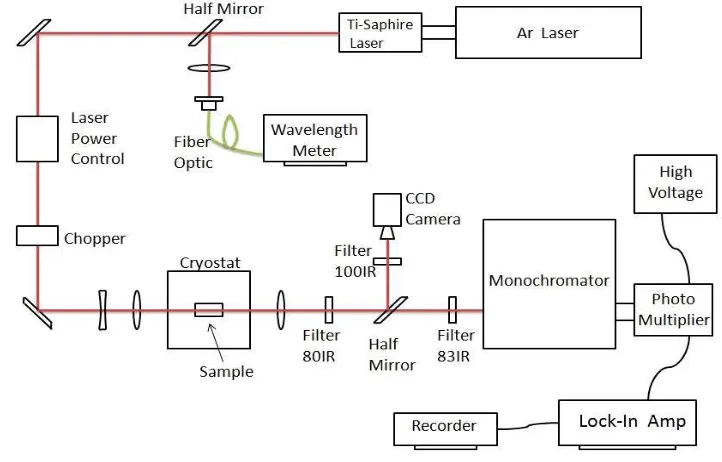
Experimental measurement system: The optical measurement setup is schematically Fig. 4 where tunable Ti-sapphire laser, excited by an Ar laser, was used as a light source. The tunable range of the Ti-sapphire laser was 770-870 nm and the power for this measurement was fixed to 10 mW. The Ti-sapphire laser beam was transmitted with conventional optics
and focused on the end of the Mach-Zehnder interference device in the cryostat. After that the transmitted beam entered the monochromator and the output was then measured by the lock-in-amp. The transmitted beam was also observed by a CCD camera. Reverse bias voltage was applied to the sample with the wire connected to the sample in the cryostat (Nizamuddin et al., 2009).
RESULTS AND DISCUSSION
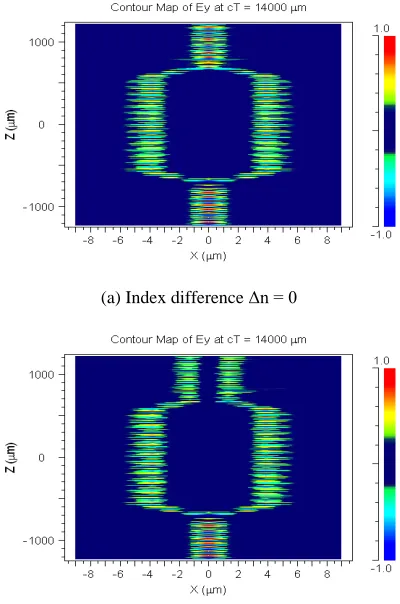
Simulation results: In the simulation, refractive index was changed in one side of the waveguides in every simulation by adding 0.00025 refractive index
difference Δn. Then the output light intensity was
observed at the end of the waveguide. The typical simulation results are shown in Fig. 5. As shown in
Fig. 5a, the refractive index difference Δn was zero and
then the output was maximum. While in Fig. 5b, when the refractive index difference was 0.000353, the propagating light was perfectly radiated from the waveguide and the output intensity became zero.
The simulation result was then plotted Fig. 6, showing the relation between the normalized output power and the index difference between two arms of the waveguides. The result showed the first minimum
(a) Index difference Δn = 0
(b) Index difference Δn = 0.000353
Fig. 5: Simulation of light transmission in the sample
Fig. 6: Refractive index difference vs. output
Fig. 7: Voltage vs. current
output was observed when the refractive index
difference Δn was 0.000353. That means the light wave
had shifted its phase by π rad.
Experimental results: Figure 7 shows the reverse bias characteristic of the sample. The break down voltage was -19 V, showing that the sufficient electric field can be applied to the quantum well layer.
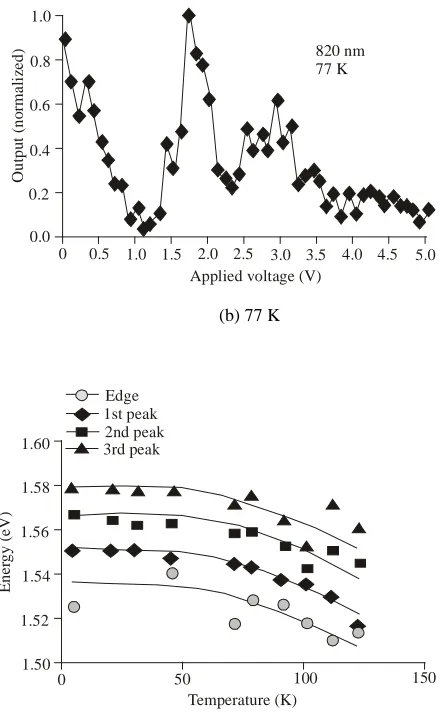
By using these samples, we measured the light transmission characteristics and compared the measured results with simulation. Figure 8 shows the voltage dependence of the output for the sample at 4.5 and 77 K (Katsuyama and Hosomi, 2003). Results showed the voltage, giving the first minimum output power, was 0.7 V for 4.5 K and 1.1 V for 77 K. Therefore, these values corresponded to the refractive index difference
Δn = 0.000353 which was obtained by the above
simulation.
(a) 4.5 K (b) 77 K
Fig. 8: Voltage dependence of the output
Fig. 9: Photocurrent result at 4.5 K
Fig. 10: Photocurrent results
At a comparatively higher temperature (77 K), the phase shift operation was still stable, also still giving a high electro-optic effect. In order to clarify the phenomena of this phase shift, we measured temperature dependence of the photocurrent. As the photocurrent is related to the absorption coefficient, we can get a clue to understand the refractive index change. Photo current was measured by applying the reverse
Fig. 11: Edge and peak values of photocurrent spectra
bias-2 V to the electrode at temperature from 4 to 120 K.
Figure 9 shows the photocurrent spectrum at 4.5 K. Slope edge can be found at about 1.52 eV and 1st peak is 1.55 eV. This 1st peak is probably related to the exciton absorption energy. At a higher energy region there are 2nd and 3rd peaks. Figure 10 shows the temperature dependence of photocurrent spectra. The photocurrent was normalized in this case. The result shows that the photocurrent spectrum edge and peaks move to lower energy region as the temperature increases.
Figure 11 shows the temperature dependence of the edge value, 1st, 2nd and 3rd peak values. It was found that each peak energy remained constant up to 50 K then shifted to lower energy. These photocurrent behavior means that the absorption coefficient should not be change much up to near 77 K. As a result, we expect that the refractive index would also be stable up to near 77 K. This probably gives the reason why we can still get a large refractive index change at the comparatively high temperature, i.e., 77 K.
1.0
1.52 1.54 1.56 1.58 1.60
CONCLUSION
We performed the analysis of the characteristics of Mach-Zehnder interference device, which has at the center of the core layer of the device, ten layers of 7.5 nm GaAs/Al0.3 Ga0.7As quantum wells. The simulation
result showed that the minimum output was observed when the refractive index difference was 0.000353. Compared with the experimental result there fractive index change of the sample reached as large as 105×10-11 m/V for 4.5 K, while 74×10-11 m/V for 77 K. Therefore this estimation is considerably large, showing 57 (4 K) and 41 (77 K) times larger than conventional KDP crystal. This effect was probably caused by the excitonicpolariton effect. It is noticeable that at a comparatively higher temperature (77 K) phase shift operation still remained efficient. In order to understand how excitonpolariton affected the phase shift in our device we measured the temperature dependence of photocurrent. The result showed that exciton transition energy peaks and edges of photocurrent spectra remained constant up to near 77 K, and then shifted to lower energy. This probably explains how the phase shift operation still remained efficient at the comparatively high temperature (77 K).
REFERENCES
Chuang, S.L., 1999. Physics of Photonics Devices. 2nd Edn., Wiley, New Jersey.
Cvijetic, M., 2004. Optical Modulators. In: Optical Components as Constituents of Lightwave Paths: Optical Transmission System Engineering. Artech House, Norwood, Massachusetts, pp: 24-28. Hopfield, J.J., 1958. Theory of the contribution of
excitons to the complex dielectric constant of crystals. Phys. Rev., 112(5): 1555-1556.
Hopfield, J.J. and D.G. Thomas, 1963. Theoretical and experimental effects of spatial dispersion on the optical properties of crystals. Phys. Rev., 132(2): 563-572.
Hosomi, K., M. Shirai and T. Katsuyama, 1999. Phase modulation of polariton in GaAs quantum well waveguide. Proceeding of the SPIE3899, Photonics Technology into the 21st Century: Semiconductors, Microstructures and Nanostructures, pp: 176.
Ismail, M. M., M. A. Othman, Z. Zakaria, H. A. Sulaiman, M. H. Misran, R. A. Ramlee, M. A. M. Said, N. F. Abas, M. N. Zainudin, R. A. Rahim, M. M. M. Aminuddin and M. I. Idris, 2014. Bending waveguide modeling for light trapping into optical fiber. Advanced Sci. Lett., 20(2): 412-417.
Jeffrey, S. and P.R. Ashley, 1994. High-performance Mach-Zehnder modulators in multiple quantum well GaAs/AlGaAs. J. Lightwave Technol., 12(7): 1167-1173.
Katsuyama, T. and K. Hosomi, 2002. Phase control of an exciton-polariton in a quantum well waveguide and its application to optical devices. Microelectron. Eng., 63(1-3): 23-26.
Katsuyama, T. and K. Hosomi, 2003. Progress in nano-electro-optics II: Novel Devices and Atom Manipulation. In: Ohtsu, M. (Ed.), Springer, New York, pp: 60-110.
Katsuyama, T. and K. Ogawa, 1994. Excitonic polaritons in quantum‐confined systems and applications to optoelectronic devices. J. Appl. Phys., 75(12): 7607-7625.
Liew, T.C.H., A.V. Kavokin, T. Ostatnicky, M. Kaliteevski, I.A. Shelykh and R.A. Abram, 2010. Exciton-polariton integrated circuits. Phys. Rev. B., 82: 033302.
Latiff, A. A, A. Jaafar, H. Rafis, V. R. Gahnnapathy and M. N. S. Zainudin 2013. Design high-Q square resonator add-drop filter for CWDM application. Australian J. Basic Appl. Sci., 7(10): 364-367.
Nizamuddin, A., Y. Kuwamura, M. Hattori and T. Katsuyama, 2009. Cryogenic characteristics of Mach-Zehnder interference devices composed of GaAs quantum-well waveguides. Proceeding of the 70th Autumn Meeting, Japan Society of Applied Physics, 11a-P8-2.
Pekar, S.I., 1958. The theory of electromagnetic waves in a crystal in which excitons are produced. Sov. J. Exp. Theor. Phys., 6: 785.
Steger, M., C. Gautham, B. Nelsen, D. Snoke, L. Pfeiffer and K. West, 2012. Single-wavelength, all-optical switching based on exciton-polaritons. Appl. Phys. Lett., 101: 131104.