THE EFFECTIVENESS OF TREE DIAGRAM
TECHNIQUE AS A MEANS OF TEACHING WRITING
(
An Experimental Study of the Eleventh Grade Studentsof SMA Negeri 2 Bae Kudus in the Academic Year of 2010/2011
)
a final project
submitted in partial fulfillment of the requirements for the degree of Sarjana Pendidikan
in English
by
Ririn Ambarwati 2201407099
ENGLISH DEPARTMENT
FACULTY OF LANGUAGES AND ARTS
SEMARANG STATE UNIVERSITY
PERNYATAAN
Dengan ini saya,Nama : Ririn Ambarwati
NIM : 2201407099
Prodi / Jurusan : Pendidikan Bahasa Inggris / Bahasa dan Sastra Inggris
Fakultas Bahasa dan Seni Universitas Negeri Semarang, menyatakan dengan sesungguhnya bahwa Skripsi / Tugas Akhir /Final Project yang berjudul:
“THE EFFECTIVENESS OF TREE DIAGRAM TECHNIQUE AS A
MEANS OF TEACHING WRITING (An Experimental Study of the
Eleventh Grade Students of SMA Negeri 2 Bae Kudus in the Academic Year
of 2010/2011)”
Saya tulis dalam rangka memenuhi salah satu syarat untuk memperoleh gelar sarjana ini benar-benar merupakan karya saya sendiri yang saya hasilkan setelah melalui penelitian, pembimbingan, diskusi, pemaparan atau ujian. Semua kutipan baik yang langsung maupun sumber lainnya telah disertai keterangan mengenai identitas sumbernya dengan cara sebagaimana yang lazim dalam penulisan karya ilmiah. Dengan demikian, walaupun tim penguji dan pembimbing penulisan skripsi atau tugas akhir atau final project ini membubuhkan tanda tangan sebagai tanda keabsahannya, seluruh isi karya ilmiah ini tetap menjadi tanggung jawab sendiri. Jika kemudian ditemukan ketidakbenaran, saya bersedia menerima akibatnya.
Demikian, pernyataan ini dibuat dengan sebenarnya.
Semarang,
Yang membuat pernyataan
RIRIN AMBARWATI NIM. 2201407099
APPROVAL
This final project has been approved by the board of examination of the English Department of Faculty of Languages and Arts of Semarang State University (UNNES) on August 11, 2011.
Board of Examination:
1. Chairman:
Drs. Dewa Made Kartadinata, M.Pd.
NIP. 195111181984031001 _______________________
2. Secretary:
Dr. Dwi Anggani Linggar B., M.Pd.
NIP. 195901141989012001 _______________________
3. First Examiner:
Intan Permata H., S.Pd., M.Pd.
NIP. 197402242005012001 _______________________
4. Second Advisor as Second Examiner:
Drs. Amir Sisbiyanto, M.Hum.
NIP. 195311291982031002 _______________________
5. First Advisor as Third Examiner:
Drs. Suprapto, M.Hum.
NIP. 195407281983031002 _______________________
Approved by
The Dean of Faculty of Languages and Arts
Prof. Dr. Agus Nuryatin, M. Hum. NIP. 196008031989011001
ABSTRACT
Ambarwati, Ririn. 2011. The Effectiveness of Tree Diagram Technique as a Means of Teaching Writing (An Experimental Study of the Eleventh Grade Students of SMA Negeri 2 Bae Kudus in the Academic Year of 2010/2011). Final Project. English Department. Faculty of Languages and Arts. Semarang State University. Supervisor: I. Drs. Suprapto, M. Hum. II. Drs. Amir Sisbiyanto, M. Hum.
Key words: writing, tree diagram, experimental study.
This final project entitled “The Effectiveness of Tree Diagram Technique
as a Means of Teaching Writing” is an experimental research, which is intended to improve the students’ ability in writing through tree diagram technique. The subjects of the experiment were the students of grade XI IPA 3 of SMA Negeri 2 Bae Kudus as the experimental group and the students of grade XI IPA 2 as the control group. The research was conducted in the even semester of the academic year of 2010/2011.
This research was held in six meetings for both the experimental group and the control group. Four of the six meetings were devoted to the treatment of using tree diagram technique. In the first meeting, the writer gave explanation about tree diagram to the experimental group. Then, in the next meetings the writer discussed how the tree diagram could be conducted. In the fourth meeting, the students were asked to practice using tree diagram. Meanwhile, to the control group, the writer gave explanation about genres and grammar without using tree diagram technique or any special treatment. After accepting the treatment, in the last meeting both groups were doing their posttest. The test was used to know the writing development between the two groups.
The result of pretest showed the average score of the experimental group is 78.2, while the average score of the control group is 77.7. Meanwhile, the result of the posttest revealed that the average score of the experimental group is 88, while in the average score of the control group is 82.3. The difference in writing scores of the experimental group and the control group is 5.2. It showed that the average score of the experimental group is higher than that of the control group. Using t-test, the calculated t value was found 6.352. It is higher than the t-table value which is 1.998. From the calculation, it can be said that there is a significant difference of means between the experimental group and control group.
From the result of this study, the writer concludes that the students improve their ability of writing effectively through the use of tree diagram technique. Furthermore, with this technique the students are able to develop their ideas into a good essay. Moreover, the writer would like to offer some suggestions. Besides, their routine techniques, the teachers are suggested to use other techniques as well, especially tree diagram technique.
ACKNOWLEDGEMENTS
Bismillhirrahmanirrahim
Alhamdulillahirabbil’alamin, the writer would like to express her deepest thankfulness to Allah SWT for the blessing and health during the production of this final project.
This final project entitled “The Effectiveness of Tree Diagram as a
Means of Teaching Writing (An Experimental Study of the Eleventh Grade
Students of SMA N 2 Bae Kudus in the Academic Year of 2010/2011)” is
submitted to fulfil the partial requirements for the degree of Sarjana Pendidikan. The writer would like to deliver sincerest gratitude to:
1. Drs. Suprapto, M. Hum., as the first supervisor, for invaluable guidance. Moreover, thank you for his kindness and helpful corrections to this final project until its completion.
2. Drs. Amir Sisbiyanto, M.Hum., as the second supervisor who has examined this final project carefully and given many useful suggestions.
3. Sugino, M. Pd., as the headmaster of SMA N 2 Bae Kudus.
4. Budi Utami, S. Pd., as the English teacher of the eleventh grade students of SMA 2 Bae Kudus.
5. All the English lecturers in English Department.
6. My beloved parents, Bapak and Mamak for all the love they are given. 7. My beloved brother, Rully Ferdian Syah.
8. My beloved partner, Ario Budi Hikmawan who always helps all the time needed.
9. My best friend, Rizky Sandhi Safitri.
10. My combattants in the boarding house, Gubug Ayu (Atun, Nindi, Septa, Fitri, Icha, etc.), for sharing many laughs and happiness in this togetherness.
11. All of my friends of English Department ’07 who have shared knowledge and friendship.
The last, there is nothing perfect in this world and this final project is not an exception. Therefore, suggestions and criticisms are always needed. I hope this final project will be useful for all the readers both of English teacher or English students.
Semarang, August 2011
Ririn Ambarwati
Motto :
“Nothing is easy, but none is impossible.”
This final project is dedicated to : Beloved Bapak & Mamak,
TABLE OF CONTENTS
PERNYATAAN ... ii
APPROVAL ... iii
ABSTRACT ... iv
ACKNOWLEDGEMENTS ... v
MOTTO AND DEDICATION ... vii
TABLE OF CONTENTS ... viii
LIST OF FIGURES ... xi
LIST OF CHARTS ... xii
LIST OF APPENDICES ... xiii
CHAPTER I INTRODUCTION ... 1
1.1 The Background of the Study ... 1
1.2 Reasons for Choosing the Topic ... 4
1.3 Statement of the Problem ... 5
1.4 Purpose of the Study ... 5
1.5 Significance of the Study... 5
1.5 Limitation of the Study ... 6
1.6 The Outline of the Thesis ... 6
II REVIEW OF RELATED LITERATURE ... 8
2.1 Review of Previous Study ... 8
2.2 Review of Theoretical Background ... 9
2.2.1 Writing ... 10
2.2.1.1 Genres of Writing ... 11
2.2.1.2 Types of Writing Performance ... 12
2.2.1.3 The Developmental Writing Stages ... 13
2.2.1.4 Microskills and Macroskills of Writing ... 14
2.2.2 Writing Assessment ... 16
2.2.3 Mind Mapping ... 19
2.2.4 Techniques of Teaching Writing ... 21
2.2.5 Tree Diagram ... 25
2.3 Framework of Analysis ... 27
III METHODS OF INVESTIGATION ... 31
3.1 Research Design... 31
3.2 Research Variables ... 32
3.2.1 Dependent Variable... ... 32
3.2.2 Independent Variable... ... 33
3.3 Population and Sample ... 33
3.3.1Population ... 33
3.3.2 Sample ... 34
3.4 Method of Investigation ... 35
3.5 Type of Data ... 36
3.6 Instrument for Collecting Data ... 36
3.7 Method of Collecting Data ... 37
3.7.1 Pretest ... 37
3.7.2 Posttest ... 38
3.8 Method of Analyzing the Data ... 38
3.9 The t-Test... 43
IV DATA ANALYSIS AND DISCUSSION ... 41
4.1. Research Finding ... 41
4.1.1 The Pretest and Posttest Analysis ... 41
4.1.2 The t-Test Analysis ... 43
4.1.3 The Analysis of the Students’ Ability in General ... 46
4.1.3.1 The Analysis of Students’ Writing Skill in Pretest ... 46
4.1.3.2 The Analysis of Students’ Writing Skill in Posttest... 49
4.2 Discussion ... 51
V CONCLUSION AND SUGGESTION ... 54
5.1 Conclusion ... 54
5.2 Suggestion ... 55
REFERENCES ... 56
LIST OF FIGURES
Figure 2.1 Example of Mind Mapping Outline... 20 Figure 2.2 The Relation of Three Levels of Conceptualization and
Organization ... 22 Figure 2.3 Overview Reflect Theory in Tree Diagram Form ... 25 Figure 3.1 The Design of the Experimental Research ... 32
LIST OF CHARTS
Chart 4.1 The Average Score in Pretest for the Control Group
and the Experimental Group ... 41 Chart 4.2 The Average Score in the Posttest for the Control Group
and the Experimental Group ... 42 Chart 4.3 The Average Score for the Pretest and the Posttest of
the Control Group and the Experimental Group ... 43
LIST OF APPENDICES
1. List of the Students of the Control Group ... 59
2. List of the Students of the Experimental Group ... 60
3. Instrument of the Pretest ... 61
4. Lesson Plan of the Control Group ... 62
5. Lesson Plan of the Experimental Group ... 66
6. Instrument of the Posttest ... 70
7. Pretest Result of the Control Group ... 71
8. Posttest Result of The Control Group ... 72
9. Pretest Result of The Experimental Group ... 74
10.Posttest Result of The Experimental Group ... 75
11.t-Test Result ... 77
CHAPTER I
INTRODUCTION
This chapter presents the introduction to the research. It consists of the background of the study, reasons for choosing the topic, statement of the problem, purpose of the study, significance of the study, limitation of the study, and the outline of the thesis.
1.1
The Background of the Study
English has become the essential language since it is used as not only one of international and global languages, but also in most countries in the world English becomes the second language. In Indonesia, English is learned as a foreign language. It is already taught in a level of kindergarten. Moreover, English has also been taught at 3-4 years old students (pre-school level). That shows how essential the language is in our country as a developed country. For that reason, English has been given very intensively in Indonesia.
English is a language. John B. Carrol (1953: 953) states that
“Language is an arbitrary system of speech sounds or sequences
of speech sounds which is used or can be used in interpersonal communication by aggregation of human beings, and which rather exhaustively catalogs things, processess, and events in the human
environment.”
There are spoken language and written language. Written English is even so called difficult to do. Many people think that when we want to write in English, we should be more concerned about the grammar, the structure, etc. When we are writing, we need a long process of thinking before we want to write
our mind on a blank paper. At any level of studies, writing seems to be difficult to manage. People feel the difficulties to syncronize their writing with their mind. The problem that usually exists with writing English is when people have a lot of ideas in their head, but it seems not as easy as they transfer their ideas.
Curriculum that is used now in Indonesia’s education is KTSP
(Kurikulum Tingkat Satuan Pendidikan). The target of learning English for Senior High School is to make the students reach the informational level in spoken and written communication for solving daily activity problems. Students are supposed to be able to create any kind of short functional text, monologue, and essay in the forms of genre. In the level of eleven grade students, all kinds of text type or genre are already given. It is likely that the students are already familiar with writing text.
In order to ease the students when they are writing, especially on English, teachers may use mind mapping. Mind mapping is a way to learn a concept that refers to the method of processing information based on the concept of Tony Buzan in his book entitled Buku Pintar Mind Map. Buzan (2007: 07)
states that “A mind map is a diagram used to represent words, ideas, tasks, or other items linked to and arranged around a central key word or idea.” Mind maps are used to generate, visualize, structure, and classify ideas, and as media in study, organization, problem solving, decision making, and writing. By presenting idea in such a diagram or graphic, expects a brainstorming to plan or organize what is going to write.
Teachers can introduce the use of mind mapping and the practice way
to make such mind mapping. It is teachers’ responsibility to transfer knowledge
and skills he or she thinks it will help students in advance. In a level when the students are expected to create their own essay, the teachers should also give the prosedure of writing. One step in writing is organize the ideas. There are two simple ways to organize the ideas, brainstorming and mind mapping.
Hopefully, with tree diagram technique to help students’ writing, the
students’ skill in writing essay in a form of genre can improve and their ideas can
be delivered well in their writing.
1.2
Reasons for Choosing the Topic
The writer has some reasons which underline for choosing the topic of the study. The reasons can be formulated as follows:
The dominant activities in English class for the students are still reading and writing. It says right that nowadays many schools have been completed with the language library to improve the activity of teaching listening and speaking. In fact, the materials for speaking and listening are given minimumly. Still, many English teachers focus on reading and writing. Moreover, the material of teaching English today is text based. Of course the material is related to some genres of writing. Many teachers in Indonesia, based on the students’ experience, often ask their students to write. Unfortunately, some teachers that are very “kind” that they just ask their students to write anything without limitations. It looked like it would be so easy for the students to write, yet on the contrary some students would feel obviously confused. They do not know what is going to be written.
help their students to know how to organize their idea. As we know that the students are just stuffed with the hard skill than their needs of soft skills.
The last reason why the writer chooses the topic of this study is the curiousity to apply tree diagram as a means of teaching writing for eleven grade students of SMA N 2 Bae – Kudus in academic year 2010/2011. Especially the effectiveness of the tree diagram for improving the students’ writing ability itself.
1.3
Statements of the Problem
From the topic mentioned above, problems that are going to be investigated are : (1) How is the use of tree diagram technique as a means of teaching writing for
the eleventh grade students of SMA N 2 Bae – Kudus in academic year 2010/2011?
(2) Is teaching writing by using tree diagram more effective than teaching writing without using tree diagram?
1.4
Purposes of the Study
Based on the problems stated above, the first purpose of this study is to know how the use of tree diagram technique as a means of teaching writing for the eleventh grade students of SMA N 2 Bae – Kudus in academic year 2010/2011 is. The second purpose is to know whether teaching writing by using tree diagram technique is more effective than teaching writing without using tree diagram.
1.5
Significance of the Study
the tree diagram is a diagram that is used as strategic decision making, valuation or probability calculations. The diagram starts with a single node with branches extending to additional nodes. This method can help the students to organize their mind to ease their process of writing. Since writing text is the arrangement of sentences, the logical order is absolutely needed to make a coherence in a text.
Many English teachers are difficult to find ways to make their students fluent in writing English. Some cases appear when they are teaching writing, for example the student who has a big amount of vocabulary could not write very good because he could not syncronize his idea with his activity of writing. The writer hopes that this study can help the teachers to make their students better in organizing their idea of writing.
1.6
Limitation of the Study
This study is limited to the eleven grade students of SMA N 2 Bae Kudus in the academic year of 2010/2011 in using tree diagram as a means of teaching writing.
1.7
The Outline of the Thesis
Chapter I presents the introduction to the research. It consists of the background of the study, reasons for choosing the topic, statement of the problem, purpose of the study, significance of the study, limitation of the study, and the outline of the thesis.
Chapter III presents the method of investigation. It discusses the description of the methodology used in conducting the research. It consists of the research design, population, sample, method of investigation, type of data, instrument for collecting data, method of collecting data and method of analyzing data.
Chapter IV describes the results of the research based on data analysis and the discussion of research findings.
CHAPTER II
REVIEW OF RELATED LITERATURE
This chapter provides the review of related literature for this study. This chapter talks about review of previous study, writing, mind mapping, and tree diagram explanation.
2.1
Review of Previous Study
In conducting this research, the writer does not find a lot of previous studies about mind mapping in writing. Here are previous studies that have relation with this research.
First is a research that was conducted in 2010 by Utami entitled The Use of Prewriting Strategies: Brainstorming and Mind Mapping in Essay Writing (Recount). In this research, it is proven by the result of the research that there is difference between students who used prewriting strategies than the students who did not use prewriting strategies. The achievement reached by the students who used brainstorming and prewriting is higher than the students who did not. By using brainstorming and mind mapping, the students can improve their writing because they can get many ideas. The students also felt more exciting because they could use colors, images, and imagination.
The second research was conducted in 2008 by Susanto entitled The Application of Mind Mapping Method in Teaching Descriptive Writing. The objective of this study was to know if there was an effect of applying mind
mapping method in teaching descriptive writing to the third grade students of senior high school. The result of this study was that there is a significant difference between the experimental group and the control group. Most of the students were interested in exploring their imagination using mind mapping. From this research, the students are trained to think widely and be creative. Susanto, in his research, proposed some weaknesses. When students use mind mapping, they spend more paper sheets to do the test and more time. He also must have a broad knowledge especially in vocabularies because the students sometimes asked the English translation of the difficult words related to the topic.
There is also a previous study that concerned with mind mapping, but it has nothing to do with writing. It is a final project written by Farida (2010) entitled Efektivitas Pembelajaran Sistem Gerak Pada Manusia Melalui Pendekatan CTL Berbasis Mind Mapping. The result of this research was the students can learn about kinetic system for human being easier than the conventional way.
Unfortunately, the writer could not find any previous study about tree diagram in teaching writing. Hence, she focuses on the investigation of the effectiveness of tree diagram as teaching writing. The research introduces the use of tree diagram to the teachers, particularly the English teacher of the eleventh grade students of SMA Negeri 2 Bae Kudus.
2.2
Review of Theoretical Background
2.2.1 Writing
As we know that the skill of language which comes first is listening then followed by speaking, the skill of writing comes after the learners are able to read. Cited from brainyquotes.com, “Writing is the act or art of forming letters and characters on paper, wood, stone, or other materials, for the purpose of recording the ideas which characters and words express, or of communicating them to others by visible signs.” The goal of writing is to construct our idea and then to distribute it to communicate with other people.
According to Gerot and Wignell (1995: 158) in their book Making Sense of Functional Grammar, “writing is a manifestation of the linguistic system but in general it encodes meaning in different ways with speaking because it evolves to serve different purposes. When we think of writing, we tend to think of the artistic functions of writing but in the history of writing these functions are relative latecomers.”
According to Valette in Sisbiyanto in Language Testing I,
“communication through the written word possesses a certain degree of finality and demands real proficiency from the writer if it is to be effective. Written language possesses its own conversations, which in certain cases do not parallel the spoken language.”
Ghaith (2002) states that “writing is a complex process that allows writers to explore thoughts and ideas, and make them visible and concrete.” He
also states, “Writing encourages thinking and learning for it motivates communication and makes thought available for reflection. When thought is written down, ideas can be examined, reconsidered, added to, rearranged, and changed.”
From the above definitions of writing, the writer has the opinion that writing is an activity of communication that forms in a written word, whether it uses symbol or character, and it can possibly appear in any kind of media that human being are able to reach or invent. Furthermore, a writer should master the component of writing to make the communication through written word runs well. 2.2.1.1Genres of Writing
The word genre comes from the French (and originally Latin) word for 'kind' or 'class'. The term is widely used in rhetoric, literary theory, media theory, and more recently linguistics, to refer to a distinctive type of text.
Neale in chandler (2000) stresses that “genres are not systems: they are processes of systematization.” Traditionally, genres (particularly literary genres) tended to be regarded as fixed forms, but contemporary theory emphasizes that both their forms and functions are dynamic.
(1) Academic writing
This includes paper and general subject reports, essays and compositions, academically focused journals, short-answer test responses, technical reports, theses and dissertations.
(2) Job-related writing
This includes messages, letters/emails, memos, reports, schedules, labels, signs, advertisements, announcements, manuals.
(3) Personal writing
This includes letters, emails, greeting cards, invitations, calenders, shopping lists, financial documents, diaries, fiction, etc.
Some genres which are mentioned above maybe unfamiliar for the beginner and intermediate level learners, but the genres of personal writing can be said as common genres of writing that are any level of learners recognize them. Whereas based on Making Sense of Functional Grammar by Gerot and Wignell (1995), the genres they used are spoof, recounts, reports, analytical exposition, news item, anecdote, narrative, procedure, description, hortatory exposition, explanation, discussion, and reviews.
2.2.1.2Types of Writing Performance
(1) Imitative
This category includes the ability to spell correctly and to perceive phoneme-grapheme corespondences in the English spelling system.
(2) Intensive
Beyond the fundamentals of imitative writing are skills in producing appropriate vocabulary within a context, collocations, and idioms, and correct grammatical features of up to the length of a sentence.
(3) Responsive
Assessment tasks require the writer to perform at a limited discourse level, connecting sentence into a paragraph and creating a logically connected sequences of two or three paragraphs. Tasks respond to pedogogical directives, lists of criteria, outlines, and other guidelines.
(4) Extensive
Extensive writing implies successful management of all processes and strategies of writing for all purposes, up to the length of an essay, a term paper, a major research project report, or even a thesis.
2.2.1.3The Developmental Writing Stages
Obviously, not all students of the same age or grade level write in the same way; students pass through several developmental writing stages (Ghaith 2002):
(1) Stage1
approval from teacher and believes good writing comes easily. They are reluctant to revise any writing.
(2) Stage2
In this stage, the writer is called transitional writer (some called self-involved/self-delineating writer). In this stage, the writer needs support and coaching in order to develop. The transitional writers learn from modeled behaviors. They are developing a degree of comfort with the craft and are anxious to stand alone, yet is comfortable with peer collaboration. They are also developing an awareness of personal needs, interests, and preoccupations.
(3) Stage3
In this stage, the writer is called willing writer/ peer-involved writer. The writers are able to collaborate well with others. They require external feedback to shape progress. They are also developing objectivity and sensivity. Willing writer is able to profit from criticism.
(4) Stage4
In this stage, the writers have reached the independent writer. They usually make highly objective self-assessments and develop a sophisticated personal style. Independent writers are self-motivating and self-aware as a writer.
2.2.1.4Microskills and Macroskills of Writing
macroskills. The micro-skills apply appropriately to imitative and intensive writing activities, while the macroskills are essential for the mastery of responsive and extensive writing activities (Brown 2004: 221).
(1) Microskills of writing
a) Produce graphemes and orthographic patterns of English. b) Produce writing at an efficient rate of speed to suit the purpose.
c) Produce an acceptable core of words and use appropriate word order patterns. d) Use acceptable grammatical system.
e) Express particular meaning in different grammatical forms. f) Use cohesive devices in written discourse.
(2) Macroskillsof writing
a) Use the rethorical forms of convention of written discourse.
b) Appropriately accomplish the communicative functions of written texts according to form and purpose.
c) Convey links and connections between events.
d) Distinguish between literal and implied meanings when writing.
e) Convey culturally specific references in the context of the written texts. f) Develop and use a battery of writing strategies.
the research will be conducted in the eleven grade students of senior high school, the genres that are taught to the students are analytical exposition, narrative, recount, spoof, and hortatory exposition.
In order to make the writing activity is easier for the Senior High School students, a teacher must give a model of writing such a strategy for applying in writing process.
2.2.2 Writing Assessment
“Assessment is an ongoing process that encompasses a much wider domain.
Whenever a student responds to a question, offers a comment, or tries a new word
structure, the teacher subconsciously makes an assessment of the student’s
performance” (Brown, 2004: 4).
Many years ago, experts thought that writing was a convention for recording speech and for reinforcing grammatical and lexical features of language. Now, people understand that writing is a skill that has its own features and conventions. It is true that the assessment of writing is not a simple task. As the
teacher considers assessing students’ writing ability, he or she should be sure about the objective and the criterion of assessment.
number of subcategories (organization, grammar, etc) and gives a separate rating for each.
According to Valette in his book Methods of Evaluation on page 254, free composition may be evaluated formally or informally. On a formal test, the student produces a composition on a specific topic under specific conditions. Such tests have advantage of increased objectivity, and the results on such tests can be compared from student to student. The informal evaluation of composition skills usually takes the form of a daily diary in which the students can write about whatever interests them. This informal evaluation is not as subjective as the formal test, but it does provide the teacher with longer and more valid measure of the student’s writing skill.
“A diagnostic scoring system has the further advantage that its results
are more objective than those obtained by simply assigning a letter grade to a
composition” (Valette, page 255). The three sample scoring systems described
below may serve as a point of departure for a teacher setting up his or her own scoring system.
(1) Rating Specific Elements
(2) Teacher-prepared Rating Scale
In this scoring system, the teacher determines which aspects of the composition are to be scored and prepares a rating scale. Here is an example of elements that such a scale might contain:
Organization Excellent 6 5 4 3 2 1 Nonexistent Clarity of
expression
Easily
understood by native speaker
6 5 4 3 2 1 Incomprehensible to native speaker Breadth of
vocabulary
Imaginative of vocabulary
6 5 4 3 2 1 Repetitive use of high-frequency vocabulary
(3) Student-prepared Rating Scale
The establishment of a student-prepared rating scale is a two-day class project. On the first day, the class is divided into groups of four or five, and each group prepares a composition on an announced topic. The teacher circulates among the groups, answering questions and making corrections if needed. On the second day, the teacher distributes copies of the resulting group compositions. The students, either individually, in pairs, or in groups different form those in the first day, rank the papers in order of preference. Then the class ranking is placed on the board, and the students are asked to compare the top-ranked composition with the bottom-ranked paper determine what elements make it superior. These elements are then listed on the board, and may includes: imagination; organization; longer sentences; choice of words; etc.
students to do with the task; post task evaluation, assessing the effectiveness of the writing task.”
Based on some scoring system in writing above, the writer decided to use the scoring system that is explained by Brown which is analytical scoring. Analytical scoring has marking scale for each area which the teacher needs to assess. Analytical marking scales are generally more effective with inexperienced teachers. “Additionally, this type of marking is very reliable if done with a population of inexperienced teachers who have had little training and under short time constraints” (Heaton, 1990). The writer thinks that with the analytical scoring
system, the students’ writing ability can be easier to assess because the scales are often thought to be more explicit and detailed.
2.2.3 Mind Mapping
Simply, human brain memory capacity is related with received attention and process of thinking. The information that is received will be concerned with or related to the information that is received before or the information which has already existed in the memory. Therefore, human brain, automatically, will filter which information will stay in the memory or which information that will be deleted from the memory.
lazy to read their own note and the topic of the course will be last as a title in their notebook.
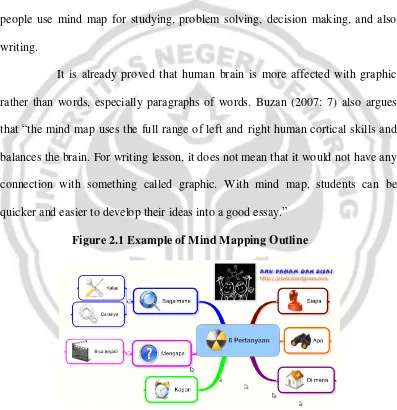
A mind map is a diagram that is used to represent ideas or items which are related and located around the central key word of ideas. Mind maps are used to generalize, organize, classify, and visualize ideas. Because of that reason, some people use mind map for studying, problem solving, decision making, and also writing.
[image:33.595.113.510.239.649.2]It is already proved that human brain is more affected with graphic rather than words, especially paragraphs of words. Buzan (2007: 7) also argues that “the mind map uses the full range of left and right human cortical skills and balances the brain. For writing lesson, it does not mean that it would not have any connection with something called graphic. With mind map, students can be quicker and easier to develop their ideas into a good essay.”
Figure 2.1 Example of Mind Mapping Outline
can recall any ideas related to the central key word and develop them into sentences to paragraph with cohesion. To help the students develop their branches, they can start using the words what, who, when, where, why, and how.
Mind map is one of the easiest way to organize the ideas when someone is going to write. Unfortunately, the classical form of mind map is still a little difficult to practice in writing paragraph. When someone puts his idea in the middle and then develops it with so many branches, he has already organized his idea. Yet the other problem appears when the writer wants to set his idea sentence by sentence. It would be more comfortable with mind mapping in the form of tree diagram.
2.2.4 Techniques of Teaching Writing
Teaching writing seems to be more difficult than teaching speaking because in
speaking, students are likely excused to make “mistakes” as long as the target
which contradicts, and all of which is based upon, the selected approach. An approach is axiomatic, a method is procedural. The last is technique which is implementational. That which actually takes place in a classroom. It is a particular trick, stratagem, or contrivance used to accomplish an immediate objective.
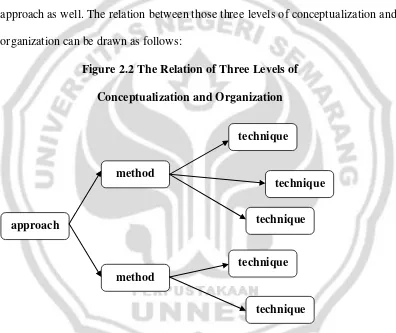
[image:35.595.113.509.272.605.2]In general, within one approach, there can be many methods. Else, techniques must be consistent with a method and should be in harmony with an approach as well. The relation between those three levels of conceptualization and organization can be drawn as follows:
Figure 2.2 The Relation of Three Levels of
Conceptualization and Organization
There are some techniques of teaching writing. Every technique has its own advantages and disadvantages. Here is some techniques of teaching writing:
approach
method
method
technique technique
First is peer-editing technique by Kovar (2010). Writing and evaluation are two sides of the same coin. To grow as writers, students must learn to develop an editorial eye by continuously re-engaging each piece of text.
The first step to do with the technique is to have the students exchange papers and evaluate each other’s work using the colored rubric sheets.
Then the students should put their own name as the “editor” at the top of the
colored feedback sheets that they fill-out. The editorial process should be viewed as its own assignment. When the editor finds an error, they should not only mark it but find a relevant reference in their text that explains why this is an error and how to fix it. Based on the feedback they receive, have the student writerscorrect their own papers. When they turn the assignment into the teacher they should staple or clip together the revised paper and the editing sheet they received with a
classmate’s name on it.
The peer-editing technique is a good technique. The students can learn from their friends. However, in peer-editing, the teacher should provide more papers for the evaluation rubric sheet at least for each student. This technique also takes time.
In collaborative writing, students will work in pairs to revise a piece of writing by replacing at least three general nouns. If it is necessary, the teacher will meet with a small group of students during this time to provide additional support and practice with the activity, but he or she may also move about the room and provide feedback to collaborative groups.
In this technique, teacher should have a good class management. For example, in shared writing teacher should be able to prevent a noisy class when the students try to express their ideas for the text. It is also difficult to combine the ideas from the whole class.
The third technique is vocabulary charts or picture charts by Scott and Ytreberg (1990). In this technique, students are asked to make a writing based on the key vocabulary or pictures from the teacher. This technique seems to be fun for the students. However, in advance students will have some difficulties in arranging their sentence.
In mathematics, there is a tree diagram. Tree diagram is a simple way to describe possible outcomes from a series of experiment if the results of any experiment may be finite (oemahmatematika.com). From this theory, the writer gets an idea to use the tree diagram technique for teaching writing.
Tree diagram technique in writing is a technique which is tree
diagram is used to organize and arrange the students’ ideas to make a good
of having trouble with sentence arrangements. The further explanation about how to use tree diagram in writing will be explained in the next subchapter.
2.2.5 Tree Diagram
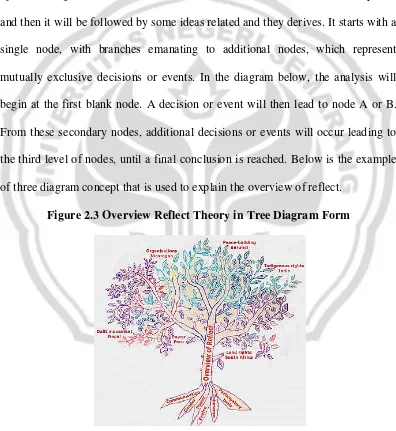
[image:38.595.113.509.264.695.2]Tree diagram is simply as one example of mind mapping. Whereas the mind map is a central idea surrounded by the branches of related ideas, tree diagram comes up with a diagram looks like a tree. It starts with its “root” as a central or key idea and then it will be followed by some ideas related and they derives. It starts with a single node, with branches emanating to additional nodes, which represent mutually exclusive decisions or events. In the diagram below, the analysis will begin at the first blank node. A decision or event will then lead to node A or B. From these secondary nodes, additional decisions or events will occur leading to the third level of nodes, until a final conclusion is reached. Below is the example of three diagram concept that is used to explain the overview of reflect.
Figure 2.3 Overview Reflect Theory in Tree Diagram Form
That example of the tree diagram above is the essay about the first day at school. It is cited from Writing to Communicate: Paragraphs and Essays (Boardman and Frydenberg 2001: 14). The central idea is the first day at school.
Then the idea begins with the branches of “good experience at school” and “bad
experience at school”. After that, a writer can expand his ideas into more branches at the tree diagram. With this diagram, it is intended for the writer to make him easier when he is starting to write his real essay.
My first day at school was good and bad
Good Bad
Noise of crayons Lots of
crayons Mrs. Grant
Coloring Chocolate kiss
Boy pulled
hair
Dad late
I cried Mom
sick
why how
Who,when,where
topic
why
why
why
How come
The tree diagram design above is the example of how we start our essay using tree diagram. As the reader can see, the first and central point is the topic or we can call it as central idea. The next step that the students should do is to make some branches below the root. These branches can be divided based on how many parts that the essay will be. If the essay will be four parts, so the root should have four branches. These branches include the main idea of each parts. Then, the next step is similar with the root. The next branches of the branch will depend on how detail the information will be. The more detail information or essay, the more branches the writer should have.
As the explanation before, tree diagram can ease the students to organize, classify, generalize, and visualize their ideas when they are up to make any genres of writing. Comparing with the practicality of mind map, tree diagram has more advantage where the writer will not be flustered when he comes to the stage of writing his idea sentence by sentence. Tree diagram aslo can activate the left and right brain to balance it because it can be mixed up with pictures. Surely the tree diagram is so useful to help the students more active in their writing activities.
2.3
Framework of Analysis
In this study, the writer wants to know how the tree diagram technique influences
the students’ writing ability. Hence, the study that is going to be conducted is an
The writer collects the data from the instrument. The instrument that
is used in this research is tests. From the tests, the writer will get the students’
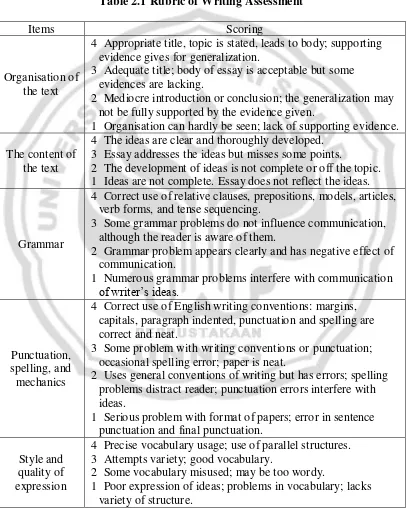
[image:41.595.110.517.230.741.2]score. The score system which she decides to choose is the analytical scoring system by Brown & Bailey (1984: 39-41).
Table 2.1 Rubric of Writing Assessment
Items Scoring
Organisation of the text
4 Appropriate title, topic is stated, leads to body; supporting evidence gives for generalization.
3 Adequate title; body of essay is acceptable but some evidences are lacking.
2 Mediocre introduction or conclusion; the generalization may not be fully supported by the evidence given.
1 Organisation can hardly be seen; lack of supporting evidence. The content of
the text
4 The ideas are clear and thoroughly developed. 3 Essay addresses the ideas but misses some points.
2 The development of ideas is not complete or off the topic. 1 Ideas are not complete. Essay does not reflect the ideas.
Grammar
4 Correct use of relative clauses, prepositions, models, articles, verb forms, and tense sequencing.
3 Some grammar problems do not influence communication, although the reader is aware of them.
2 Grammar problem appears clearly and has negative effect of communication.
1 Numerous grammar problems interfere with communication
of writer’s ideas.
Punctuation, spelling, and mechanics
4 Correct use of English writing conventions: margins, capitals, paragraph indented, punctuation and spelling are correct and neat.
3 Some problem with writing conventions or punctuation; occasional spelling error; paper is neat.
2 Uses general conventions of writing but has errors; spelling problems distract reader; punctuation errors interfere with ideas.
1 Serious problem with format of papers; error in sentence punctuation and final punctuation.
Style and quality of expression
4 Precise vocabulary usage; use of parallel structures. 3 Attempts variety; good vocabulary.
2 Some vocabulary misused; may be too wordy.
Each research has its own variables. In this research, there are two variables, dependent variable and independent variable. The dependent variable is
the students’ achievement in writing and the independent variable is the use of tree diagram technique in writing.
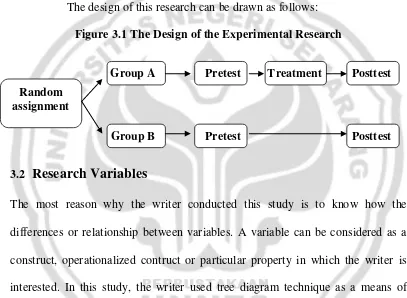
In this study, the writer will use two classes from the population. One class will be the experimental group and the else will be the control group. The experimental group is the group which is the treatment will be delivered to. The design of the experiment can be described as the following table:
Group Pretest Treatment Posttest
Experimental group √ √ √
Control group √ X √
The objective of this research is to know how is the effectiveness of tree diagram as a means of teaching writing for the eleven grade students of SMA N 2 Bae – Kudus in academic year 2010/2011. The writer will compare the
experimental group with the control group. If the experimental group’s score is higher than the control group and the difference is significant, so the tree diagram technique is effective as a means of teaching writing. To know if the difference is significant, the writer uses the t-test. The formula used in t-test is as follows:
� = −
∑ 2− ∑ 2
+ −2
1
+ 1
In which : t = t-test
My = means of the experimental group ∑X2 = variance of the control group ∑Y2 = variance of the experimental group Nx = number of the students in control group Ny = number of the students in experimental group
CHAPTER III
METHODS OF INVESTIGATION
This chapter presents the description of the methodology used in conducting the research. It consists of the research design, population, sample, method of investigation, type of data, instrument for collecting data, method of collecting data and method of analyzing the data.
3.1
Research Design
Mind mapping is a way to learn a concept that refers to the method of processing information. Moreover the tree diagram is a diagram that uses strategic decision making, valuation or probability calculations. The diagram starts with a single node with branches extending to additional nodes.
Considering the information above, the writer is interested in conducting quantitative research on how is the effectiveness of tree diagram as a means of teaching writing for the eleventh grade students of SMA N 2 Bae – Kudus in academic year 2010/2011. The type of research which is applied in this study is experimental research.
According to Gaudencio Aquino, “experimental research has purpose to investigate possible cause and effect relationships by exposing one or more experimental groups to one or more treatment conditions and comparing the results to one or more control groups not receiving the treatment, random assignment being essential.”
Basically, experimental research can have two or more groups that will be observed. In this research, the writer used two classes from the same level. The first class is the experimental group and the second class is the control group. The experimental group received treatment, that is they got the treatment which was about tree diagram. The control group did not receive the treatment at all. It means the control group did not receive the treatment using tree diagram.
[image:45.595.103.510.279.577.2]The design of this research can be drawn as follows:
Figure 3.1 The Design of the Experimental Research
3.2
Research Variables
The most reason why the writer conducted this study is to know how the differences or relationship between variables. A variable can be considered as a construct, operationalized contruct or particular property in which the writer is interested. In this study, the writer used tree diagram technique as a means of teaching writing. Thus, in this study there are dependent variable and independent variable.
3.2.1 Dependent Variable
“The dependent variable is the factor which is observed and measured to determine the effect of the independent variable, that is the factor that appears, disappears, or varies as the experimenter introduces, removes, or varies the
Group A
Group B Random
assignment
Pretest
Pretest
Treatment Posttest
independent variable” (Tuckman 1978). Thus, the dependent variable for this
research is the students’ achievement in writing.
3.2.2 Independent Variable
The independent variable, which is stimulus variable or input, operates either within a person or within his or her environment to affect behaviour. According to Tuckman (1978), “the independent variable the factor which is measured, manipulated, or selected by the experimenter to determine its relationship to an observed phenomenon.” Therefore, the independent variable for this study is the use of tree diagram technique in writing.
3.3
Population and Sample
This study was conducted in SMA N 2 Bae Kudus in the 2010/2011 academic year. Before conducting this research, the writer asked for permission from the school whether or not the study could be conducted. After the writer got permission, she composed the instrument for the study, which took the form of the test and administered it to the students to collect the data.
3.3.1 Population
“A population is all the possible members of a group defined by the researcher” (Huck and Bounds1974: 38).
IPS 3, and XI IPS 4. For science major, there are three classes which have different amount of the students. XI IPA 1 consists of 38 students, XI IPA 2 consists of 37 students, and XI IPA 3 consists of 36 students. The last class is language class. It just consists of 17 students.
After the writer defined the population, sample was selected. Based on the data of the population above, the sample must be defined because the amount of the population is not reachable for the writer to conduct a research for the whole students.
3.3.2 Sample
When a writer conducts a research, he wants to examine the whole population. It can be possible when the population is reachable, but it is still extremely difficult to conduct such research. For that reason, the writer selected sample from the population to make the research practical. According to Best (1981: 89), “sample is a small proportion of population selected for observation and analysis.”
To make the sample more representative, the writer used purposive sampling technique. In this study, the writer chose two classes from eight classes of the eleventh grade students.
chance for language class to be the sample because there is no other class that is in the same condition. Secondly, the English scores from both XI IPA 2 and XI IPA 3 were based on the average scores of the eleventh grade students. The next step is the writer defined the control group and the experimental group. The control group was XI IPA 2 and the experimental group was XI IPA 3.
3.4
Method of Investigation
In this study, to get the data the writer followed some steps as follows:
(1) First, the writer chose two classes from the whole classes of the eleventh grade students in SMA N 2 Bae Kudus. XI IPA 3 class was as the experimental group and XI IPA 2 class was as the control group.
(2) After selecting the sample, the writer conducted a pre test of writing to the students for both the experimental group and control group. The test was the same for both two groups.
(3) The writer calculated the data from the pretest.
(4) The writer gave treatment which was the technique about tree diagram to the students in the experimental group and explained the use of tree diagram for writing.
(5) After giving the treatment for the experimental group, the writer conducted a posttest for both the experimental and control groups to measure the difference of the students’ achievements. Talking about the posttest, it was the same for both groups. However the posttest had a different topic with the pretest.
3.5
Type of Data
The data that were collected in this study are the references that are related to the subject matter, the pretest result and the posttest result. The data that were obtained from the test results were the mean of pretest and posttest. The type of data in this research is called quantitative data because it needs the calculation of the data in a form of statistical formula.
The data about theory of the study were collected from related literature whether they came from books, journals, articles, etc. The taken literature also came from library, web, and newspaper.
3.6
Instrument for Collecting Data
Instruments or tool for gathering data in research are of two categories or kinds: Treece and Treece in Hartoyo (2010) states that “mechanical devices and clerical tools. In this research, the instrument that is used is clerical tools. Clerical tools are used when the writer studies people and gathers data on the feelings, emotions, attitudes, and judgements of the subject.” For this study, the instrument consisted of the pretest and posttest of writing.
the same as the pretest, that was writing test. However, the topic was different. The criteria of assessment was also the same.
3.7
Method of Collecting Data
The collecting of the data was done by collecting the data of the students’ test results of writing, whether it was pretest or posttest, the measurement of central tendency (mean), and the documentation of the teaching learning process while the study was conducted.
3.7.1 Pretest
This test was used to measure the students’ ability of writing for both the experimental group and the control group before the experimental group got the technique of tree diagrams. The students were asked to make a short text about a certain topic. The genres were any kind of genre that the students have learned before.
After delivering the pretest, the writer analyzed the results. The score was used to get the measure of central tendency. Besides the measure of central tendency, the writer also analyzed the text made by the students. From the analysis, she decided which text was the appropriate text to be implied by using tree diagram technique. After the writer decided the chosen genre, the treatment was delivered.
3.7.2 Posttest
created for both the experimental and the control groups. As mentioned before, this posttest checked the students’ achievement of writing a certain genre. This posttest was the point to find out the difference between the control group and the experimental group.
3.8
Method of Analyzing the Data
When the writer finished with collecting the data, the next activity was analyzing the data. The data was analyzed by:
First, identifying the teacher’s method of using tree diagram as a means of teaching writing,
Second, identifying the students’ ability of writing before and after the tree diagram technique was given for the experimental group. The data were in
form of students’ scores. Based on the title of this study that is the effectiveness of tree diagram, at first the writer should determine how a text is called effective and vice versa. Based on that reason, she made a standard of evaluation. This was used
as criteria of scoring for the result of students’ writing.
In the journal Finishing Your Writing, error analysis of writing involves three steps: check for your grammar, vocabulary and spelling error patterns.
In this study, the writer used rubric of writing assessment that is adapted from Analytic Scale for Rating Composition Tasks (Brown & Balley 1984: 39-41) as stated in chapter two. The writer used the rubric because it gave
detail explanation for each aspect so that the writer could evaluate the students’
Then, the writer analyzed the results of the tests to find whether there is any difference before and after the tree diagram technique was given. In this case, the writer found the difference by seeing the mean from the pre-test and post-test. Finally she discussed the effectiveness of tree diagram as a means of teaching writing.
3.9
The t-Test
“A t-test is a statistical test that compares two means to determine the probability that the difference between the means is a real difference rather than a chance difference” (Tuckman 1978: 257). There are two forms of the t-test for comparing group means, one for independent samples and one for correlated samples. The independent sample t-test is used in situations in which the scores in one group have no logical relationship with the scores in the other group. The second form of t-test is the correlated samples t-test. It also refers to as the matched t-test, the correlated t-test, and the patred t-test. This t-test is appropriate for three situations in which each of the data observations in the first group is related to one of the scores in the second group. In this study, the t-test was used to know the difference means in result of teaching writing using tree diagram.
The formula that was used to find out the t-test value is stated below:
� = −
∑ 2− ∑ 2
+ −2
1
+ 1
Mx = means of the control group My = means of the experimental group ∑X2 = variance of the control group ∑Y2 = variance of the experimental group Nx = number of the students in control group Ny = number of the students in experimental group
CHAPTER IV
DATA ANALYSIS AND DISCUSSION
This chapter presents the results of the research based on the data analysis and the discussion of the research findings.
4.1
Research Finding
In this study, the writer found the results in form of students’ writing scores.
Those scores would be processed through statistical calculation. The detail analysis of the research finding will be presented below.
4.1.1 The Pretest and Posttest Analysis
The data were collected from the students’ result of writing a text. The writer
delivered a pretest and posttest for both the control group and experimental group. After delivering a pretest, the writer calculated the mean or average score for both the control group and the experimental group. The average score or the mean for the control group was 77.7, while the average score for the experimental group was 78.2. Here is the simple chart presentation from the pretest for both the control group and the experimental group.
Chart 4.1 The Average Score in Pretest for the Control Group and the Experimental Group
14 15 16 17
control group
experimental group
From the chart of the pretest, we can see that the results of the average score for both the control group and experimental group were almost the same. It can be said that the ability of writing of both two groups were at the same level. The result of the pretest of the control group can be seen in appendix 7 (p.71 ), while the result of the experimental group lies in appendix 9 (p.74 ).
After the writer conducted the posttest, she also calculated the average score from the test. The results of the average score for the control group was 82.3, while the average score of the experimental group was 88. At a glance, it can be seen that there was the difference result from the control group and the experimental group. Here is the chart that presents the result of the posttest for both two groups. The result of the posttest of the control group can be seen in appendix 8 (p.72 ), while the result of the experimental group lies in appendix 10 (p.75 ).
Chart 4.2 The Average Score in the Posttest for the Control Group and the Experimental Group
15,5 16 16,5 17 17,5 18 18,5
control group
From this result, it can be said that both groups’ ability of writing improved. It appears from the average scores. However, the control group and the experimental group have different level of achievement in writing.
From the data, the writer can conclude that the experimental group has higher achievement in writing than the control group. Here is the chart that presents the difference results from the control group and the experimental group.
Chart 4.3 The Average Score for the Pretest and the Posttest of the Control Group and the Experimental Group
4.1.2 The t-Test Analysis
In the previous explanation about the difference result from the control group and experimental group, the formula that was used to measure the significant difference of the pretest and the posttest was t-test. Thus, the writer compared the result of calculated t value with the t-table value. If the calculated t value is higher than t-table value, it can be concluded that the difference between the two means of the control group and experimental group is significant.
The formula to calculate t value for the means of the control group and the experimental group was the same with the formula that was used to calculate the t value for the pretest and posttest before. It is stated as follows:
75 80 85 90 95
pre test post test
control group
� = − ∑ 2− ∑ 2
+ −2
1
+ 1
Seeing from the displayed formula, to find out the calculated t value, there were some steps to go through.
First, the writer calculated the means for both two groups. The formula that was used to find out the mean was different from the common formula. The x is the difference score between the pretest and the posttest score. Moreover, x refers to the experimental group and y refers to the control group. The formula can be seen below:
= ∑
= ∑
The result was the mean for the control group (My) was 5.029, while the mean of the experimental group (Mx) was 10.088. The difference of the control group and the experimental group’s mean was 5.06.
Second, the writer calculated the total score for both two groups. The formula that was used to calculate the value is as follows:
∑ 2 = ∑ 2
− ∑
2
∑ 2 = ∑ 2
− ∑
2
From the formula given, the sum of the pretest and the posttest of the control group was 375, while the sum of the pretest and the posttest of the experimental group was 355.
The next step was the writer put all the scores of previous formulas in the t formula. In this study, the total respondents for both groups, the control group and the experimental group was 34. Therefore, after the writer put all the number, the calculated t value was defined. Here is the computation:
� = −
∑ 2+ ∑ 2
+ −2
1
+ 1
� = 10.088−5.029
34 + 34355 + 375−2 1
34+
1 34
� = 6.352
After the calculated t value was defined, the next activity that the writer did with the value was comparing the calculated t value with the t table value. For this study, the writer used α=5%. The two most common levels of significance are 1% and 5%. Because the 1% level requires a rarer and unlikely set of data than the 5%, so that the writer used the α=5%. Moreover, if the writer used the 1% level of significance, the difference between both groups means would have to be farther apart and it was rather difficult to analyze.
From the computation above, the t-table for df 66 with significant
α=5% is 1.998. The calculated t value for the t-test was 6,352. Based on the statement that the difference of means between two group is significant if the calculated t value is higher than the t table value, the writer can conclude that the difference of means between the control group and the experimental group is significant.
4.1.3 The Analysis of the Students’ Ability in General
From the experimental research, the writer was able to gain some statistical data that supported the objective of the study. The previous sub chapter presented the analysis of statistical data which was obtained from the research. Besides, the writer also analyzed the students’ ability of writing in general. It concludes the
analysis of students’ writing skill in pretest and posttest.
4.1.3.1. The Analysis of Students’ Writing Skill in Pretest
As the writer stated in the previous chapter of this final project, the study was started with delivering a pretest. After delivering the test, the analysis of the score
was defined. Besides, the analysis of the students’ writing ability was also done.
In the pretest, the students’ skill of writing was poor. The students
experienced difficulties. The first thing that came up to the writer’s mind was the
they produced many errors in their writing. Most of the students’ writing had
errors in grammar, their verbs, and spelling.
After delivering the pretest, the writer had a short conversation with the students about the difficulties they faced when they did the pretest. Many students answered that their first rea