INTERFACING OF MICROCONTROLLER TO CIRCULATOR USING EMBEDDED C PROGRAMMING IN DEVELOPMENT OF FIBER OPTIC
SURFACE ROUGHNESS MEASUREMENT USING TIME OF FLIGHT
ASHOK A/L RAJANDRAN
This Report Is Submitted In Partial Fulfillment Of Requirements For The Bachelor Degree of Electronic Engineering (Telecommunication)
Fakulti Kejuruteraan Elektronik Dan Kejuruteraan Komputer Universiti Teknikal Malaysia Melaka
UNIVERSTI TEKNIKAL MALAYSIA MELAKA
FAKULTI KEJURUTERAAN ELEKTRONIK DAN KEJURUTERAAN KOMPUTER
BORANG PENGESAHAN STATUS LAPORAN PROJEK SARJANA MUDA II
Tajuk Projek :
INTERFACING OF MICROCONTROLLER TO
CIRCULATOR USING EMBEDDED C PROGRAMMING IN DEVELOPMENT OF FIBER OPTIC SURFACE
ROUGHNESS MEASUREMENT USING TIME OF FLIGHT Sesi
Pengajian :
Saya ASHOK A/L RAJANDRAN
(HURUF BESAR)
mengaku membenarkan Laporan Projek Sarjana Muda ini disimpan di Perpustakaan dengan syarat-syarat kegunaan seperti berikut:
1. Laporan adalah hakmilik Universiti Teknikal Malaysia Melaka.
2. Perpustakaan dibenarkan membuat salinan untuk tujuan pengajian sahaja.
3. Perpustakaan dibenarkan membuat salinan laporan ini sebagai bahan pertukaran antara institusi pengajian tinggi.
4. Sila tandakan ( √ ) :
SULIT* *(Mengandungi maklumat yang berdarjah keselamatan atau kepentingan Malaysia seperti yang termaktub di dalam AKTA RAHSIA RASMI 1972)
TERHAD** **(Mengandungi maklumat terhad yang telah ditentukan oleh organisasi/badan di mana penyelidikan dijalankan)
TIDAK TERHAD
Disahkan oleh:
__________________________ ___________________________________
(TANDATANGAN PENULIS) (COP DAN TANDATANGAN PENYELIA)
I hereby declare that I have read this thesis of Ashok S/O Rajandran and found it satisfactory and can be accepted
“Hereby, the author declares that this project entitled Interfacing of microcontroller to circulator using embedded C programming in fiber optic roughness measuring
system using Time of Flight Technique is the result of my own work except for works that have been cited clearly in reference.”
ACKNOWLEDGEMENT
This project would not have been a success without the help and attention of many parties. I would like to take this opportunity to express my sincere gratitude to all those who have contributed in completing this project.
Firstly, I would like to express my appreciation to my final year project supervisor Engineer Zulkifli Bin Shariff for his expert supervision, patient guidance and constant attention throughout my final year project. It has been a privilege to work under such fine supervisory. His comments enabled me to produce a better quality performance in the project and the final report.
Secondly, I’m very grateful to my Industrial supervisor, Mr Syahrul Hisham from Significant Technologies, who was willing to spend his precious time in order to assist my final year project.
My special acknowledgement goes to the Faculty of Electronic and Computer Engineering for providing me with this wonderful opportunity to carry out the final year project. I was also exposed to do a proper research in order to get a clear idea on the selected topic.
Thank you very much to all the technical staffs in the Faculty of Electronic and Computer Engineering, especially, Puan Norlezah Hashim from the Communication Lab for her warmest helping hand. Not forgetting the lab technician of Communication Lab, Mr. Yusri, who helped and guided me throughout my project in using fiber optic.
studies. Finally, I wish to express my sincere thanks to all my friends for their cooperation, assistance, patience and thought that helped me to complete this project on time.
Thank you.
Sincerely,
ABSTRACT
ABSTRAK
CONTENTS
TITLE
DECLARATION
ACKNOWLEDGEMENT
Pages
i
iii
v
ABSTRACT vii ABSTRAK viii CONTENTS vi LIST OF FIGURES xi LIST OF TABLE xv CHAPTER 1 INTRODUCTION 1.1 History of Fiber Optic……….. 1
1.2 General View..……….……. 4
1.3 Objective of The Project……….…….…… 5
1.4 Scope of The Project……… 7
1.5 Research Methods……… 8
1.5.1 Literature Review and Study………. 9
1.5.2 Software System Description and Design… 9 1.5.3 Circuit Fabrication and Testing………. 10
1.5.4 Complete Design and Test……… 10
CHAPTER 2 LITERATURE REVIEW
2.1 Roughness of surfaces………. 12
2.1.1 Description of Surface Roughness……… 12
2.1.2 Effects of Surface Roughness………... 14
2.1.3 Definition and Parameters………. 17
2.2 Importance of surface roughness……….. 19
2.3 Time of Flight Technique…...……….. 20
2.4 Application of Time of Flight Technique………... 2.5 Advantage of Time of Flight Technique……….. 21 22 CHAPTER 3 METHODOLOGY 3.1 Development of Software (Interfacing)………... 3.1.1 Embedded System………... 3.1.2 Programming………... 3.1.2.1 Configuration………. 3.1.2.2 Input and Output……… 3.1.2.3 Interrupt……….. 3.1.2.4 UART………. 3.1.2.5 Complete Programming……….. 25 27 27 28 28 29 30 31
3.2 Optical Fibers………... 33
3.2.1 Optical Fibers Constructions………. 34
3.2.2 Types of Optical Fibers………. 38
3.2.3 Advantages of Optical Fiber………. 41
Optical Fibers……… 43
3.2.6 General Uses of Optical Fibers………. 45
3.3 Optical Fibers used in testing……….. 46
3.3.1 Stripping Optical Fibers……… 46
3.3.2 Polishing Optical Fibers……… 47
3.3.3 Testing Attenuation of Optical Fibers………... 47
3.4 Design of circuits………. 50
3.4.1 PCB layout 2-D………. 51
3.4.2 PCB layout 3-D………. 51
3.5 Output Measurements……….. 52
3.6 Implementation on PCB………... 52
CHAPTER 4 RESULTS AND DISCUSSION 4.1 Complete Circuit with Transmitter and Receiver…… 53
4.2 System testing to obtain best displacement………….. 55
4.2.1 Steps taken………. 55
4.2.2 Results Obtained………... 55
4.2.3 Explanation for Results Obtained………. 58
4.3 System testing with Lights switched on………... 59
4.3.1 System testing without any additional surfaces 59 4.3.1.1 Steps taken………... 59
4.3.1.2 Results Obtained………. 60
4.3.1.3 Explanation for Results Obtained……... 61
4.3.2 System testing with copper plate……….. 62
4.3.2.2 Results Obtained………. 62 4.3.2.3 Explanation for Results Obtained……... 64 4.3.3 System testing with plastic……… 66 4.3.3.1 Steps taken……….. 66 4.3.3.2 Results Obtained………. 67 4.3.3.3 Explanation for Results Obtained……... 68 4.3.4 System testing with thickness gauge…………. 70 4.3.4.1 Steps taken………... 70 4.3.4.2 Results Obtained………. 70 4.3.4.3 Explanation for Results Obtained……... 74 4.7 Overall Discussion………... 76
CHAPTER 5 CONCLUSION AND SUGGESTION
5.1 Project Overall View……… 77 5.2 Future Prospect of The Project………. 78
CHAPTER 6
5.3 Suggestions………...
REFERENCE………...
80
81
LIST OF FIGURES
NO TITLE PAGE
1.1 Structure of Fiber Optic 2
1.2 Growth in fiber transmission capacity 4
1.3 Overall flow of the project 8
2.1 A cross section through a surface where a mean line that is parallel to the general surface direction is found to calculate Ra
14
2.2 Texture surface showing the roughness and waviness 16 2.3 Graphical Description of Rt, Rp, and Rm 17
2.4 Profile Height Distribution p(z) 18
3.1 Flow chart of overall methodology 24
3.2 64 bit PIC24FJ128GA 25
3.3 MPLAB IDEv8.50 software 26
3.4 Embedded System 27
3.5 Construction of a typical fiber optic 34
3.6 Optical cable construction 35
3.7 Single mode, Step-index multimode, Graded-index multimode 41
3.8 Optical fiber used 46
3.9 Equipment used 47
3.10 Liquid solution and sheet papers 48
3.11 Inspection microscope 48
3.12 Fiber optic test set 49
3.13 Schematic diagram of transceiver circuit 50
3.15 PCB layout 3-D view 51 4.12 Transceiver circuit together with single mode fiber 54 4.13 Completehardware and software for testing where output is
observed at the oscilloscope to compare smooth and rough surface.
54
4.2 Displacement of the fiber to the surface of the stationary steel 55 4.3 Graph of average output voltage versus thickness 58 4.4 Average Output Voltages on smooth surface 61
4.5 Average Output voltage, V on smooth areas of copper plate 64 4.6 Output of smooth surface observed from oscilloscope 64 4.7 Voltage variation of rough copper surface 65 4.8 Output of rough surface observed from oscilloscope 65 4.9 Average output voltage,V on smooth plastic surface 68 5.0 Average output voltage,V on rough plastic surface 69 5.1 Average Output Voltage for different thickness measurement 75 5.2 System used to measure surface roughness with optical fibers
perpendicular with the target surface.
79
LIST OF TABLES
NO TITLE PAGE
1.0 Application of Time of Flight 22
4.1 The displacements versus average value of output voltage 56
4.2 Output voltage at different places on the smooth surface of the stationary steel.
60
4.3 Output voltage at different places on the smooth surface of the copper plate
63
4.4 Output voltage at different places on the rough surface of the copper plate
63
4.5 Output voltage at different places on the smooth surface of the plastic
67
4.6 Output voltage at different places on the rough surface of the plastic
67
4.7 Output voltage for surface with 0.05mm thickness 71
4.8 Output voltage for surface with 0.10mm thickness 71 4.9 Output voltage for surface with 0.15mm thickness 71
4.13 Output voltage for surface with 0.50mm thickness 73 4.14 Output voltage for surface with 0.60mm thickness 73 4.15 Output voltage for surface with 0.70mm thickness 74 4.16 Output voltage for surface with 0.80mm thickness 74 4.24 The difference in the measured output voltage for both the
conditions on copper plate
77
4.25 The difference in the measured output voltage for both the conditions on transparent plastic
77
CHAPTER 1
INTRODUCTION
1.1History of Fiber Optic
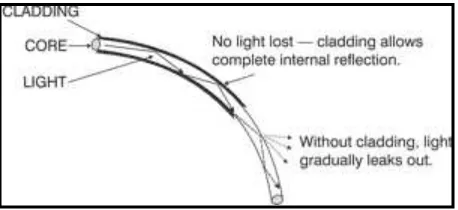
Early success came during the 1950‟s with the development of the fiberscope. In 1956, Narinder Kapany was the first one who coined the term “fiber optics”. Glass fibers that included a separate glass coating were developed by the scientists to reduce the loss in the fiber optics. The core (innermost region of the fiber) was used to transmit the light, while the cladding (glass coating) prevented the light from leaking out of the core. The light will be reflected within the boundaries of the core. This concept was explained by Snell‟s Law which states that the angle at the light reflected depends on the refractive indices of the two materials; the core and cladding. The lower refractive index of the cladding with respect to the core causes the light to be angled back into the core. This is illustrated in Figure 1.1.
Figure 1.1: Structure of fiber optic (David, 2002)
In 1970, glass researchers; Drs. Robert Maurer, Donald Keck, and Peter Schultz from Corning succeeded in developing a purest glass fiber. This fiber exhibited attenuation at less than 20dB/km, which is the threshold for making fiber optics a viable technology. This can be summarized that the optical power that reached the receiver is only 1/100th of the one transmitted. (David, 2002)
Fiber optics developed over the years in a series of generations that can be closely tied to wavelength. The earliest fiber optic systems were called “first window” and developed at an operating wavelength of about 850 nm in a silica-based optical fiber. This window refers to a wavelength region that offers low optical loss. The first window became less attractive as the technology progressed because of its high relatively 3dB/km loss. Most companies jumped to the “second window” at 1310 nm with lower attenuation about 0.5dB/km. Nippon Telegraph and Telephone (NTT) developed the “third window” at 1550 nm in 1977 which offered the theoretical minimum optical loss for silica-based fibers, about 0.2dB/km. A “fourth window,” nearly 1625 nm is being developed with its loss not lower than the “third window”. The loss is comparable and it might simplify some of the complexities of long-length multiple-wavelength communications systems. (David, 2002)
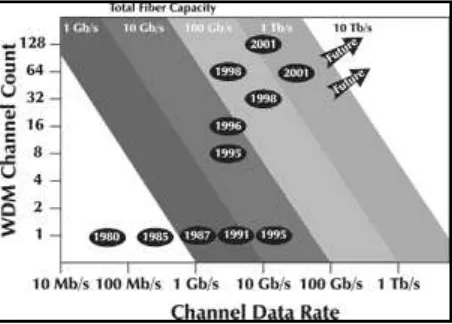
amplifier (EDFA) that allowed the light wave to maintain its shape and density. In 1998, the researchers did a better work by transmitting 100 simultaneous optical signals with each at a data rate of 10 gigabits per second for a distance of nearly 400 km. Figure 1.2 shows the growth of optical fiber transmission capacity which has grown by a factor of 200 in the last decade. (David, 2002)
[image:20.612.215.441.195.357.2]The Twenty-First Century and Beyond
Figure 1.2: Growth in fiber transmission capacity (David, 2002)
There are extraordinary possibilities for future fiber optic applications because of the fiber optic technology‟s immense potential bandwidth. The idea to bring broadband services, including data, audio, and especially video into the home applicants is well underway. In today‟s world more than 80% of the world's long-distance voice and data traffic is carried over optical-fiber cables. (David, 2002)
1.2General View
chemical deposition, grinding, polishing, etching or several other commonly used techniques. Correct function of the fabricated component often is critically dependent on its degree of roughness.
The surface roughness of an object can be measured either mechanically or optically. Mechanical devices based on the profilometer principle are expensive, can be unreliable in certain applications, and require physical contact with the surface of interest. The surface damage that may result can corrupt the measurement data. Noncontact optical techniques eliminate the problems of surface damage and inaccurate data, but they require very precise optical elements that must be realigned continually. (Sensors Magazine Online - April 1999) However, this method is far cheaper compared to the some other methods. Therefore through this project, noncontact method of measuring roughness of a surface can be found and this can be applied in our industry as it might reduce the production cost.
1.3Objective of The Project
There are few objectives that were outlined for the purpose of this project. They are as follows:
ii. The intrinsic objective of this FYP is to develop an interfacing between a micro-controller to circulator using embedded C programming for development of roughness measuring system using Time of Flight technique (ToF). The objective of this FYP is also to analyze and understand the development of roughness measuring system via Time of Flight technique.
iii. The objective of the present study is to develop a programme which will interface the software and the hardware which is circuit designation. Other than that, it is concerned in studying the history and theory of fiber optics and Time of Flight technique..The literature review of this project enlightens me with new methods of measuring surface roughness where new method of ToF is implemented and interfacing is being done.
1.4Scope of The Project
Firstly, there are many applications using fiber optic, which is implemented in industry, medical, security, telecommunication, submarine, laboratory fields, decorative purposes and others. In this project, fiber optics is used as transmitting and receiving light to and from targeted surface to measure the roughness of it and interfacing from micro-controller to circulator with embedded C programming to show the result and simulation. The scope of the project covers the software development of the fiber optic roughness measuring system. It will cover the interfacing of software to hardware and as well as simulation of this project. However, the scope of my project will not cover the hardware designing of the circuits.
1.5Research Methods
Briefing & Discussion with lecturer
Survey & Literature Review
Application study on measuring roughness system using fiber optic
technique
Development of software to study
Circuit testing & Analysis
Interfacing of software to hardware
Modification of hardware system & software for compatible
Testing & reading
Data collection & analysis
Figure 1.3: Overall flow of the project
Proposal
Progress Report
Final report Understanding
project
Design