SUSTAINABLE
BIOPRODUCTION
E
2011
VUTSRQPONMLKJIHGFEDCBAS e p t e m b e r 1 9 - 2 3 , 2 0 1 1
I
T o w e r H a l l F u n a b o r iI
T o k y o , J A P A NwvutsrqponmlkjihgfedcbaZYXWVUTSRQPONMLKJIHGFEDCBAGrowing uncertainty over the future status of water, energy and food resources in light of the
devastating scenario of global warming has led the world to strive to seek solutions for the
perennial de" elopment of humankind.
Recent developments in biomass technology have raised
the unexpected issue of the crop resource trade-off between energy crops, feed crops and food
crops. CIGR has been dedicated to developing world water resources, to modernizing world food
production and to conserving our environment with the commitment of agricultural engineers and
scientists from CIGR member nations. The challenge currently faced bv us for the coexistence of
humankind throughout the world is to find a method to balance our resource utilizati on and
energy development; this task might well be termed as a CIGR mission.
In the year 2011, all engineers, scientists and affiliates from 7 technical sections of CIGR will
meet in Tokyo to discuss the updated controversial issues on water, energy and food along with
the latest technological development that the world would seek.
I
ABOUT THE
SYMPOSIUM
XWVUTSRQPONMLKJIHGFEDCBAI
The 2011 CIGR International Symposium on
" S u s t a i n a b l e B i o p r o d u c t i o n - W a t e r , E n e r g y , a n d F o o d " , S e p t e m b e r 1 9 - 2 3 , T o w e r H a l l F u n a b o r i , T o k y o , J A P A Nwill bring together
researchers and professionals
interested in new ideas, engineering, and technologies used in
Sustainable bioproduction systems. Attendees will be able to share ideas, theories, techniques,
challenges, and concerns with peers and expand their professional networks worldwide. They will
also have the opportunity to attend many joint activities. The symposium is open to researchers
and engineers from all over the world as well as general publics those who are interested in the
global issues with water, energy, and food.
ISPONSOR I
S C J
(Science Council of Japan),
J A I C A B E(Japan Association of International Committee of
Agricultural and Biosystems Engineering) and
C I G RIORGANIZATIONS
I
ZYXWVUTSRQPONMLKJIHGFEDCBAI n te r n a tio n a l P r o g r a m C o m m itte e ( I P C )
Chair: Prof. H. Murase, Vice Chair: Prof. S. Li, and Prof. N. Noguchi
Secretary: Prof. H. Shimizu
Chairs of CIGR Section Board I to VII
N a tio n a l O r g a n iz in g C o m m itte e ( N O C )
SUSTAINABLE
BIOPRODUCTION
E
20
VUTSRQPONMLKJIHGFEDCBAS e p t e m b e r 1 9 - 2 3 , 2 0 1 1
I
T o w e r H a l l F u n a b o r iI
T o k y o , J A P A NLL
0
P PERS
I
A b s t r a c t S u b m i s s i o n F o r m I m p o r t a n t D a t e s :
S u b m i s s i o n o f a b s t r a c t : J u l y 1 , 2 0 1 0
o t i f i c a t i o n o f a c c e p t a n c e : A u g u s t 1 , 2 0 1 0 I n i t i a l m a n u s c r i p t s u b m i s s i o n : A p r i l 1 , 2 0 1 1
C r i t i q u e d m a n u s c r i p t r e t u r n e d t o a u t h o r s : J u n e 1 , 2 0 1 1 F i n a l c a m e r a - r e a d y m a n u s c r i p t s u b m i s s i o n : J u l y 1 , 2 0 1 1 E a r l y r e g i s t r a t i o n d u e : J u l y 1 , 2 0 1 1
R e g i s t r a t i o n d u e : A u g u s t 1 , 2 0 1 1wvutsrqponmlkjihgfedcbaZYXWVUTSRQPONMLKJIHGFEDCBA Authors are invited to submit a paper targeting one of the main topics: 1) Evaluation, Investigation and Utilization of Agricultural Productive Environment for Sustainable Bioproduction, 2) Increment of Safety, Security and High Quality of Food Production necessitated for Humankind, and 3) Environmental Preservation for Agricultural Production on Water and Energy. The paper should describe original work, including methods, techniques. prototypes. applications, systems and tools, reporting research results, and/or indicating future research and development directions.
W h a t t o d o : Submit an abstract limited to 500 words, including the title of the paper. List the names and affiliated organizations of all authors in the abstract. The abstract should be self-contained. concise. and informative.
It
should describe the research objectives, methods used. and the major findings.One of the authors will present the accepted paper during the workshop, and the paper will be printed in a preprint of the workshop. A few selected papers will be submitted to an CIGR Ejournal or the Journal Computers and Electronics in Agriculture based on the relevancy of research reported to be considered for publication as a peer - reviewed article. Selection will be based on the quality. relevance. and originality of the submitted paper.
http.z/www.cigrzu l l.org/XWVUTSRQPONMLKJIHGFEDCBA
I
REGISTRATION
I
Participants are encouraged to take advantage of early bird registration by completing a
R e g i s t r a t i o n F o r m and paying lower registration fees on line. Or they can register on site paying the standard registration fees. The registration fees are calculated in JP Yen.
C o n t a c t t o :
2 2 B 0 8
wvutsrqponmlkjihgfedcbaZYXWVUTSRQPONMLKJIHGFEDCBAField
etwork System to Monitor
Paddy Fields in the System of
Rice Intensification
in Indonesia
Chusnul Arif*, Budi I Setiawan**, Masaru Mizoguchi*, Ryoichi Doi*, Satyanto K Saptomo**, Ardiansyah***, Tetsu Ito*DCBA
*ZYXWVUTSRQPONMLKJIHGFEDCBAD e p a r tm e n t o f G to b a l A g r ic u ltu r a l S c ie n c e s , tile U n iv e r s ity o f T o k y o , J A P A N ( e - m a il: d lu s n u la r e a ·r a llO o .c o m .a m iZ o ( ( L ) 1 la il.e c c .lI - to k F O . a c .jp ; a r o ir d ( tlm a il.e c c .lI - to k l'o .a c .jp :
te ts lI ( iV ja i.g a .a .lI - to k l'o .a c .jp )XWVUTSRQPONMLKJIHGFEDCBA
* * D e p a r tm e n t 0 /C iv il a n d E n v ir o n m e n ta l E n g in e e r in g , B o g o r A g r ic u ltu r a l U n iv e r s ity , I N D O N E S I A ( e - m a il: b u d ifl( lr a ( a ; .ip b .lI c .id ; d d o d l.( a .l.lI llO o .c o m )
* * * D e p a r tm e n t 0 /A g r ic u ltu r a l E n g in e e r in g , J e n d e ra l S o e d ir m a n U n iv e rs ity , I N D O N E S I A
( e - m a il: a r d i.p I K a ,g m a il.c o m )
Corresponding Author:
Department of Global Agricultural Sciences 1-1-1 Yayoi, Bunkyo-ku, Tokyo 113-8657, Japan Phone: +81-3-5841-1606
Email: [email protected]
Abstract: The current study was performed for establishing a field network system (FNS) to monitor paddy fields in the System of Rice Intensification (SRI) environment in Nagrak Organics SRI Center, Sukabumi, Indonesia. FNS works as a remote monitoring system which field router equipped with an in situ camera and connected to meteorological and soil data loggers. Changes in soil conditions (moisture, electrical conductivity and temperature) and meteorological parameters were measured and monitored at intervals of 30 minutes. Then, the data and plant image were daily transmitted to a remote server by means of the Global System for Mobile communication (GSM) with the help of a newly developed field router. All data were made accessible online at http://emsa-sri.org as images in addition to numeric and graphic data. There were four experimental plots with different water management regimes; continuously saturated soil (CSS) in the first plot, incompletely saturated soil (ISS) in the second plot, moderate soil drying (MSD) in the third plot and severe soil drying (SSD) in the fourth plot. In the CSS regime, the soil was kept saturated or at water levels -5 to 0 cm depth as recommended by SRI training center in Indonesia; while for ISS regime, the soil was kept drier than the CSS regime at water levels of -15 to -5 cm depth. Moderate soil drying was applied at water levels of -30 to -5 cm depth in the MSD regime and the last regime (SSD regime), severe soil drying was applied at water levels -60 to -10 cm depth particularly from 70 day after transplanting. Based on the findings of the experiment along a single crop season, the FNS run well and was reliable in the monitoring of the plants, meteorological and soil parameters. However, stability of the field router depends on the field solar power supply and the Internet connection. In case there is problem in the Internet connection within data transmitting time, the images data were lost. The images data showed the series of SRI plant growth from a tiny seedling to a large cover area and facilitating evaluation of each growth stage. With the numeric data, the water productivity could be well determined and the values were 1.95, 2.0 I, 1.51 and 2.04 kg/m' for CSS, ISS, MSD and SSD regimes, respectively. In addition, the evaluation of water management regimes revealed that in the CSS and MSD regimes, the soil should be more saturated to gain more yield and water productivity particularly in the early stage to the crop development stage as occurred in the ISS and SSD regimes.
K e y w o r d s : S y s te m o f R ic e in te n s ific a tio n , E n v ir o n m e n ta l P a r a m e te r s . ir r ig a tio n s y s te m , F ie /d
1. INTRODUCTIO
The challenges to raising rice productivity in
Indonesia have been increasing due to the increased population and reduced arable area. In addition, climate changes have been affecting paddy irrigation water requirements during the rainy and dry seasons
(De SilvaZYXWVUTSRQPONMLKJIHGFEDCBAe t a l. 2007). Therefore, the System of Rice
Intensification (SRI) is proposed as an alternative cultivation method with more efficient input by providing suitable growing conditions in the root zone. The basic concepts are single planting with younger seedlings (7-14 days after seeding), wider spacing between transplanted seedlings, application of intermittent irrigation, organic fertilizer and very
active soil aeration (Uphoff and Kassam 2008;
Stoope tDCBAaJ. 2 0 0 2 ) .
Since introduced in 1999 dry season by the Agency
for Agricultural Research and Development
(AARD) in Indonesia, the SRI cultivation has been widespread in some areas through several programs. By adopting alternate wetting and drying irrigation (AWDI), the water use can be reduced up to 40%
(Satoe t a l. 2011; Sato and Uphoff 2007). However,
there were some limitations in disseminating the SRI cultivation system in Indonesia, such as irrigation
management and water control (Gani e ta l. 2 0 0 2 ) .
Further investigation focusing on the water
productivity by fmding the optimal irrigation regime is needed. Precise data sets on rice field environment
such as soil and meteorological data through
continuous measurements are vital for this purpose. A demonstration study on information technology
(IT) field monitoring for rice field in SRI
environments in Japan has been conducted
(Manzano e t a l. 2010). However, the study was
limited only to the demonstration of the
functionality of the IT monitoring system.
The current study aimed at establishing a new hybrid
monitoring system, called field network system
(FNS), to monitor paddy field's conditions under
SRI environments in Indonesia with different water
management regimes. Then, evaluation of water
productivity was performed to compare the
irrigation regimes.
2. MATERIALS AND METHODS
A field monitoring system was set up under natural environment in the Nagrak Organics SRI Center (NOSC), Sukabumi West Java, Indonesia during the
first rice season 2 0 1 0 1 2 0 1 1 (October 2010 to
Februari 2011, wet season). The field is located at 06°50'43" Sand 106°48'20" E, at an altitude 536 m above mean sea level.
SRI cultivation practices
Each experimental plot was a 4 m x 4 m rectangular shape. All plots were planted with the local variety
of rice ( O r y z a s a l i v a L), Sintanur, a hybrid rice
variety suitable for SRI. The elements of SRI
practices were; single planting of young seedling (5 days after seedling) spaced at 30cm x 30cm, using
an organic fertilizer at 1 kg/nr' on the land
preparation and no chemical fertilizer. Moreover, to
enhance biological activity in the soils, local
indigenous microorganisms (IMO) were supplied to the field 10, 20, 30 and 40 days after transplanting (DA T) accompanied with to weeding process.
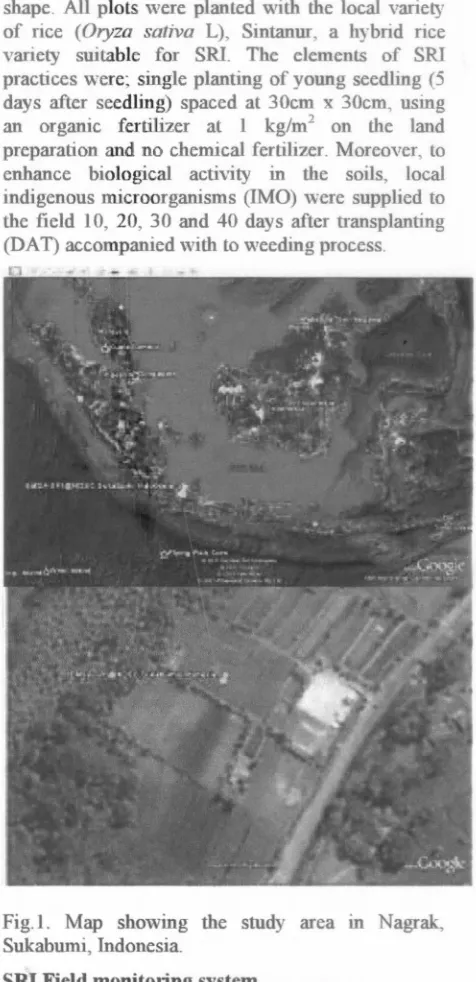
Fig.I. Map showing the study area m Nagrak,
Sukabumi, Indonesia.
SRI Field monitoring system
We prepared a hybrid remote monitoring system, called field network system (FNS), having a field
router equipped with an in situ camera and
[image:5.563.278.516.167.658.2]0 5 0 0
-: -: t - 1 " ' " 1 - - 1 " - - ; - 1 " ' " 1 - - I " - - - I r - - - r l - - ; - + - - - + 1 - - - 1 1• . . . • .1
o 2 JwvutsrqponmlkjihgfedcbaZYXWVUTSRQPONMLKJIHGFEDCBA40 B J 8 0 tO O
D a y s a f t a '" t:ra1spIcrtirg ( d a y )
SJf
1006 ~ 1SJn
~
M ' O . « D 2 J Oa::
~ om ..•... ~DCBA_ l 21JEDCBA
E~·OOh~==============~~
. . . " O B e £ ).•..
C 0700
~ 0.600
8 O s a J - .- .- - - .- - - .- - .- • • • • • • • • • .
-Gi 0.400
l
0 3 0 0U 0700
: s O.Wl __~_:u!· ~[~IJ! _
~ 0 5 0 0 - - - • • - - • • • - • • •
-::l 0.400 ..•..••.. ...J
>
o---~
0700r-~---~
OWlPld4: SS) r a j r r e
•.••.•...
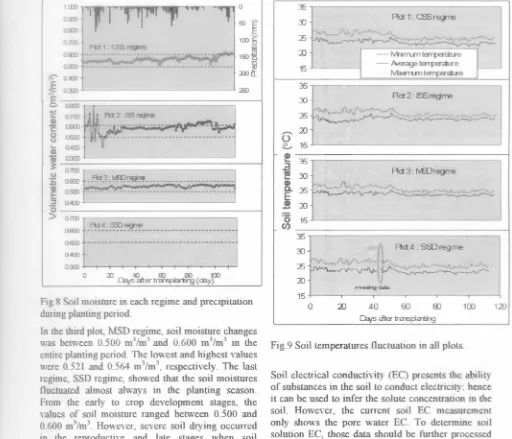
_---Fig.8 Soil moisture in each regime and precipitation during planting period.
In the third plot, MSD regime, soil moisture changes was between 0.500ZYXWVUTSRQPONMLKJIHGFEDCBAm3/m3 and 0.600 m3/m3 in the entire planting period. The lowest and highest values were 0.521 and 0.564 m3/m3, respectively. The last
regime, SSD regime, showed that the soil moistures fluctuated almost always in the planting season. From the early to crop development stages, the values of soil moisture ranged between 0.500 and
0 .6 0 0 m3/m3. However, severe soil drying occurred
in the reproductive and late stages when soil cracking developed at the soil moisture of 0.320
m3/m3.
Soil temperature trends were comparable among all plots as shown in Fig.9. The soil temperatures' trends were high until the plant age reached to 50 DAT (October-November 2010) and then decreased during December 2010 to 1 February 2011. The highest soil temperature of 35.
rc
was observed on 13 November 2010 in the second regime. On the other hand, the lowest value was 22.0°C in the first and fourth plots. However, there were missing data in the fourth plot on 43 and 44 DAT (26 and 27 November 2010) since the soil sensor cable was unplugged from the soil data logger when checking the sensor. This condition was identified after data uploaded to the server.35
3 J Ad: 1.
a::s
regneA...A
':::.
-2S ~ = v >
-•..•••...
~ zi --lVhrrunterTfl€Fcble
15 -- ~taTpercnJre
~ tffi1'EJ"3lre
I
-35
:D Rct2· lffiregme
25 ~ ~ .,.~ ~, ,... : ; D
o
015
' - "
ID
•.. 35
:::I
"tU :D A c t 3 :tvIDregme
•..
CD
~ ~ ~
a. 25 A... •.•••••••••••••••• y
-
"~
-
: ; D· 0 15
Cl) 35
:D
~ I I
Rd. ,S3)"9~25 i/ V U v \' - - ' ~~-V-~A ~"v.
~ ..•.•. ~
: ; D
nissng data
15
0 : ; D 40 60 g ) 100 120 ca,.s e f t a '"tra1spa"ti1g
Fig.9 Soil temperatures fluctuation in all plots.
Soil electrical conductivity (EC) presents the ability of substances in the soil to conduct electricity hence it can be used to infer the solute concentration in the soiL However, the current soil EC measurement only shows the pore water EC. To determine soil solution EC, those data should be further processed by using soil moisture data and soil bulk density (Hilhorst, 2000) and the results present in Fig. 10.
-~0.1ID
U ,
: E . 0 . 6 0 0t----~"'"--- r - r - _ _ ~ I
td
C 0.«D~~-~--~~1r_~~~~ o
~ ~ Q 2 ! J )
~ o.OCD+--~-~-_--T--~-~
o 20 «l 60 s o 100 120
[image:6.563.9.521.73.512.2]Da}'Safter"1J"ar'sPar1irg
Fig. 10 Soil solution EC fluctuation in all plots.
Converting soil EC values to the soil solution EC result the lower values than before. Here, we assumed the mineral density to be 2.65 Mg/m3
.
[image:6.563.280.504.547.664.2]60EDCBA
---~--_r
1002S
20XWVUTSRQPONMLKJIHGFEDCBA
[image:7.562.10.272.61.741.2]o 100
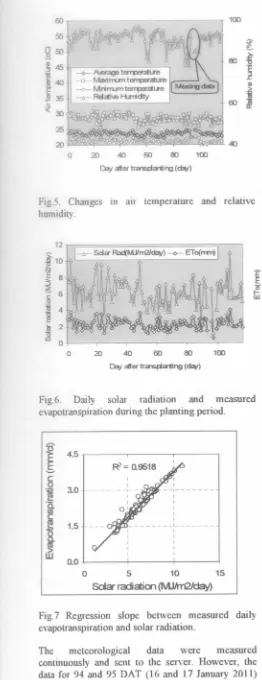
Fig.5. Changes humidity.
ID air temperature and relativeDCBA
4 .5ZYXWVUTSRQPONMLKJIHGFEDCBA~ - - ~ - - - r - - - - '
3..0
S d a -~MJlm2Iday) - < > - E T o ( r r m )
I
620 100
Fig.6. Daily solar radiation and measured
evapotranspirationduring the planting period.
I I - - 1 - - -
-I I I I I
- - -- - -- _1- _
I I
I I
I I
I I
I I
0.0 I I
o 5 10 15
Sda"r a d i a i c r l(MJlm2lday)
1.5
Fig.7 Regression slope between measured daily evapotranspirationand solar radiation.
The meteorological data were measured
continuously and sent to the server. However, the data for 94 and 95 DAT (16 and 17 January 2011)
were lost due to battery depletion of the Davis console. The data trend of air temperature was found to be contrasting to those of relative humidity (Fig.5). The maximum, average and minimum air temperatures were 31.9°C, 23.6°C, and 19SC, respectively. Meanwhile, the maximum, average and minimum values of relative humidity were 97%, 91% and 78%, respectively.
On the other hand, the solar radiation data had a
positive correlation to the measured
evapotranspiration (Fig.7) 'with the coefficient
determination (R2) of 0.9518. The maximum value of solar radiation was 11.0 MJ/m2/day on the 31 January 2011 when the age of plant was 109 DAT. Also, the maximum measured evapotranspiration was reached to 4.0 mm/day on tins day. On the other
hand, the minimum solar radiation was 1.2
MJ/m2/day and the minimum measured
evapotranspiration was 0.6 mm/day on the 19 January 2011. During the planting period, the
averages of solar radiation and measured
f
evapotranspiration were 6.2 MJ/m2/day an 2.3~ mm/day, respectively.
S o il p a r a m e te r s
Fig.8 shows soil moisture variation and ram
precipitation in each regime during the planting
period. We observedheavy precipitation particularly
in the early (0-20 DAT), crop development and
reproductive stages (40-80 DAT). Heavy
precipitation in the early stage resulted in great changes in soil moisture in the second and fourth plots (Fig.8). However, soil moisture levels for the first and third plots were relatively constant at this moment since the rainwater was drained rapidly. The total rain precipitation during the planting
period was 1331.8 mm and the highest daily
precipitation was 75.2 mm/day (24 October 2010).
Soil moisture at the CSS regime in the first plot was
stabile in the early stage; 0.552 m3/m3
, and then
dropped to approximately 0.522 m3/m3 in the
vegetative stage. However, in the late stage, it
increased and reached to 0.608 m3/m3.
Soil moisture at the ISS regime in the second plot showed the drier soil condition than the CSS regime
only in the end of the early stage at 0.405 m3/m3
3. RESULTS
SRI information system website
All mformation on SRI field monitoring of the current study could be easily accessed through hup· l!emsa-sn.org.
E.1XWVUTSRQPONMLKJIHGFEDCBAA
-Fig.3. SRI field monitoring website.
We called the website asZYXWVUTSRQPONMLKJIHGFEDCBA" a n E n v ir o n m e n ta l
M o n ito r in g S y s te m o n th e A d v a n c e m e n t o f th e S y s te m o f R ic e I n te n s ific a tio n " (EMSA-SRI). We can choosenumeric and graphic data on the soil and meteorological parameters as well as plant image
data from theE M S A - S R J s ite menu. Moreover, the
website was equipped with others items related to
the research such asA b o u t E M S A - S R J , R e s e a r c h e r s ,
N e w s a n d e v e n t andA r tic le s . A b o u t E M S A - S R J item describes the concept of the current monitoring and
the instruments to be used. R e s e a r c h e r s item
containsthe list of researchers team, whileN e w s a n d
e v e n titem informs the news related to SRI and the
attended international conferences. A r tic le s item
containsarticles written by the researchers.
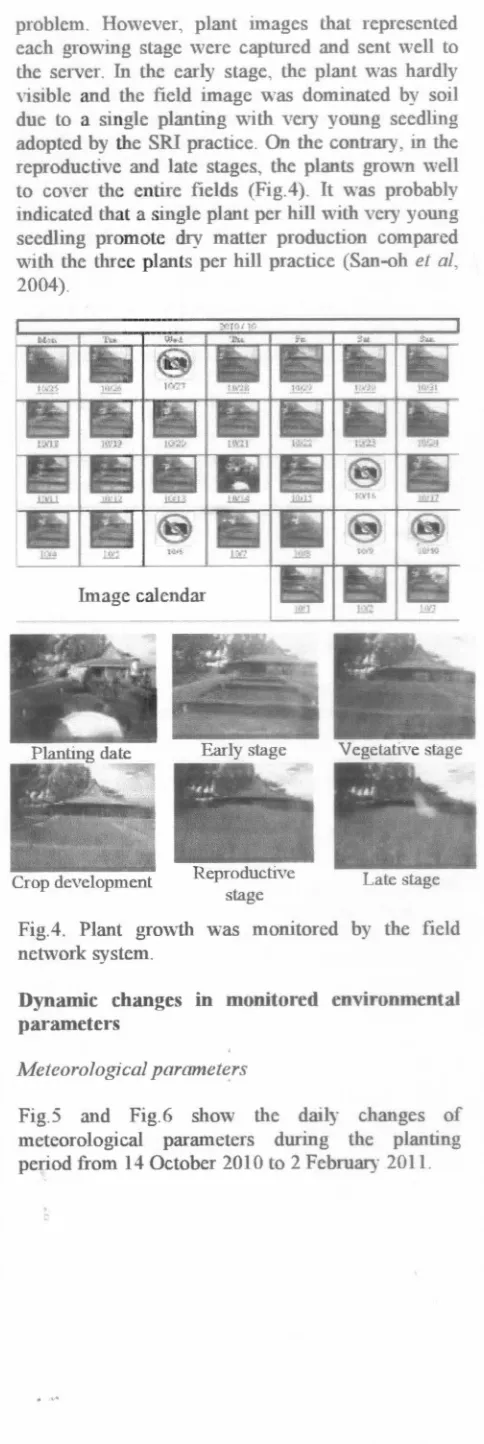
Plant growth monitoring
Daily plant image was sent by field router through GSM network to the server. It was presented as a single image as shown in Fig.3. To see the overview of the plant images during the planting period, an image calendar was available (Fig.4). As an example in October 2010, there were 5 plant images failed being sent to the server due to the GSM network
problem. However, plant images that represented each growing stage were captured and sent well to the server. In the early stage, the plant was hardly visible and the field image was dominated bv soil due to a single planting with very young seedling adopted by the SRI practice. On the contrary, in the reproductive and late stages, the plants grown well to cover the entire fields (Fig.4). It was probably indicated that a single plant per hill with very young seedling promote dry matter production compared
with the three plants per hill practice (San-ohe t a l,
2004).
Vegetative stage
[image:8.562.271.513.65.787.2]Crop development Late stage
Fig.4. Plant growth was monitored by the field network system.
Dynamic changes in monitored environmental
parameters
M e te o r o lo g ic a l p a r a m e te r s
Fig.S and Fig.6 show the daily changes of
meteorological parameters during the planting
used to collect meteorological data such as solar radiation, air temperature, humidity, wind speed and direction and precipitation. Its console was connected to the field router by using Bluetooth connection. In the soil layer, soil moisture sensors (5TE: soil moisture, temperature, electrical conductivity), developed by Decagon Devices, Inc., USA, were installed at the lO-cm depths from the top of soil in each plot and then were connected to an Em50 data loggers by using cable (Fig 2).
Every sensor was set up to measure soil and meteorological paramete s every 30 minutes. Then, the data were stored in each data logger. The field router was set to automatically work from 12.00 to 12.30 PM regulated by a timer to collect the data from the both data loggers, and then to send the data as well as plant image to the data server through the GSM connection. Users could easily obtain the data by accessing our SRI observation website.
Fig.2. FNS remote monitoring in SRI paddy field.
Water management
Experimental plots were irrigated under different management regimes as enlisted in Table L
Table 1. Water management regimes in the fields
Irrigation Watermanagementregimes
regime
Continuous Soil was kept saturated or at water saturated soil levels -5 to 0 cm depth during planting
(CSS) period as recommended by the SRI
trainingcenter in Indonesia
Incompletely Soil was kept drier than the CSS saturated soil regime at water levels of -IS to -5 cm. (lSS)
Moderate soil Moderate soil drying was applied at <hying(MSD) water levels of -30 to -5 cm depth Severe soil Severe soil <hyingwas applied at water drying(SSD) levels -60 to -10 cm particularly from
70 day after transplanting
For the first plot, the soil was kept saturated during planting period which is called continuous saturated soil (eSS) regime as recommendation from the SRI training centre. Irrigated water was supplied to keep
the soil moisture between 0.511 and 0.608ZYXWVUTSRQPONMLKJIHGFEDCBAm3/m3
For the second plot, the soil was kept drier than the first plot and we called it as incompletely saturated soil (ISS) regime in which the minimum soil moisture value reached 0.405DCBAm3/m3. For the third
plot, moderate soil drying (MSD) regime was applied at the maximum soil moisture value of 0.564
m3
/m3
. The last plot, severe soil drying (SSD)
regime was applied particularly from 70 days after transplanting to the maturity stage in which the minimum soil moisture reached 0.320 m3/m3
.
Water balance analysis
Water balance analysis was performed to estimate irrigation water and water consumption through crop evapotranspiration within the crop season in daily basis based on the following equation:
dSXWVUTSRQPONMLKJIHGFEDCBA
- = pet)+I(t)+ Gw(t) - Qr(t) - DP(t) - ETc(t) (l) dt
Where, -dS .ISdaily c. hanaegeim waterdepth (mm),P .IS
dt
-precipitation (mm), I is irrigation water (mm), Gw is groundwater level (mm), Qr is run off/drainage water (mm), DP is deep percolation (mm) and ETc is crop evapotranspiration (mm). Here, G\J..,water that comes from the ground, was assumed to be zero due to the change was negligible.
W a te r p r o d u c tiv ity
Furthermore, we calculated water productivity (WP) to look up another water-rice production relationship (Molden et al. 2003). In paddy fields, WP is calculated using the following equation (Van der Hoek et al. 2001):
WP= y
LEfc
(2)
fourth plot had the lower values than those CSS and
MSD regimes. However, soil solution EC values for
the ISS regimes gave the lowest values in the early
stage when the soil moisture was fluctuating, and
then soil solution increased as the soil moisture
increased in the next stage.VUTSRQPONMLKJIHGFEDCBA
W a t e r p r o d u c t i v i t y
Table 2 presents water productivity for all irrigation
regimes. From the water balance analysis, total
irrigation water for ISS regime was highest among
all regimes. Although this regime was drier than
CSS regime for the particular moment, however,
during vegetative to the last stage this regime was
more saturated than CSS regime as shown in Fig. S
which means more water input applied to this
regime. Moreover, even the SSD regime ~~ d~ier
than the CSS and MSD regimes; the total Irrigation
water was higher than both CSS and MSD regimes. This was due to more water input is needed to raise
the soil moisture from the extremely dry condition to
saturated condition (approximately 0.300 to 0.520DCBA
mZYXWVUTSRQPONMLKJIHGFEDCBA3
/m3
) . It was occurred three times on SO, S5 and
101 DA T and the total irrigation water was 114 mm
or 43% of total irrigation water for SSD regime
(Fig.S).
Water consumption through crop evapotranspiration
for all irrigation regimes was similar. Here, total
water consumption for ISS and SSD regimes were
higher than in the SCC and MSD regimes. T~ere
seemed have a positive correlation between the Yield
and water productivity (Table 2).
Table 2. Water productivity for each water
management regime
Components Irrigation regime
CSS ISS MSD SSD
Irrigation water (mm) 144 346 115 266
Water consumption 241 265 248 260
(mm)
Yield (t/ha) 4.69 5.31 3.75 5.31
Water productivity 1.95 2.01 1.51 2.04
(kg/m3)
Values of water productivity for CSS, ISS and SS~
regimes were 1.95, 2.01 and 2.04 kg/rrr',
respectively. These values were higher than that for
the intermittent system reported by Chapagain and
Yamaji (20 I 0). In addition, though the water
productivity for MSD regime was lowest in the
current study (1.51 kg/rrr'), its value was still higher
than the flooded system reported by Chapagain and
Yamaji (2010).
4 . G E N E R A L D I S C U S S I O N S
Daily SRI field conditions were monitored properly
by the developed field router connected to t~e
meteorological and soil data loggers. Although this
monitoring didn't send real-time data, the data were
stored in the field data loggers. By adopting
quasi-real time monitoring, it was more power saving and
Internet cost effective than the real time monitoring
by using field server developed in the previous study
(Manzano et al. 20 I 0; Mizoguchi et al. 200S).
However, stability of the field router depends on the
field solar power supply and the Internet connection.
In case there is problem in the Internet connection
within the data transmitting time, the plant images
data were lost as shown in F ig A . Moreover, data
were also lost when the data logger battery is
depleted or the sensor cable is unplugged as shown
in Fig. 5 and Fig.9, respectively.
The images showed the SRI plant growth from the
single seedling to the harvesting time when large
areas were covered. In this monitoring, it was
relatively easy to determine each plant growth stage
and then evaluate the water management regimes
based on the field conditions.
In addition, the numeric data showed the reasonable
values for both the meteorological and the soil
parameters. With these precise data, evaluation of
water productivity for the 4 irrigation regimes could
be easily analyzed. In fact, the soil condition in ISS
regime was almost always more saturated than CSS
regime in the planting period. However, the more
saturated soil condition in the early to the crop
development stages for the ISS and SSD regimes
could increase the yield and the water productivity
(Table 2).
5 . C O N C L U S I O N
The developed Field Network System (FNS) was
effective, efficient and reliable in monitoring SRI
paddy fields in Indonesia. The actual field
conditions were monitored well in term of image,
numeric and graphic data acquisition. With these
data, plant growth and water management can be
more easily monitored and evaluated. The current
findings revealed that in the early to the crop
development stages, the soil should be more
saturated to gain more yield and water productivity
as seen in the current cases of the incompletely
saturated soil (lSS) and the severe soil drying (SSD)
ACKNOWLEDGEMENT
wvutsrqponmlkjihgfedcbaZYXWVUTSRQPONMLKJIHGFEDCBAWe are grateful to the Directorate of Higher Education, Ministry of National Education Republic of Indonesia for funding the current research through International collaboration and publication grant during 2010-2012.
REFERENCES
Chapagain T, E Yamaji. (2010). The effects of irrigation method, age of seedling and spacing on crop performance, productivity and water-wise rice production in Japan. Paddy Water Environ 8:81-90.
De Silva CS, E K Weatherhead, J W Knox, J A Rodriguez-Diaz. (2007). Predicting the impacts of climate change--A case study of paddy irrigation water requirements in Sri Lanka. Agric Water Manag 93: 19-29.
Gani, A., T. S. Kadir, A. Jatiharti, I. P. Wardhana and I. Las. (2002). The System of Rice Intensification in Indonesia. In: N. Uphoff, E. Fernandes, L.P. Yuan, J.M. Peng, S. Rafaralahy and J. Rabenandrasana, eds., Assessments of the System of Rice Intensification (SRI): Proceedings of an international conference held in Sanya, China, April 1-4, 2002, pp. 58-63. Cornell International Institute for Food, Agriculture and Development, Ithaca, NY.
Hilhorst, M.A. (2000). A pore water conductivity sensor. Soil Science Society of America Journal 64(6):
1922-1925.
Manzano Jr V.J.P, M. Mizoguchi, S. Mitsuishi, T. Ito. (2010). IT field monitoring in a Japanese system of rice intensification (J-SRI). Paddy Water Environ. doi:DCBA
1 0 .1 0 0 7 IsI0333-010-0226-2. Published online 08 October 2010.
Mizoguchi M, S Mitsuishi, T Ito, K Oki, S Ninomiya, M Hirafuji, T Fukatsu, T Kiura, K Tanaka, H Toritani, H Hamada, K Honda. (2008). Real-time monitoring of soil information in agricultural fields in Asia using Field server. Proceedings of 1st Global workshop on High Resolution Digital Soil Sensing and Mapping, Vo1.2, Sydney, Australia, pp. 19-24
Molden D, H M Rust, R Sakthivadivel, I Makin. (2003). A water productivity framework for understanding and action. In: Kijne, J.W., Barker, R., Molden, D. (Eds.) Water Productivity in Agriculture: Limits and Opportunities for Improvement. CABI Publishing, Wallingford, UK, pp. 1-18.
San-oh, Y., Mano, Y., Ookawa, T .,Hirasawa, T. (2004). Comparison of dry matter production and associated characteristics between direct-sown and transplanted rice plants in a submerged paddy field and relationships to planting patterns. Field Crop Res 87:43-58.
Sato S, E. Yamaji, T. Kuroda. (201l). Strategies and engineering adaptions to disseminate SRI methods in large-scale irrigation systems in Eastern Indonesia. Paddy Water Environ. doi: 10.1 0 0 7 /s 10333-0 10-0242-2. Published online 04 January 2011.
Sato S, N Uphoff. (2007). A review of on-farm evaluation of system of rice intensification (SRI) methods in eastern Indonesia. CAB Reviews: Perspectives in Agriculture, Veterinary Science, Nutrition and Natural Resources, 2007,2, No. 054, 12 pp.
Stoop W A, N Uphoff , A Kassam. (2002). A review of agricultural research raised by the system of rice intensification (SRI) from Madagascar: opportunities for improving farming system for resource-poor farmers. Agric Sys 71:249-274.
Uphoff N, A Kassam. (2008). Case study: The system of rice intensification. Cornell International Institute of Food Agriculture and Development (CIIFAD) NY 14853, USA.