EISSN: 2086-4094
Primary Nutritional Content of Bio-Flocs Cultured with Different
Organic Carbon Sources and Salinity
JULIE EKASARI1∗∗∗∗∗, ROSELIEN CRAB2, WILLY VERSTRAETE2
1Department of Aquaculture, Faculty of Fisheries and Marine Science, Bogor Agricultural University,
Darmaga Campus, Bogor 16680, Indonesia
2Laboratory of Microbial Ecology and Technology (LabMET), Ghent University, Coupure Links 653,
B-9000 Ghent, Belgium
Received February 1, 2010/Accepted August 18, 2010
Application of bio-flocs technology (BFT) in aquaculture offers a solution to avoid environmental impact of high nutrient discharges and to reduce the use of artificial feed. In BFT, excess of nutrients in aquaculture systems are converted into microbial biomass, which can be consumed by the cultured animals as a food source. In this experiment, upconcentrated pond water obtained from the drum filter of a freshwater tilapia farm was used for bio-flocs reactors. Two carbon sources, sugar and glycerol, were used as the first variable, and two different levels of salinity, 0 and 30 ppt, were used as the second variable. Bio-flocs with glycerol as a carbon source had higher total n-6 PUFAs (19.1 + 2.1 and 22.3 + 8.6 mg/g DW at 0 and 30 ppt, respectively) than that of glucose (4.0 + 0.1 and 12.6 + 2.5 mg/g DW at 0 and 30 ppt). However, there was no effect of carbon source or salinity on crude protein, lipid, and total n-3 PUFAs contents of the bio-flocs.
Key words: bio-flocs, carbon source, protein, fatty acids, glucose, glycerol
___________________________________________________________________________
DOI: 10.4308/hjb.17.3.125
_________________
∗ ∗∗
∗∗Corresponding author. Phone: +62-251-8628755,
Fax: +62-251-8622941, E-mail: [email protected] INTRODUCTION
The FAO (2008) reported that the annual growth rate of aquaculture production during the last decade has reached 14.3% which is higher compared to the capture fisheries, which was 0.5%. Expansion and intensification of aquaculture production are required to fulfill the demand of fishery products. However, limited natural resources, especially land and water, were a challenge for aquaculture experts to make more efficient and productive aquaculture systems. Tal et al. (2009) reported that the gross productivity of gilthead sea bream (Sparus aurata) in a recirculating aquaculture system (RAS) was reached 984 tons/ha/year, on the contrary in traditional ponds was only about 3 tons/ha/year (Pillay & Kutty 2005). Moreover, intensification program in aquaculture also has specific needs such as a strict water management to maintain water quality and to avoid disease contamination. Application of inappropriate water management will affect not only the production system, but also on the surrounding environment.
High density cultures in intensive systems require high amounts of feed to be added to the systems. This will cause water quality deterioration due to the high concentrations of organic compounds (Avnimelech 2007). Because only 20-30% of feed are assimilated in fish biomass, and the remaining for about 70-80% of the feed will be accumulated in the water body as uneaten feed and excretion products (Avnimelech & Ritvo 2003; Gross
& Boyd 2000). The feed especially protein consumed will be catabolized to ammonia, which is the primary nitrogenous waste of the protein metabolism of most teleost and aquatic invertebrates (Stickney 2005). Similarly, bacteria mineralize organic nitrogen in uneaten feed and feces to ammonia (Gross & Boyd 2000). As a consequence, application of high protein feed will result in a high production of ammonia (NH3) in the system. The presence of high ammonia concentration in water is harmful to aquatic animals, as it is toxic even at low concentration. The concentrations of ammonia nitrogen (NH3-N) should be below 0.8-2.0 mg N/L to be safe to aquatic organisms (Stickney 2005).
Ammonia concentrations in aquaculture system can be maintained in low concentration by dilution, with dilution rates of 2% to more than 100% of the water volume depending on the density of the cultures (Yoo & Boyd 1994; Funge-Smith & Phillips 2001; Manju et al. 2009). Water exchange is the most common technique used to maintain water quality (Boyd 2003). However, the discharged water usually contains high concentrations of nutrients in particular nitrogen (Yoo & Boyd 1994). It was reported that the net nitrogen discharged from intensive shrimp farming was in the range of 175 to 509 kg N/ha/crop (Jackson et al. 2003). Thus water exchange without further treatment will lead to the accumulation of waste products into the receiving water. Consequently, aquaculture effluents are considered as important sources of pollution (Naylor et al. 2000; Boyd 2003).
recirculating aquaculture system (RAS), periphyton based aquaculture and bio-flocs technology (BFT). Bio-flocs technology (BFT) in aquaculture can be defined as a technique of water quality management, which is based upon the development and controlling heterotrophic bacteria within the culture system with zero or minimal water exchange. As the microbial community develops, bio-flocs are formed containing a heterogeneous mixture of microorganisms (floc-formers and filamentous bacteria), particles, colloids, organic polymers, cations, and dead cells (Jorand et al. 1995; Hagreaves 2006; Avnimelech 2007; De Schryver et al. 2008). The bio-flocs is then can be consumed as a food source by the cultured animal creating a nutrient recycling process within an aquaculture system. The regeneration or immobilization of nutrients depends on the total carbon taken up by bacteria, the gross conversion efficiency by bacteria, and on the carbon/nitrogen (C/N) ratio of the bacteria and the substrate (Fenchel & Blackburn 1979). The inorganic nitrogen build-up in bio-flocs systems can be controlled by the manipulation of organic C/N ratio in such a way to promote growth of heterotrophic bacteria (Avnimelech 1999). At high C/N feed ratios (10 to 20), heterotrophic bacteria will assimilate the ammonia-nitrogen directly from the water column producing cellular protein (Avnimelech 1999; Crab et al. 2009).
Several studies noted that application of BFT has improved the production performance of several aquaculture species such as shrimp and tilapia (Avnimelech 2007; Kuhn et al. 2008, 2009). This may be related to the nutritional content of bio-flocs, therefore information concerning these parameters of bio-flocs and their influencing factors are becoming one of the most important key in the development of BFT. The objective of our experiment was to study the effect of two organic carbon sources and salinity on the primary nutritional parameters of the bio-flocs.
MATERIALS AND METHODS
Experimental Setup. The reactors in which the BFT was applied consisted of 5 l rectangular plastic containers. A peristaltic pump continuously pumped the influent into the reactor at a flow rate of 5 l/day. Hence, a hydraulic retention time (HRT) of 1 day was obtained. An aerator was installed on the reactor bottom to supply air to maintain aerobic condition and to simulate aeration in the aquaculture systems. The reactor temperature was maintained at 25 oC by a water heater.
The microbiota used to inoculate the reactors was obtained from a tilapia fish farm (Vitafish, Dottignies, Belgium). The microbial community was added to each reactor (200 ml) at the beginning of the experiment. Two different influents were prepared based on the salinity treatment. For saline water treatment (30 ppt), 30 g/l of artificial sea salt (Instant Ocean®) was added to the influent. To each influent, 118 mg/l (NH4)2SO4 and 15.7 mg/l KH2PO4 were added to obtain N and P concentrations of 25 mg/l N and 3.6 mg/l of P, respectively. A liquid plant
fertilizer (ProFito, EASY-LIFE®, The Netherlands) was also added at 0.1 ml/l influent to provide essential minerals and other trace elements. Organic carbon was added daily at C/N ratio of 10. The glucose and glycerol used in this experiment contained 50 and 40% of carbon. Thus these carbon sources were added at 0.6 g/l and 0.9 ml/l, respectively.
The experiment was comprised of two different carbon sources: glucose and glycerol. For each carbon source, two different salinity treatments were applied: freshwater (0 ppt) and seawater (30 ppt). All data were further analyzed statistically using the two-way ANOVA with SPSS statistical software.
Physicochemical Analysis. Sampling was carried out every 6 days for physicochemical analysis. Total ammonia nitrogen (TAN) and ash content were determined following
the standard methods (Greenberg et al. 1992). Crude
protein content was calculated based on the result of Kjeldahl nitrogen measurement. Kjeldahl nitrogen was determined on a 10 ml grab sample stored at -20 oC, which subsequently analyzed using Kjeltec apparatus (Tecator 2200 Kjeltec Auto Distillation, S263 21, Hogamas, Sweden). From the obtained Kjeldahl nitrogen values, TAN was subtracted to obtain organic nitrogen concentrations. Protein content was calculated based on its containing 16% organic nitrogen content and was expressed as a percentage of the bio-floc dry matter weight (DMW) (AOAC 1999). Total lipid was measured by Micro Folch lipid extraction method.
Fatty acid composition was determined by gas chromatography. Fatty acid methyl ester (FAME) was prepared via a modified procedure of Lepage and Roy (1984). This method implicates a direct acid catalyzed transesterification without prior extraction of total fat, on dry sample amount ranging from 10 to 150 mg. Ten percent of an internal standard 20:2(n-6) was added prior to the reaction.
FAME was extracted with hexane. Following evaporation of the solvent, the FAME was prepared for injection by dissolving the FAME in iso-octane (2 mg/ml). Quantitative determination was done by a Chrompack CP9001 gas chromatograph equipped with an autosampler and a temperature programmable on-column injector (TPOCI). Injections (0.2 Fl) were performed on-column into a polar 50 m capillary column, BPX70 (SGE Australia), with a diameter of 0.32 mm and a layer thickness of 0.25 Fm connected to a 2.5 m methyl de activated pre-column. The carrier gas was H2, at a pressure of 100 kPa and the detection mode FID. Identification was based on standard reference mixtures (Nu-Chek-Prep, Inc., USA). Integration and calculation were carried out on computer with Maestro (Chrompack) software program.
RESULTS
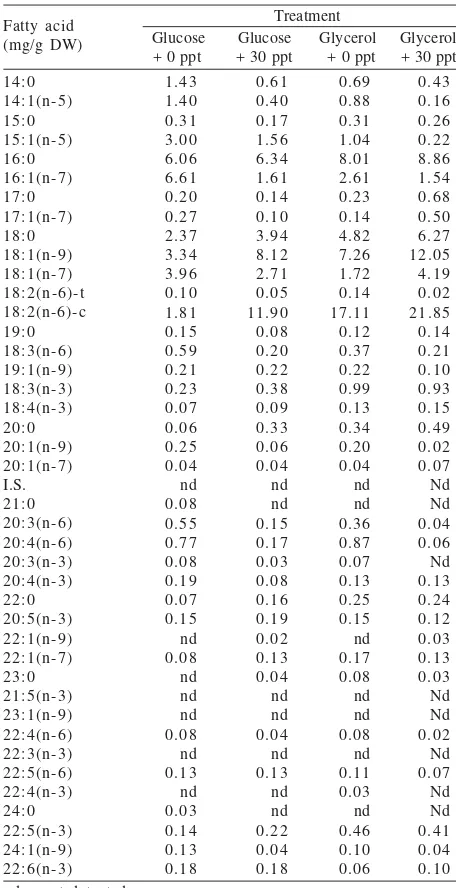
(Figure 1 & Table 1). Crude protein and lipid content ranged from 28-33% dry weight (DW) and 6-9% DW, respectively. Total n-3 polyunsaturated fatty acids (PUFAs) of the bio-flocs of all treatments showed similar values and they were in the range of 0.7-0.8 mg/g DW. With respect to the total n-6 PUFAs, the bio-flocs grown with glycerol as a carbon source (19-22 mg/g DW) had a higher concentration than those grown with glucose (4-12 mg/g DW) (Table 1 & Figure 2). Regarding the composition of the PUFAs in the bio-flocs, bio-flocs with glycerol as the carbon source contained more linoleic acid [LA, 18:2(n-6)] than that with glucose. Linoleic acid [LA, 18:2(n-18:2(n-6)] was the most abundant PUFA in the bio-flocs in this experiment (Table 2). In particular bio-flocs with glucose as carbon source had a total n-6 PUFAs, which was higher in saline water than that of in freshwater. The range of ash content was 7-13% on the DW.
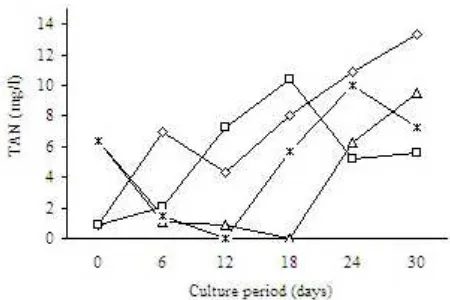
Nitrogen removal from the reactors of all treatments tended to decrease with time. In the first 2-3 weeks, the
bio-flocs reactor fed with glycerol as organic carbon source had a nitrogen removal up 100% but this declined afterwards to 60-70%. In bio-flocs reactors with glucose as the carbon source the nitrogen removal continued to decline from the beginning of the experiment from 96 to 60%. The nitrogen removal capacity can also be reflected by TAN concentration in the reactor (Figure 3).
Figure 1. Photomicrographs of bio-flocs grown (a) on glucose as a carbon source and (b) on glycerol as a carbon source. a b
Table 1. Nutritional content of bio-flocs grown on glucose and glycerol as a carbon source at different salinity (0 and 30 ppt)
Treatment
Glucose + 0 ppt Glucose + 30 ppt Glycerol + 0 ppt Glycerol + 30 ppt Parameters
Protein (% on the DW) Lipid (% on the DW) Total n-3 PUFA (mg/g DW) Total n-6 PUFA (mg/g DW) Ash (% on the DW)
Mean values in same row with a different superscript differ significantly (P < 0.05). Figure 2. Total n-6 PUFAs of bio-flocs grown on glucose and
glycerol as a carbon source and salinity of 0 and 30 ppt at different periods of incubation time. glucose + 0 ppt, glucose + 30 ppt, glycerol + 0 ppt, glycerol + 30 ppt.
Table 2. Fatty acids profile of bio-flocs grown on glucose and glycerol as a carbon source at different salinity
DISCUSSION
The crude protein contents of the bio-flocs in the first experiment did not differ significantly with a range of 18-42%. This suggested that there was no effect of both organic carbon source and salinity on the crude protein content of the flocs. Regardless of the origin of bio-flocs inoculums (freshwater tilapia farm), similarity in the crude protein content as well as other parameters (crude lipid, fatty acids profile and ash content) in different salinity tested was expected, as several studies showed that salinity has no direct effect on the bacterial growth and it was assumed that increased or lowered salinity will select for new physiological types that are able to tolerate the given salt levels, while possessing the same metabolic capabilities (Del Giorgio & Cole 1998; Nielsen et al. 2003). The average of crude protein content of the bio-flocs in saline water was 28% and it was in correspondence with other studies in saline water, where the protein content in the range of 32 to 38% DW (Tacon et al. 2002; Ju et al. 2008). The average of crude protein content of the bio-flocs in freshwater was 33% DW, it was similar with Vanstechelman (2008) study, which was 33 to 37% DW.
There was no specific trend with respect to the crude protein content of bio-flocs during the experiment. A study on bio-flocs production by manipulating C/N ratio of the feed also reported that floc nutritional quality varied significantly between sampling points (Azim et al. 2007). Ju et al. (2008) reported that chlorophyll-dominated floc collected from a white shrimp pond contained a higher crude protein content (42%) than other collected flocs, which were dominated by diatoms (26 and 34%) and bacteria (38%). This suggested that the microbiota that constitutes the bio-flocs is likely to affect the nutritional value of the bio-flocs. With regard to the microbial community of the BFT systems that is grown under similar physical conditions as in activated sludge, it has been suggested that the microbial community in activated sludge is affected by nutrient input, temperature, salinity, power input (advective flow), type of COD, and DO levels (Yan et al. 2007; De Schryver & Verstraete 2009).
The crude lipid content in this study ranged from 6 to 9% on the DW. This was higher than that in other studies, where it ranged from 2 to 2.5% on the DW in freshwater (Azim et al. 2007) and 1.2 to 2.6% on the DW in marine water (Tacon et al. 2002; Ju et al. 2008). Salinity as well as carbon source did not affect the crude lipid content of the bio-flocs. Russel et al. (1995) suggested that one of the major osmoregulatory responses to salt concentration in bacteria is the alteration of the membrane lipid composition.
The PUFAs composition in the bio-flocs showed that LA [18:2(n-6)] was the most abundant PUFA in this experiment. The bio-flocs were also rich in 16:0, 16:1n-7, and 18:1n-7 fatty acids, which were comparable to that reported of bacterial-based microbial communities from biological phosphate removal systems (Liu et al. 2000; Izquierdo et al. 2006). The bio-flocs grown in saline water both with glucose and glycerol as a carbon source revealed a higher docosahexaenoic acid (DHA) content than those in freshwater i.e. 0.1 and 0.2 mg/g on the DW, respectively. Several studies suggested that some species of both freshwater and marine bacteria are able to synthesize PUFAs (Ringgo et al. 1992; Yazawa 1996; Wallis et al. 2002; Satomi et al. 2003).
The bio-flocs fed with glycerol, revealed significantly higher LA concentration than those fed with glucose. The reason for this is not fully understood. Kaneda (1977) noted that the fatty acids content of bacteria was affected by the growth phase and the supply of substrate (short chain fatty acids) and desaturating enzymes. Cells in stationary phase store higher fatty acids than that of required for their growth. It was also concluded that the proportions of unsaturated fatty acids in bacteria are temperature dependent, where low temperature tend to stimulate a higher unsaturated fatty acids production (Kaneda 1977; Russell & Nichols 1999). Several studies showed that PUFA levels of various aquatic microorganisms are likely to be different (Russel & Nichols 1999; Senanayake & Fichtali 2006; Burja & Radianingtyas 2007). This may suggest that the differences of PUFA content of bio-flocs may be influenced by the composition of microorganism within the bio-flocs, which in turn is possibly influenced by the salinity level and the carbon source used.
A study carried out by Izquierdo et al. (2006) showed that the bio-flocs collected from a shrimp tank, where the shrimps were fed with a diet containing fish oil, contained a higher total n-3, n-6, and n-9 PUFAs than those fed with a feed that did not contain fish oil. Certik and Shimizu (1999) pointed out that besides de novo synthesis of fatty acids from glucose, the microbial fatty acid biosynthesis can be also carried out by the incorporation of exogenous fatty acids directly into lipid structures followed by desaturation and elongation of lipid sources. This suggested that the fatty acid profile of the bio-flocs is affected by the dietary lipid composition. In this experiment the total n-3 PUFAs ranged from 0.6 to 0.8 mg/g DW whereas in the other study, where fish oil was included in the shrimp diet (Izquierdo et al. 2006), the range was 8-9 mg/g DW. Figure 3. Total ammonia nitrogen (TAN) concentration in bio-flocs
On the other hand, the total n-6 PUFAs content of the bio-flocs in this experiment, particularly with glycerol as a carbon source, was higher than that in the other study (Izquierdo et al. 2006) regardless of the addition of fish oil to the shrimp diet. The average concentration of total n-6 PUFAs of the glycerol fed bio-flocs was about 17 mg/g DW, whereas in the other study was 9 mg/g DW (with diet containing fish oil) and 5 mg/g DW (with diet containing no fish oil).
The average ash content was in the range of 7-12% on the DW, which was agree with other studies, where the ash content ranged from 7 to 32% on the DW (Tacon et al. 2002; Azim et al. 2007; Ju et al. 2008). Furthermore, Tacon et al. (2002) suggested that the high ash content in the bio-flocs probably related to the presence of acid-insoluble oxides and mixed silicates. It is also suggested that the bio-flocs are a good source of essential minerals and trace elements (Tacon et al. 2002).
The presence of TAN shows that ammonium nitrogen in the system was not completely converted into biomass. Nevertheless, the average TAN removal in this system throughout the experiment was 60 to 100%, which was higher than that of reported in biofilter (65%) (Twarowska et al. 1997) and it was still in safe levels for aquacultures.
In summary, there was no effect of carbon source as well as salinity on the content of crude protein and lipid in bio-flocs. The bio-flocs with glycerol as carbon source contained higher total n-6 PUFAs than those with glucose (significant at P < 0.05). Overall, the study also showed that the nutritional property of bio-flocs can be dynamic, therefore analysing the factors affecting as well as other nutritional parameters that are important in fish nutrition are of interest.
ACKNOWLEDGEMENT
This report is part of thesis of the first author, which is funded by Vlaamse Interuniversitaire Raad scholarship award.
REFERENCES
[AOAC] Association of Official Analytical Chemists. 1999. Official Methods of Analysis of the Association of Official Analytical Chemists. Washington: Method Nr. 92307.
Avnimelech Y. 1999. Carbon/nitrogen ratio as a control element in aquaculture systems. Aquaculture 176:227-235.
Avnimelech Y. 2007. Feeding with microbial flocs by tilapia in minimal discharge bio-flocs technology ponds. Aquaculture
264:140-147.
Avnimelech Y, Ritvo G. 2003. Shrimp and fish pond soils: processes and management. Aquaculture 220:549-567.
Azim ME, Little DC, Bron JE. 2007. Microbial protein production in activated suspension tanks manipulating C/N ratio in feed and implications for fish culture. Bioresource Technology
99:3590-3599.
Boyd CE. 2003. Guidelines for aquaculture effluent management at the farm-level. Aquaculture 226:101-112.
Burja A, Radianingtyas H. 2007. Nutraceuticals and functional foods from marina microbes: An introduction to a diverse group of natural products isolated from marine macroalgae,
microalgae, bacteria, fungi, and cyanobacteria. In: Barrow C, Shahidi F (eds). Marine Neutraceuticals and Functional Foods. Boca Raton, FL (USA): CRC Pr. p 367-405.
Certik M, Shimizu S. 1999. Biosynthesis and regulation of microbial polyunsaturated fatty acid production. J Biosci Bioeng 87:1-14.
Crab R, Kochva M, Verstraete W, Avnimelech Y. 2009. Bio-flocs technology application in over-wintering of tilapia. Aquac Eng 40:105-112.
Del Giorgio P, Cole JJ. 1998. Bacterial growth efficiency in natural aquatic systems. Annu Rev Ecol Sys 29:503-541.
De Schryver P, Crab R, Defoirdt T, Boon N, Verstraete W. 2007. The basics of bioflocs technology: The added value for aquaculture. Aquaculture 277:125-137.
De Schryver P, Verstraete W. 2009. Nitrogen removal from aquaculture pond water by heterotrophic nitrogen assimilation in lab-scale sequencing batch reactors. Bioresource Technology
100:1162-1167.
[FAO] Food and Agriculture Organization. 2008. The state of world fisheries and aquaculture 2006. Rome: FAO.
Fenchel T, Blackburn TH. 1979. Bacteria and mineral cycling. London: Acad Pr. p 225.
Funge-Smith S, Phillips MJ. 2001. Aquaculture systems and species. In: Subasinghe RP, Bueno P, Phillips MJ, Hough C, McGladdery SE, Arthur JR (eds). Aquaculture in the Third Millennium. Technical Proceedings of the Conference on Aquaculture in the Third Millennium. Bangkok, Thailand, 20-25 February 2000. NACA, Bangkok and FAO, Rome. p 129-135. Greenberg AE, Clesceri LS, Eaton AD. 1992. Standard methods
for the examination of waste and wastewater. Washington: American Public Health Society.
Gross A, Boyd CE. 2000. Nitrogen transformations and balance in channel catfish ponds. Aquac Eng 24:1-14.
Hargreaves JA. 2006. Photosynthetic suspended-growth systems in aquaculture. Aquac Eng 34:344-363.
Izquierdo M, Forster I, Divakaran S, Conquest L, Decamp O, Tacon A. 2006. Effect of green and clear water and lipid source on survival, growth and biochemical composition of Pacific white shrimp Litopenaeus vannamei. Aquacult nutr
12:192-202.
Jackson C, Preston N, Thompson PJ, Burford M. 2003. Nitrogen budget and effluent nitrogen components at an intensive shrimp farm. Aquaculture 218:397-411.
Jorand F, Zartaria F, Thomas F, Block JC, Bottero JY, Villemin G, Urbain V, Manem J. 1995. Chemical and structural (2d) linkage between bacteria within activated-sludge flocs. Water Res
29:1639-1647.
Ju ZY, Forster I, Conquest L, Dominy W, Kuo WC, Horgen FD. 2008. Determination of microbial community structures of shrimp floc cultures by biomarkers and analysis of floc amino acid profiles. Aquaculture Research 39:118-133.
Kaneda T. 1977. Fatty acids of the genus Bacillus: an example of branched-chain preference. Bacteriol Rev 41:391-418. Kuhn DD, Boardman GD, Craig SR, Flick JrGJ, McLean E. 2008.
Use of microbial flocs generated from tilapia effluent as a nutritional supplement for shrimp, Litopenaeus vannamei, in recirculating aquaculture sistems. J World Aquacult Soc 39:72-82.
Kuhn DD, Boardman GD, Lawrence AL, Marsh L, Flick JrGJ. 2009. Microbial floc meal as a replacement ingredient for fish meal and soybean protein in shrimp feed. Aquaculture
296:51-57.
Lepage G, Roy CC. 1984. Improved recovery of fatty acid through direct transesterification without prior extraction or purification. J Lipid Res 25:1391-1396.
Liu WT, Linning KD, Nakamura K, Mino T, Matsuo T, Forney LJ. 2000. Microbial community changes in biological phosphate-removal systems on altering sludge phosphorus content. Environ Microb 146:1099-1107.
Naylor RL, Goldburg RJ, Primavera JH, Kautsky N, Beveridge MCM, Clay J, Folke C, Lubchenco J, Mooney H, Troell M. 2000. Effect of aquaculture on world fish supplies. Nature
405:1017-1024.
Nielsen DL, Brock MA, Rees GN, Baldwin DS. 2003. Effects of increasing salinity on freshwater ecosystems in Australia. Aus J Bot 51:655-665.
Pillay TVR, Kutty MN. 2005. Aquaculture: Principles and practices (2nd edition). Oxford: Blackwell Publ. p 624.
Ringgo E, Jostense JP, Olsen RO. 1992. Production of eicosapentaenoic acid by freshwater Vibrio. Lipids 27:564-566.
Russel NJ, Evans RI, ter Steeg PF, Hellemons J, Verheul A, Abee T. 1995. Membranes as a target for stress adaptation.
International J Food Microbiology 28:255-261.
Russell NJ, Nichols DS. 1999. Polyunsaturated fatty acids in marine bacteria – a dogma rewritten. Microbiology 145:767-779. Satomi M, Oikawa H, Yano Y. 2003. Shewanella marinintestina
sp. Nov., Shewanella schlegeliana sp. Nov. and Shewanella sairae sp. Nov., novel eicosapentaenoic-acid-producing marine bacteria isolated from sea-animal intestines. Int J Syst Evol Microbiol 53:491-499.
Senanayake SPJN, Fichtali J. 2006. Single-Cell Oils as sources of nutraceutical and specialty lipids: processing technologies and applications. In: Shahidi F (ed). Neutraceutical and Specialty Lipids and Their Co-Products. Technology and Engineering. CRC Pr. p 563.
Stickney RR. 2005. Aquaculture: An introductory text. Cambridge, USA: CABI Publ. p 256.
Tacon AGJ, Cody JJ, Conquest LD, Divakaran S, Forster IP, Decamp OE. 2002. Effect of culture system on the nutrition and growth performance of Pacific white shrimp Litopenaeus vannamei
(Boone) fed different diets. Aquacult Nutr 8:121-137. Tal Y, Schreier HJ, Sowers KR, Stubblefield JD, Place AR, Zohar Y.
2009. Environmentally sustainable land-based marine aquaculture. Aquaculture 286:28-35.
Twarowska JG, Westerman PW, Losordo TM. 1997. Water treatment and waste characterization evaluation of an intensive recirculating fish production system. Aquac Eng
16:133-147.
Vanstechelman H. 2008. Bio-vloktechnologie: Het verwijderen van nutrienten in de aquacultuur en de simultane productie van hoogwaardige nutritionele vlokken [Thesis]. Ghent, Belgium: Ghent University.
Wallis JG, Watts JL, Browse J. 2002. Polyunsaturated fatty acid synthesis: what will they think of next? Trends Biochem Sci
27:467-473.
Yan S, Subramanian B, Surampalli RY, Narasiah S, Tyagi RD. 2007. Isolation, characterization, and identification of bacteria from activated sludge and soluble microbial products in wastewater treatment. Pract Periodical Haz, Toxic, Radioactive Waste Mgmt 11:240-258.
Yazawa K. 1996. Production of eicosapentaenoic acid from marine bacteria. Lipids 31:297-300.