Lean process management implementation through enhanced
problem solving capabilities
Perumal Puvanasvaran
1, Hamdan Megat
2, Tang Sai Hong
3, Muhamad Mohd Razali
4, S
Hamouda Abdel Magid
51
University Technical Malaysia Melaka (MALAYSIA);
2University Pertahanan National Malaysia
(MALAYSIA);
3University Putra Malaysia (MALAYSIA);
4University Technical Malaysia Melaka
(MALAYSIA);
5Qatar University (QATAR)
Received January 2009
Accepted November 2010
trademark it as People Development System (PDS) to enhance problem solving capability
among its employees while implementing the lean process management there. Although,
the PDS can be implemented throughout the organization, if it is implemented in a
particular department in an organization, it will be feasible to study and analyze its
effectiveness in-depth. So, this study documents and analyzes the implementation of Lean
process in the Kitting Department of the aerospace company, ABC Company. Qualitative
and quantitative measures were also used to document the case study. The outcome of the
people development system needs to be measured to understand its value in developing
the problem solving capabilities among the employees. Only with developed and equipped
employees, the Kitting Department can reduce its wastages, optimize its performance and
thereby play a crucial role in making ABC Company a world class organization. As
pertinent results of the PDS implementation, in general Kitting Department successfully
achieved to meet their Department Key Performance Indicator and particularly the
employees’ are also improve by practicing good lean behaviors and skill and knowledge in
using lean tools which lead to better leanness level by improving employees’ problem
solving capabilities in eliminating waste. On the whole, the lean process management and
the resultant PDS is having positive applications, and importantly could also have positive
applications in the future as well.
Keywords: lean process management, people development system, problem solving
capabilities
1 I n t r odu ct ion
as w ell as t hem . ‘Collage’ of em ployees in t he sense, organizat ions w ill norm ally be const it ut ed of em ployees fr om differ ent backgr ounds, cult ure, educat ional qualificat ions, skill level and at t it ude. I nside t he organizat ion, t hese w or kers w ill norm ally be apport ioned int o differ ent depart m ent s for bet t er arr angem ent or st ream lining of w or k. These depart m ent s, w hich m ake up an organizat ion, only play an om nipresent and crucial role in t he proper and effect ive funct ioning of t he organizat ions, by adopt ing various feasible and effect ive st rat egies including approaches like t he lean m anagem ent appr oach. That is, w it h every organizat ion w ant ing t o expand t heir r each and m ak e an im print in various m arket s, t h er e w ill be enough opport unit ies for it , t o init iat e t hat ex pansion drive.
Thus, w hen t he organizat ion has enough opport unit ies, it can set t arget s and for m ulat e various st rat egies t o achieve t hose t arget s. Along wit h t he form ulat ion of new t arget s and st rat egies, organizat ions also have t o init iat e changes in it s overall funct ioning. The changes can be brought out bot h by t he int ernal and ext ernal environm ent of t he organizat ions. This is w her e t he appr oach es like lean m anagem ent com e int o t he pict ure. And t h e k ey aspect is, t he organizat ions and it s em ployees w ill or should be able t o adapt or orient t hem selves t ow ards t he t arget s and should also be in sync wit h t he lean process m anagem en t . Ther efor e ev ery organizat ion’s sur vival and success hinges on how t he organizat ion has been able t o adapt t o t he changes as part of t h e lean process m anagem ent in it s funct ioning as w ell as t he changes t hat m ight keep happening in t he m arket . Accordingly, form ulat ing and im plem ent ing im port ant st rat egies including lean m anagem ent and t he result ant changes, t o guide t he em ployees, ar e t he ‘k eys’ t hat opens t he door of success and pr ofit for any organizat ion. The decisions w hich are needed t o be t aken inside t he organizat ion regarding t hese aspect s have t o be t aken by t he leader and t he m anagem ent t eam w it h a lot of car e, planning, analysis and feedback .
adapt and change t o all t he appropriat e m om ent s and sit uat ions, including during t he im plem ent at ion of t he lean process m anagem ent .
2 Lit e r a t u r e r e v ie w
Many indust ries in t oday’s com pet it ive and fast m oving w orld have successfully adopt ed lean m anufact u ring pract ices and principles. But , m ost of t hese com panies are st ill not w hat can be consider ed as a fully lean organizat ion since t h ey have been w ast ing t heir valuable resour ces w hich could affect t heir pr oduct ivit y as w ell as pr ofit . I n order t o becom e fully lean, in w hat soev er a com pany m ust underst and lean as a long- t erm philosophy about t he right processes t hat w ill produce t he right result s and added value t o t he organizat ion, by cont inuously developing people and part ner s t hr ough cont inuously solving problem s ( Liker, 2004) .
Act ually, as Liker ( 200 4) st at ed about how organizat ions should im plem ent t he lean process m anagem ent , t here is no exact definit ion for a fully lean organizat ion. Ev en t hough t he goal of becom ing a fully lean organizat ion can only be r each ed if t he em ployees ar e w ell aligned w it h t he new philosophy. I n t hat case, t herefor e it is im port ant for an organizat ion t o underst and and apply all of t he pract ices and principles besides a com preh ensive lean t hinking, w hich affect s t he w hole business m odel as a key and not solely leaner product ion. This t hought process has high chance of elim inat ing wast es, but t he im plem ent at ion has inbuilt issues.
Here, t hey failed t o provide a com plet e or apt or opt im al st ruct ured lean process m anagem ent sy st em t hat can guide em ployees in enhancing problem solving com pet ence, w hen in t he im plem ent ing t he process t her e ar e som e of t he follow ing reasons as follow as:
• The business is unable t o learn and change it s behavior ( Em iliani, 1998b) . He defined t he r epeat ed m ist akes of t he business as anot her prim ary t ype of w ast e and argues t hat , “ No doubt , risk t he fu t ure exist ence of t heir ent ire ent erprise as cu rr ent ly governed” .
• I n a lean com pany , Liker ( 2004) st at ed t hat learning cont inues since lean is a cont inuum and not a st eady st at e. Alt hough lean t hinking is a buzzword, t he lean philosophy, pract ices and principles offer indust ry a pot ent ial m echanism for im proving perform an ce w h er e m any lean im plem ent at ion s t o dat e hav e follow ed a t rial and err or appr oach ( Gilgeous & Gilgeous, 19 99)
• A lack of direct ion of planning and adequat e proj ect sequencing ( Bhasin & Burcher, 2006)
• Lean concept w as view ed as a count er - int uit ive alt ernat ive t o t radit ional m anufact uring m odel proposal ( Wom ack , Jon es, & Roos, 1990)
• The concept of w ast e has not been y et effect ively ext ended t o t he self-defeat ing behaviors of individual and group of people in w orkplace ( Em iliani, 1998a) , change in em ployees at t it ude and behavior ( Gagnon & Michael, 2003)
• Lean is seen as an abst r act philosophy ( Pullin, 2002)
( Park er , 2003) ; con vent ional approaches w hich ignore dynam ics com plexit ies in t he hum an condit ional and in organizat ion syst em ( Gat es & Cooksey, 1998) ; honest com m unicat ion and delegat ion of aut horit y ( Spear & Bow en, 1999) .
• Need t o im prove t he product ivit y of a m an ufact uring organizat ion w it h respect t o differ ent m ark et and product m ixes ( Hilm ola, 2005) ; cust om er value and m ark et segm ent s ( Set ij ono & Dahlgaard, 2007) .
• Absence of pract ical and det ailed m odel t o follow in pursuit of excellence w it hin m anufact uring ( Gilgeous & Gilgeous, 1999) , holist ic logic and m anagem ent syst em ( Holw eg, 2007) , and t he out com e of dynam ic learning process t hat adopt ed t h e pract ice ( Cusum ano, 1992) .
Alt hough m any expert s, research er s, aut hor s and t he result ant lit erat ures suggest s ‘w hat ’ and ‘w hy’ an organizat ion should incorporat e t he lean process m anagem ent int o funct ioning, but fails t o sh ort of clearly explaining ‘how ’ it should im prov e t he lean process m anagem ent . Furt herm or e, past r esear chers m ainly focus on how t he individuals can be t rained t o w ork efficient ly and in a t rim m ed w ay, but not as part of a lean pr ocess m anagem ent . Because of t hese short falls, m any organizat ions fail t o unlock t he infinit e pot ent ial of t heir w orkforce. I n t hat case t her e w ill be m ore ov erhead, w it h m ore layers of m anagem ent , w hich in t urn could cause slow er react ion t im es in fast changing business. To elim inat e all t hese w orst case scenarios, lean pr ocess m anagem ent is t he m ain t ool for t he organizat ion and it s em ployees. But t he pr oblem is, t her e no clear cut pr ot ocols or processes t o im plem ent t he lean process m anagem ent .
3 A p r op osa l for p e op le de v e lopm e n t sy st e m r e qu ir e m e n t s
People Dev elopm ent Syst em involves a r ange of act ivit ies, pr act ices, and procedur es t hat needs t o be im plem ent ed by t he m anagem ent t o em pow er t he com pany’s people. As m ent ioned abov e, it w ill only provide t he direct ion for t he dev elopm ent of people and helps t he organizat ion t o im plem ent all it s plans, st rat egies, et c, including t he lean process. Am ong t he m any pract ices t hat will be included in t he People Dev elopm ent sy st em , few are em ploy ee t raining and program s for t he form at ion of t eam s w it hin t he depar t m ent s including self- direct ed w or k groups. The sy st em also reduces t he ‘red t apes’ or biased or unet hical behaviour t hat w ill be visible in m any t radit ional organizat ions. I nst ead, t he syst em w ill develop t he em ploy ees and m ak e t hem par t of all t he im port ant pract ices t hat t akes place inside an organizat ion including t he decision m aking pract ices as part of t he lean process m anagem ent .
This can only happen wit h t he deeper involvem ent of each and every em ployee in an organizat ion. By t he part of t he em ployee, each one should underst and for w hat t hey hav e been hired and t hereby underst and t heir specific roles, and provide t he best ser vices by developing t hem selves. Beside, t he m anagem ent from each depart m ent should also play a role in t he developm ent of t heir em ployees. All t he depart m ent s fr om pr oduct ion, engineering, m aint enance, hum an resou rces, finance, qualit y assurance t o support services, need t o ident ify and dev elop t he people t o achieve t he goal of being a lean w orld class m anufact ur er .
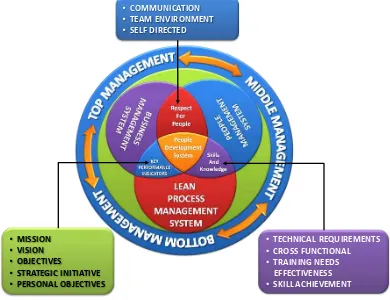
Figur e 1. “ Fr am ewor k for enhancing t he pr oblem solving capabilit ies of t he em ployees” .
Sour ce: Puvanasvar an et al. ( 2008)
As part of t he t raining program s, pract ices such as coaching and m ent oring should also be incorporat ed t o dev elop t he em ployees and m ake perfect ly suit able for t he organizat ion’s lean process. “ Coaching and Ment oring can be used t o effect ively unlock t he pot ent ial t hat already exist s w it hin any organizat ion. The organizat ion’s m ost valuable resou rce is it s people or put m or e concr et ely, t he know ledge and passion t hat resides w it hin t he heart s and m inds of it s people int roducing coaching and m ent oring w it hin any organizat ion, w ill reap t he benefit s t o t he organizat ion”
• MISSION • VISION • OBJECTIVES
• STRATEGIC INITIATIVE • PERSONAL OBJECTIVES
• COMMUNICATION • TEAM ENVIRONMENT • SELF DIRECTED
• TECHNICAL REQUIREMENTS • CROSS FUNCTIONAL • TRAINING NEEDS
[image:8.595.103.493.270.570.2]associat ed pract ices w ill only prepare of em ployees for t he lean pr ocess.
The pr oposed PDS w ill be use by 3 elem ent s, as st at ed in t he Figure 1, such as Key Per form ance I ndicat or, Skill and Know ledge and Respect for People. As illust rat ed in t he figure, t he im port ant aspect s of lean process, People Managem ent and Business m anagem ent can be opt im ized by t he com m on fact or of PDS. To com plim ent PDS role in t he t hree pr ocesses, t hr ee m or e elem ent s need t o be t ak en car e. Th e t hree elem en t s of Key Perfor m ance I ndicat or, Skill and Know ledge and Respect for People shou ld be handled effect ively and posit ively t o develop a st rong PDS, and t her eby lead t he pr ocesses t o a successful end.
3 .1 Ke y Pe r f or m a n ce I n d ica t or ( KPI )
Key Perform ance I ndicat ors, also know n as KPI is a set of financial and non-financial m easurem ent s, set by organizat ions t o m easure t he progress t ow ard organizat ional goals. That is, aft er t he organizat ion set s it s m ission, ident ifies it s st akeh olders, and defines it s goals, it needs t o m easu re t he pr ogress it is m aking t ow ard t hose goals. This is w her e KPI com es int o t he pict ure an d helps t he organizat ion t o m easur e t he pr ogr ess. KPI , set by t he organizat ions, during lean process m anagem ent enables w orkfor ce t o focus on com pany’s Mission, Core Value, Vision, Obj ect ive, St rat egies, St rat egic I nit iat ive and Personal Obj ect ive. I t is one of t he cru cial fact or s for people dev elopm ent sy st em . This w ill align t he t ot al w or kfor ce of t he com pany t o follow one com m on goal ( w it h t he set obj ect ives m ade visible) . At each st age of pr ogr ess t ow ards t he goals, t he em ployees’ perform ance can be m easur ed based on KPI . Based on t he m easur em ent , t h e em ployees’ perform ance can be opt im ized furt her, if t he perfor m ance falls short or if t he perform ance is bet t er, it can be m ade consist ent . So, at each st age, t he KPI has it s ow n port ion of cont ribut ion t ow ards t he ov erall t arget . The accum ulat ion of success during each st age w ill reflect in t he overall perform ance of t he com pany t ow ards t he set goal, and t hat over all perfor m ance is t he cum ulat ive perform ance of t he em ploy ees.
3 .2 Re sp e ct for pe ople
sense, t he em ploy ees should not be forced t o part icipat e in t he lean process m anagem ent . I nst ead, t hey sh ould be m ade aw are of t h e pr ocedur es as part of t he lean process m anagem ent and, im port ant ly t heir view s and suggest ions should also be elicit ed. So, considering t he crucial role, t he em ployees w ill play in t he lean process, t hey should be given ‘r espect ’. Making t he em ployees’ aw are, elicit ing t heir view s and t h er eby respect ing t hem w ill surely m ake t hem cont ribut e opt im ally t o t he lean process m anagem ent . I n or der t o m easu re t he em ployees’ com m it m ent , leanness level of t he com pany and im port ant ly t he per cept ion of em ployees on lean pract ices, quest ionnaire based su rv ey w it h likert - t ype scale can be used. Apart fr om t his aspect , t he pr oblem solving capabilit ies of em ployees also can be m easur ed by count ing t he num ber of ideas generat ed by an em ployee. As discussed earlier, em ploy ees’ or people’s opt im al cont ribut ion t o t he lean process m anagem ent can only m ake it a success and because of t his undisput able fact , t he people sh ould be r espect ed t hrough v arious w ays.
3 .3 Sk ills a n d k n ow le dge
t o m easur e t he skill and know ledge level of em ployees r egarding t he lean process. For exam ple, a spider w eb chart w it h rat ing of 1 ( beginning t o int roduce) t o 5 ( pract ice w it h excellent ) can also be used.
4 M e t h odolog y
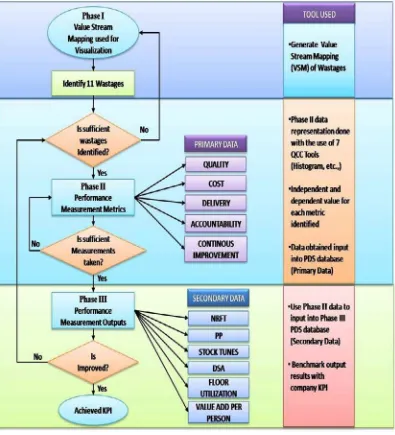
The m et hod of dat a collect ion w as by act ion resear ch at kit t ing depart m ent at GLC. To im plem ent t he people developm ent syst em , t he r esearch er w as at t ached w it h t he pilot t eam t hroughout t he st udy. Basically, t he flow chart in figure 2 show s t he ov erall execut ion for PDS im plem ent at ion. Phase I w ill begin by generat ing t he Value St ream Mapping ( VSM) of cur rent st at e by Value St ream Manager w it h t he help of Funct ional Manager . VSM w as used t o show t he clear and t he overall pict ure of t he cur rent st at e and not as an assessing t ool for w ast ages. The cur rent st at e w as dev eloped w it h t he help of Value St r eam Manager an d Funct ional Manager . The VSM w ill be creat ed by u sing infor m at ion such as run rat ios, scrap rat es, m anpow er, w or k hours & sch edules, ch angeov er t im es, t ool change t im es, and invent ory lev el w ill be keyed int o PDS dat abase. Here value added and non-value added act ivit ies w ill be ident ified by proposing t he fut ure non-value st ream m apping. Wast age ident ified w ill be cat egorized under t he QCDAC principles.
Each m et ric will be m onit ored. I ndependent & Dependent Variables will be ident ified for m onit oring purposes. Dat a w ill be collect ed m anually, and w ill be insert ed int o t he PDS dat abase. Aft er inform at ion has been key ed in int o t he dat abase, graph w ill be gen erat ed w hich w ill becom e t he visual indicat or for com m unicat ion and discussion purpose. As an exam ple, w e t ak e a m et ric of scrap m easuring m echanism . This m et ric will m easure t he scrap rat e produced by t he product ion line. Dat a of scrap w ill be collect ed and graph will be gener at ed for t he w eek and post ed ont o t he PDS board. Brainst or m ing and problem solving act ivit ies w ill t ake place am ong t he em ploy ees t o en cou nt er and discuss t he w ast e occurr ed.
achievem ent s. Th e det ails of execut ion im plem ent at ion of People Dev elopm ent syst em is explained in follow ing sect ion.
Figur e 2. “ Flow char t on m et hodology execut ion for PDS im plem ent at ion” . Sour ce:
Puvanasvar an et al. ( 2008)
5 I m ple m e n t a t ion r e su lt s a n d discu ssion
5 .1 Fu t u r e St a t e V a lu e St r e a m M a pp in g ( FSVSM )
[image:12.595.102.497.157.592.2]reduced using cont inuous im prov em ent act ivit ies. Below ar e t h e im prov em ent s been m ade for t he fut ur e st at e VSM:
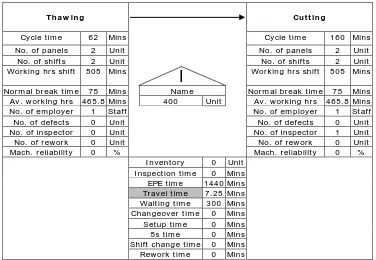
Based on t h e fut ur e st at e VSM, figure 3 , a sect ion bet w een t haw ing t o cut t ing have been chosen. Upon analysis, high t ravel t im e has been not iced. I nit ial t ravel t im e is around 7.25m in.
Thaw ing t o cut t ing process
Tha w in g Cu t t ing
Cy cle t im e 62 Mins Cy cle t im e 160 Mins
No. of panels 2 Unit No. of panels 2 Unit
No. of shift s 2 Unit No. of shift s 2 Unit
Work ing hr s shift 505 Mins
I
Work ing hr s shift 505 Mins Nor m al br eak t im e 75 Mins Nam e Nor m al br eak t im e 75 Mins Av . w or k ing hr s 465.8 Mins 400 Unit Av . w or k ing hr s 465.8 MinsNo. of em ployer 1 St aff No. of em ployer 1 St aff
No. of defect s 0 Unit No. of defect s 0 Unit
No. of inspect or 0 Unit No. of inspect or 1 Unit
No. of r ew ork 0 Unit No. of r ew ork 0 Unit
Mach. r eliabilit y 0 % Mach. r eliabilit y 0 %
I nvent ory 0 Unit I nspect ion t im e 0 Mins
EPE t im e 1440 Mins Tr av el t im e 7.25 Mins Wait ing t im e 300 Mins Changeov er t im e 0 Mins Set up t im e 0 Mins 5s t im e 0 Mins Shift change t im e 0 Mins Rework t im e 0 Mins
Figur e 3. “ Tr avel t im e wast ages ( Thawing t o Cut t ing) ” .
[image:13.595.110.486.251.511.2]m achine feeder. Trav el t im e has been r educed from 7 .25 m in t o 3 m in. 4.25 m in of m ot ion w ast e have been rem ov ed fr om t he VSM.
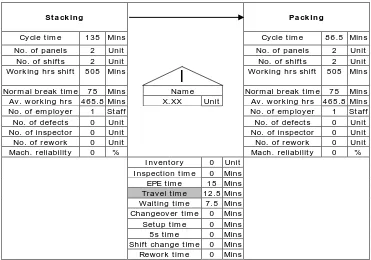
Based on t he fut ur e st at e VSM, Figure 4, a sect ion bet w een t haw ing t o cut t ing has been chosen. Upon analysis, high t ravel t im e has been not iced. I nit ial t ravel t im e is around 12.25m in.
St acking t o packing pr ocess
St a ck ing Pa ck ing
Cy cle t im e 135 Mins Cy cle t im e 86.5 Mins
No. of panels 2 Unit No. of panels 2 Unit
No. of shift s 2 Unit No. of shift s 2 Unit
Work ing hr s shift 505 Mins
I
Work ing hr s shift 505 Mins Nor m al br eak t im e 75 Mins Nam e Nor m al br eak t im e 75 Mins Av . w or k ing hr s 465.8 Mins X.XX Unit Av . w or k ing hr s 465.8 MinsNo. of em ployer 1 St aff No. of em ployer 1 St aff
No. of defect s 0 Unit No. of defect s 0 Unit
No. of inspect or 0 Unit No. of inspect or 0 Unit
No. of r ew ork 0 Unit No. of r ew ork 0 Unit
Mach. r eliabilit y 0 % Mach. r eliabilit y 0 %
I nvent ory 0 Unit I nspect ion t im e 0 Mins
EPE t im e 15 Mins Tr av el t im e 12.5 Mins Wait ing t im e 7.5 Mins Changeov er t im e 0 Mins Set up t im e 0 Mins 5s t im e 0 Mins Shift change t im e 0 Mins Rework t im e 0 Mins
Figur e 4. “ Tr avel t im e wast ages ( st acking t o packing) ” .
To ov ercom e t his problem , a solut ion have been pr oposed w hich is aft er each nest ing process, t he operat or needs t o w alk all t he w ay t o packing ar ea and r et urn again once delivery has been done. This process is done a few t im es. The solut ions is t o allocat e t w o t r olley w it h invent ory w h er eby operat or can sim ply place t he finish nest ing int o t he t rolley and w ait unt il t he w hole t r olley is full w it h nest ing t hen only proceed t o packing area.
Ca lcu la t ion s N e w solu t ions
10 sec per t r ip ( 5 sec go and 5 sec back ) for 75 t im es
= 750 sec or 12.5 m in
30 sec per t r ip ( 15 sec go and 15 sec back ) x 10 t im es
[image:14.595.112.483.251.511.2]This is t o r educe st acking process due t o now st acking been don e on t he t rolley w it hout t he oper at or m oving around. This solut ion have caused 7.5 m in of w ast e been rem ov ed.
Based on t h e fut ur e st at e VSM, figure 5 , a sect ion bet w een t haw ing t o cut t ing have been chosen. Upon analysis, high t ravel t im e has been not iced. I nit ial w ait ing t im e is around 210m in.
Packing t o paperw ork pr ocess
Pa ck ing Pa pe r w or k
Cy cle t im e 86.5 Mins Cy cle t im e 110 Mins
No. of panels 2 Unit No. of panels 1 Unit
No. of shift s 2 Unit No. of shift s 2 Unit
Work ing hr s shift 505 Mins
I
Work ing hr s shift 505 Mins Nor m al br eak t im e 75 Mins Nam e Nor m al br eak t im e 75 Mins Av . w or k ing hr s 465.8 Mins X.XX Unit Av . w or k ing hr s 465.8 MinsNo. of em ployer 1 St aff No. of em ployer 1 St aff
No. of defect s 0 Unit No. of defect s 0 Unit
No. of inspect or 0 Unit No. of inspect or 1 Unit
No. of r ew ork 0 Unit No. of r ew ork 0 Unit
Mach. r eliabilit y 0 % Mach. r eliabilit y 0 %
I nvent ory 0 Unit I nspect ion t im e 0 Mins
EPE t im e 20.3 Mins Tr av el t im e 11.25 Mins Wait ing t im e 210 Mins Changeov er t im e 0 Mins Set up t im e 0 Mins 5s t im e 0 Mins Shift change t im e 0 Mins Rework t im e 0 Mins
Figur e 5. “ Tr avel t im e wast ages ( packing t o paper wor k) ” .
To ov er com e t his pr oblem , a solut ion have been pr oposed, inst ead of using sm all packing m achine for packing, m odified t he lengt h of j aw t o a longer lengt h so t hat no m ult iple packing is required, t his act ions reduced w ait ing t im e from 210 m in t o 100 m in, a reduct ion of 110 m in of w ast e is been rem ov ed.
Based on t h e fut ur e st at e VSM, figure 6 , a sect ion bet w een t haw ing t o cut t ing have been chosen. Upon analysis, high t ravel t im e has been not iced. I nit ial w ait ing t im e is around 1440m in.
[image:15.595.108.489.271.532.2]Pa pe r w or k D e liv e ry
Cy cle t im e 110 Mins Cy cle t im e 9.3 Mins
No. of panels 1 Unit No. of panels 1 Unit
No. of shift s 2 Unit No. of shift s 2 Unit
Work ing hr s shift 505 Mins
I
Work ing hr s shift 505 Mins Nor m al br eak t im e 75 Mins Nam e Nor m al br eak t im e 75 Mins Av . w or k ing hr s 465.8 Mins X.XX Unit Av . w or k ing hr s 468.5 MinsNo. of em ployer 1 St aff No. of em ployer 1 St aff
No. of defect s 0 Unit No. of defect s 0 Unit
No. of inspect or 1 Unit No. of inspect or 0 Unit
No. of r ew ork 0 Unit No. of r ew ork 0 Unit
Mach. r eliabilit y 0 % Mach. Reliabilit y 0 %
I nvent ory 0 Unit I nspect ion t im e 4 Mins
EPE t im e 15.8 Mins Tr av el t im e 3.58 Mins Wait ing t im e 1440 Mins Changeov er t im e 0 Mins Set up t im e 0 Mins 5s t im e 0 Mins Shift change t im e 0 Mins Rework t im e 0 Mins
Figur e 6. “ Tr avel t im e wast ages ( paper wor k t o deliver y) ” .
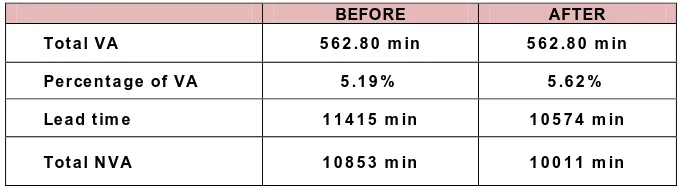
To overcom e t his problem , a solut ion have been proposed, each panel will have m ult iple of paper w ork t hat m ust be approv ed. This procedur e is t im e consum ing. Engineering depart m en t have don e split and bat ching paperw ork t o reduce t im e involve in approving. This solut ion is est im at ed t o sav e approving t im e fr om 1440 m in t o 720 m in, t hus rem oving 720 m in of w ast e t im e. From t able 1, a con clusion can be m ade; t ot al VA no changes been m ade, percent age of VA has been increased from 5.19 % t o 5.62% w hich saw an im provem ent of 0.43% . Lead t im e and t ot al NVA t im e have been reduced also.
BEFORE AFTER
Tot a l VA 5 6 2 .8 0 m in 5 6 2 .8 0 m in
Pe r ce n t a ge of VA 5 .1 9 % 5 .6 2 %
Le a d t im e 1 1 4 1 5 m in 1 0 5 7 4 m in
Tot a l N V A 1 0 8 5 3 m in 1 0 0 1 1 m in
Table 1. “ Cur r ent vs. Fut ur e St at e VSM values” .
5 .2 Pr im a r y d a t a
[image:16.595.110.485.106.368.2] [image:16.595.127.467.562.658.2]2007 t ill Jun 2007, and aft er im prov em ent dat a have been allocat ed fr om July 2007 t ill Decem ber 200 7. Below ar e t he im provem ent t rends t hat can be seen for each and ev er y Per form ance Measurem ent s ( PM) st art ing from Prim ary Dat a.
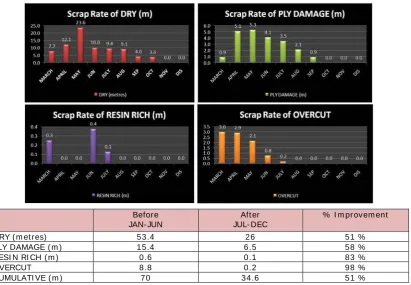
Figure 7 show s t he overall percent age of im prov em ent for Scrap Measu ring Mechanism for befor e and aft er im prov em ent from m achine DCS 1 , DCS 2, DCS 3 and S91 w here t he m at erials scrapped du e t o Ply Dry, Ply dam aged, Resin Rich and Ov er cut issues ar e sh ow n in Figure 7 as Over all Scrap Rat es each issues. Scrap is m easur e by t h e unit m et er ( m ) . Th er e ar e not iceable posit ive im provem ent s fr om t hose m achines w hich are ply dam age and ply dry. Bot h t ypes of scrap have been an issue for kit t ing depart m ent , t hey do r ealize t hat count er - m easur e need t o be done but aft er so long all t heir ideas doesn’t seem t o help t hem , unt il PDS is been im plem ent ed.
Scrap im provem ent m easuring m echanism
Before JAN- JUN
Aft er JUL- DEC
% I m pr ov em ent
DRY ( m et res) 53.4 26 51 %
PLY DAMAGE ( m ) 15.4 6.5 58 %
RESI N RI CH ( m ) 0.6 0.1 83 %
OVERCUT 8.8 0.2 98 %
CUMULATI VE ( m ) 70 34.6 51 %
Figur e 7. “ Over all Scr ap Measur ing Mechanism Gr aph” .
ply dam age during cut t ing have been solved by fr equent m achine m aint enance. Ov er cut problem s have also been solved ent irely by frequ ent m achine m aint enance as t he cut t ing t olerance has been fixed. As a conclusion t o scrap perform ance m easur em ent , it w as prov en t hat t hose im provem ent s have been m ade. This is t rue because before PDS has been im plem ent ed, t her e is no scrap m onit oring. Scrap ar e being produced all t he t im e, but are hidden because scrap value are not t urned int o value t hat are quant it at ive such as value for m on ey.
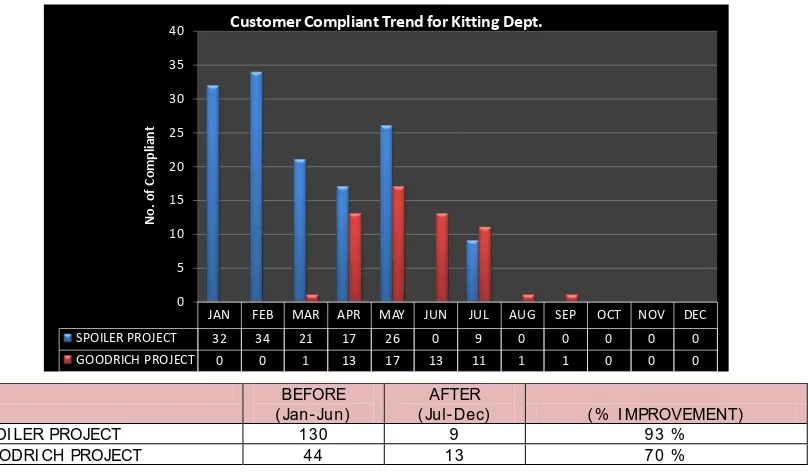
Ther e ar e m ainly t w o cat egories of cust om er com plaint w hich are Spoiler and Goodrich pr oj ect s. As for spoiler pr oj ect , 1st h alf of t he y ear show s t hat cust om er com plaint from lay- up depart m ent ar e as high as 130 com plaint s and for Goodrich proj ect 44 com plaint s have been report ed. The 2nd half show ed t he com plaint dropped dram at ically, for Spoiler pr oj ect only 9 com plaint s and Goodrich only 13 com plaint s. Cust om er com plaint have been a m aj or issue for kit t ing depart m ent , t hey cust om er w hich is lay - up alw ays sending com plaint saying t hat m at erial is m issing from t he final packaging produced by kit t ing depart m ent . Group leader from lay- up can be seen fr equent ly com e t o kit t ing depart m ent asking for t he replacem ent ply t hat ar e m issing.
Cust om er com plaint m easuring m echanism im prov em ent
BEFORE ( Jan- Jun)
AFTER
( Jul- Dec) ( % I MPROVEMENT)
SPOI LER PROJECT 130 9 93 %
GOODRI CH PROJECT 44 13 70 %
Figur e 8. “ Per cent age of im pr ovem ent for Cust om er Com plaint PM” .
JAN FEB MAR APR MAY JUN JUL AUG SEP OCT NOV DEC
SPOILER PROJECT 32 34 21 17 26 0 9 0 0 0 0 0
GOODRICH PROJECT 0 0 1 13 17 13 11 1 1 0 0 0
0 5 10 15 20 25 30 35 40
N
o
.
o
f
C
o
m
p
li
a
n
t
[image:18.595.105.509.470.706.2]The pr oblem occur w hen st acking is done by operat or s, hum an fact or involves in calculat ing t he ply quant it y, alt hough kit t ing prov ed t hat all t he quant it y dem anded are pr operly supplied and no m issing ply, but t he pr oblem st ill occur w hen pr oduct reach at lay- up. PDS provides count er- m easur e w hich is do 100% inspect ion on produced ply, im plem ent check - list , m issing log book ar e pr operly placed, and t he m ost successful idea is Just in Tim e ( JI T) , each finish product w ill have it s color coded v erificat ion not ify t hat t he dat e of t h e product produced. Lay - up invent ory w ill have no excessive m at erial, and no m isused act ions such as t aking ext ra ply from t he m at erial reservoir due t o supply t he m at erial j ust in t im e, w hen t he product is needed at t h at t im e. This is w hy, figure 8 can show ed t hat 2nd half of t he year show ing t hat spoiler proj ect have lit t le com plaint , j ust 9 com plaint s ( 93.1% ) im prov em ent , w hich is a high achievem ent have been m ade.
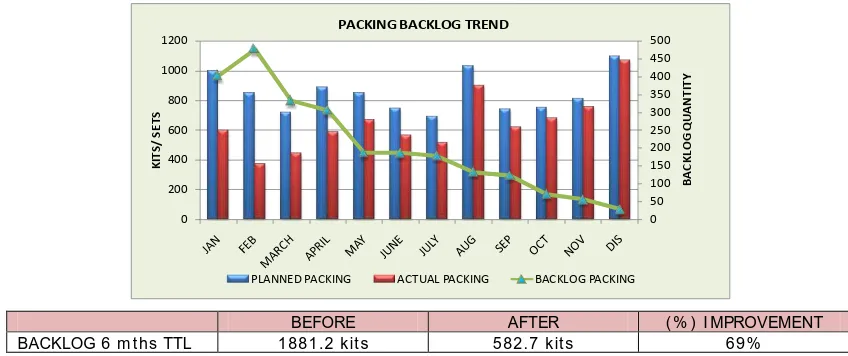
Nest ing is a process w her eby pr epr eg are cut int o sm aller pieces w it h different shapes and sizes. Each product w ill have it s ow n nest ing t o be cu t . Aft er t h e prepreg hav e undergon e t he nest ing process, t he next process is st ack ing process; her e pr epr eg t hat hav e been cut w ill be arran ged according t o t heir kit s or set s. The last process it w ill undergo is t he packing process, her e kit s t hat have don e will be placed int o a w at erproof plast ic bag and w ill be sealed t o pr ev ent m oist ure from ent ering t he packing. Nest ing is a process don e by m achines w hile bot h st acking and packing is done by m anually by operat ors. Figure 9A, 9B, and 9C show s backlog t hat happened in t he t hree ( 3) processes. Backlog is t he quant it y t hat cannot m eet t he dem an d.
Backlog m easu ring m echanism im provem ent
0 50 100 150 200 250
0 200 400 600 800 1000 1200 1400 1600
B
A
C
K
LO
G
Q
U
A
N
T
IT
Y
P
LY
NESTING BACKLOG TREND
BEFORE AFTER ( % ) I MPROVEMENT
BACKLOG 6 m t hs TTL 494 ply 155.4 ply 68%
Figur e 9A. “ Per cent age of im pr ovem ent for nest ing backlogs” .
BEFORE AFTER ( % ) I MPROVEMENT
BACKLOG 6 m t hs TTL 616.9 KI TS 226.3 KI TS 63%
Figur e 9B. “ Per cent age of im pr ovem ent for st acking backlogs” .
BEFORE AFTER ( % ) I MPROVEMENT
BACKLOG 6 m t hs TTL 1881.2 k it s 582.7 k it s 69%
Figur e 9C. “ Per cent age of im pr ovem ent for packing backlogs” .
Nest ing process show s t hat aft er m achine m aint enance hav e been done frequ ent ly, less st op t im e have been recorded for all 4 m achines. This is t rue for t he OEE st op t im e, t he st op t im e have been r educed in par w it h m aint enance of m achines. Nest ing process show s posit ive im provem ent w hich 494 nest ing are recorded and aft er PDS is been im plem ent ed t o reduce backlog, t he value drops t o only 155.4 nest ing, t his have caused an im provem ent of 68% . St acking and Packing process also show s t he im provem ent t r end of 63% and 69 % on each.
0 20 40 60 80 100 120 140 160 0 200 400 600 800 1000 1200 B A C K LO G Q U A N T IT Y K IT S / S E T S
STACKING BACKLOG TREND
PLANNED STACKING ACTUAL STACKING
0 50 100 150 200 250 300 350 400 450 500 0 200 400 600 800 1000 1200 B A C K LO G Q U A N T IT Y K IT S / S E T S
PACKING BACKLOG TREND
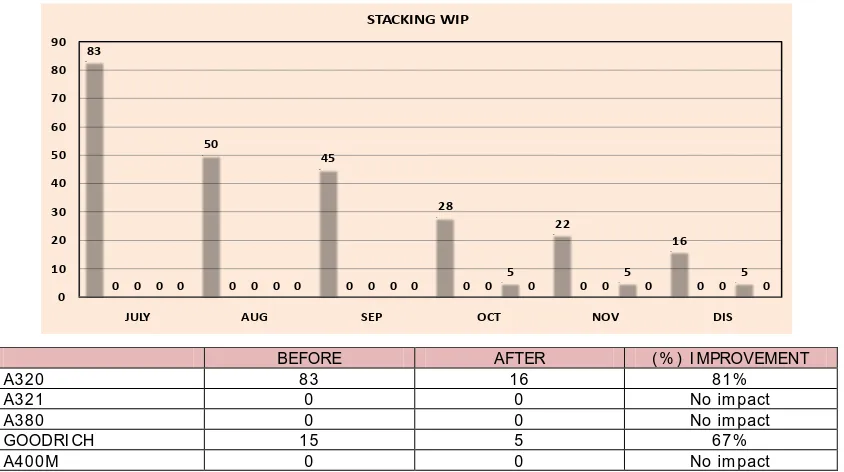
[image:20.595.86.509.164.341.2] [image:20.595.83.507.377.555.2]Figure 10, clearly show s t hat no dat a hav e been collect ed fr om Jan 2 007 t ill June 2007. The reason w hy no dat a has been recorded is because WI P m easuring m echanism only st art ed fr om July 2007. Dur ing t he 1st six ( 6) m ont hs, kit t ing depart m ent do not m onit or t heir WI P level in neit her st acking or packing processes. These causes high overt im e level due t o t h e need of redu cing t hose WI P invent ory. Aft er PDS has been im plem ent ed, t he need of m onit oring t he WI P has been highlight ed.
WI P m easu ring m echanism im pr ov em ent
BEFORE AFTER ( % ) I MPROVEMENT
A320 83 16 81%
A321 0 0 No im pact
A380 0 0 No im pact
GOODRI CH 15 5 67%
A400M 0 0 No im pact
Figur e 10. “ Per cent age of im pr ovem ent for St acking WI P PM” .
During each shift befor e t he shift ends; t eam leader w ill count t he WI P invent ories t hat are left at t he st acking and packing process. Du ring m onit oring, only t w o proj ect s w er e discovered t hat hav e cont ribut ed t o WI P, w hich is A320 and Goodrich proj ect . This is predict able as t hese ar e t he m ost com m on t w o proj ect s t hat ar e produced. Th e com pany do not r eceive const ant dem and from t heir cust om er m ont hly, t his have caused such high WI P for Goodrich proj ect fr om m ont h Oct ober t ill Decem ber . As a sum m ary, PDS have highlight ed t o kit t ing depart m ent t hat WI P m onit oring is crucial and t hat is w hy t his WI P m easuring syst em has been set up and t he im pact will be less WI P, r educed operat ing cost , r educe invent ory , r educe ov ert im e, and on- t im e delivery. Rat her t han st acking WI P, t her e is only S91 m achine t hat cont ribut ing t he WI P, w hile packing WI P happens at all four
83
50
45
28
22
16 0 0 0 0 0 0 0 0 0 0 0 0 0 0 0
5 5 5
0 0 0 0 0 0
0 10 20 30 40 50 60 70 80 90
JULY AUG SEP OCT NOV DIS
m achines. This is because packing done by operat or s and t he cycle t im e different from each packing proj ect . Hum an err or fact or also cont ribut es t o t he WI P. Miscalculat ion is one of t he issue faced by packing, t his causes t rackback t im e losses t o recover t hose m issing kit s from st acking. This problem also w ill cont ribut e t o WI P. The sam e st acking WI P sit uat ion, as show n on figure 11, w ill repeat as WI P for Goodrich w hen t he dem and is high.
DCS 1 Base ( JULY)
End ( DEC)
( % )
I MPROVEMENT
DCS 2 Base ( JULY)
End ( DEC)
( % )
I MPROVEMENT
A320 1003 169 83% A320 391 64 84%
A321 10 6 40% A321 0 0 0%
A380 0 0 0% A380 9 0 100%
GOODRI CH 36 10 72% GOODRI CH 80 13 84%
A400M 0 0 0% A400M 12 0 100%
DCS 3 Base ( JULY)
End ( DEC)
( % )
I MPROVEMENT
S91 Base
( JULY) End ( DEC)
( % )
I MPROVEMENT
A320 543 141 74% A320 84 20 76%
A321 0 0 0% A321 0 0 0%
A380 0 0 0% A380 0 0 0%
GOODRI CH 45 15 67% GOODRI CH 59 5 92%
A400M 0 0 0% A400M 0 0 0%
Figur e 11. “ Per cent age of im pr ovem ent for Packing WI P PM” .
As a sum m ary , PDS have highlight ed t o kit t ing depart m ent t hat WI P m onit oring is crucial and for t his WI P m easuring have been set up and t he im pact w ill be less WI P, r educed oper at ing cost , r educe invent ory, r educe ov ert im e, and on- t im e delivery.
PACKING WIP MEASURING MECHANISM
0 200 400 600 800 1000 1200
JULY AUG SEP OCT NOV DIS
PL
Y
MONTH
DCS 1 PACKING WIP
A320 A321 A380 GOODRICH A400M 0 50 100 150 200 250 300 350 400 450
JULY AUG SEP OCT NOV DIS
K IT S/ SET S MONTH
DCS 2 PACKING WIP
A320 A321 A380 GOODRICH A400M 0 100 200 300 400 500 600
JULY AUG SEP OCT NOV DIS
K IT S/ SET S MONTH
DCS 3 PACKING WIP
A320 A321 A380 GOODRICH A400M 0 10 20 30 40 50 60 70 80 90
JULY AUG SEP OCT NOV DIS
K IT S/ SET S MONTH S91 PACKING WIP
[image:22.595.88.510.227.611.2]Figure 12 show s before PDS w as im plem ent ed, t he at t endance before Jun 90.75% is and aft er PDS w as im plem ent ed, t he at t endance is seen w it h 98.6% im provem ent . This cause a posit ive im provem ent of 7.96% , w hich clear ly show s a t rend, w hich is aft er PDS is been im plem ent ed, absent eeism is Low fr om July. Problem such as em ergency leave, unpaid leave and annual leave ar e considerably high befor e Jun. PDS is aim ed t o increase people involvem ent in problem solving and at t endance t r end chart show s a posit ive value w hich can be said t hat people in kit t ing depart m ent ar e not r esist ing t he change especially, t he operat or s.
At t endance m easu ring m echanism im provem ent
BEFORE ( JAN- JUN) AFTER ( JUL- DEC) ( % ) I MPROVEMENT
Man hour s 90.75% 98.60% 7.96%
Figur e 12. “ At t endance Measur ing Mechanism Tr end and I m pr ovem ent Per cent age” .
As for t his, kit t ing depart m ent has st art ed t o im plem ent few schem es by rew arding syst em t o increase t he at t endance rat e and m ot ivat ion rat e of it s em ployee. Suggest ions are m ade on giving t oken w it h cert ificat e not ifying t hat an em ployee has achieved it s out st anding perfor m ance. Suggest ion is also been m ade t o increase allow ance t o RM50 per m ont h. Ot her count erm easu re applied is t o lim it t w o leave only per day by kit t ing st aff.
Because of t he posit ive im provem ent in t he absent eeism aspect at t he Kit t ing Depart m ent , t he ov ert im e levels ar e obviously cont rolled as show n in Figure 13. Overt im e m easuring m echanism im pr ov em ent
JAN FEB MARCH APRIL MAY JUNE JULY AUG SEP OCT NOV DEC
Standard Man Hours 6925.3 6185.8 4963.8 4646.9 7357.3 6177 5866.3 8649.6 5797 6707.1 7122.8 7122.8 Actual Man Hours 5825.3 5413.6 4462.95 4250.24 6677 5609.7 5500.5 8550.91 5675.7 6628.18 7022.3 7022.3 Man Hours (%) 84.1 87.52 89.91 91.46 90.75 90.81 93.76 98.86 97.9 98.82 98.6 98.6
Company KPI (92%) 92 92 92 92 92 92 92 92 92 92 92 92 75.0 80.0 85.0 90.0 95.0 100.0
0.0 1000.0 2000.0 3000.0 4000.0 5000.0 6000.0 7000.0 8000.0 9000.0 10000.0
P
e
rc
e
n
ta
g
e
(
%
)
A
x
is
T
it
le
Ov ert im e ar e caused by WI P and also backlog. Kit t ing Depart m ent has set t h eir 2007 KPI goals for ov ert im e t o 12% . Befor e PDS had been im plem ent ed, t he ov ert im e percent age for first 6 m ont hs w as 62 % and aft er it is being im plem ent ed, t he rat e dr opped t o 38 % for follow ing 6 m ont hs. This due t o t he im plem ent at ion of WI P and backlog m onit oring by PDS. Bot h t he m easuring m echanism s have highlight ed t he Kit t ing Depart m ent on t heir pr oblem , so t hat each day, t hey w ill reduce t h e WI P and backlog as m u ch as possible. This has cont ribut ed t o t he posit ive im provem ent of t he overt im e t o 23 % .
BEFORE ( JAN- JUN) AFTER ( JUL- DEC) ( % ) I MPROVEMENT
OVERTI ME 62% 38% 23%
Figur e 13. “ Per cent age of im pr ovem ent for Over t im e PM” .
The Com pany has im plem ent ed t heir Tot al Pr oduct ive Maint enance ( TPM) t o all m achines t hat are available. The problem s are t hat kit t ing depart m ent OEE calculat ions are differ ent from OEE calculat ion from SDD w hich is a depart m ent t hat are responsible t o cr eat e a st andard OEE for t he w h ole com pan y. PDS hav e adopt ed OEE calculat ions t hat are used w idely around t he globe. To achieve accept able OEE st andar d, t he OEE follow t he st andard of 85 % and above for w orld class st andard. Based on t he percent age of im prov em ent as in Figure 14, all four m achines haven’t r each ed w orld class st andard yet as m achine DCS 1 w it h 83% , DCS 2 m achine w it h 82% , DCS 3 m achine 83% and last ly S91 m achine w it h 80% . Curr ent ly t he level is abov e sat isfied level only, m ore im provem en t need t o be done t o im prov e t h e ut ilizat ion of each m achine. I n t erm s of percent age of im provem ent , all four m achines show posit ive im provem ent aft er PDS w as OEE m easuring m echanism im pr ov em ent
JAN FEB MARCH APRIL MAY JUNE JULY AUG SEP OCT NOV DEC
Standard Man Hours 6925.3 6185.8 4963.8 4646.9 7357.3 6177 5866.3 8649.6 5797 6707.1 7122.75 7122.75
Overtime Man Hours 809.5 706.5 652 452.5 604.0 458 391.5 441 267 525 528 474
Overtime (%) 11.69% 11.42% 13.14% 9.74% 8.21% 7.41% 6.67% 5.10% 4.61% 7.83% 7.41% 6.65%
Company KPI (12%) 12 12 12 12 12 12 12 12 12 12 12 12
0.00% 2.00% 4.00% 6.00% 8.00% 10.00% 12.00% 14.00%
0 1000 2000 3000 4000 5000 6000 7000 8000 9000 10000
A
xi
s
Ti
tl
e
[image:24.595.88.514.267.469.2]im plem ent ed w hereby m achine DCS 1 ( 15% ) , DCS 2 ( 13% ) , DCS 3 ( 38% ) and S91 ( 16% ) show im provem ent s. I n sum m ary, all m easuring m echanism indicat es posit ive im provem ent w hich can been seen befor e and aft er PDS has been im plem ent ed in kit t ing depart m ent . Few per for m ance m easu rem en t s t hat had never been not iced by k it t ing depart m ent t o m onit or have been highlight ed by PDS t o st art m onit oring. Kit t ing depart m ent has benefit ed from few perform ance m easur em ent s such as t he backlog m easuring m echanism and WI P m easuring m echanism .
DCS 1 BEFORE AFTER ( % )
I MPROVEMENT
DCS 3 BEFORE AFTER ( % )
I MPROVEMENT PROD TI ME
%
67.7 82.8 18% PROD TI ME %
45.2 82.9 45%
STOP TI ME %
9.0 8.6 4% STOP TI ME %
7.7 7.5 2%
DOWN TI ME %
10.6 8.0 24% DOWN
TI ME %
9.2 7.5 19%
LOOSES TI ME %
13.3 0.5 96% LOOSES TI ME %
5.1 2.0 61%
OEE % 67.6 82.8 18% OEE % 45.2 82.9 45% DCS 2 BEFORE AFTER ( % )
I MPROVEMENT
S91 BEFORE AFTER ( % )
I MPROVEMENT PROD TI ME
%
69.9 82.4 15% PROD TI ME %
64.2 80.3 20%
STOP TI ME %
8.7 8.0 8% STOP TI ME %
11.2 8.2 27%
DOWN TI ME %
10.4 8.7 16% DOWN
TI ME %
12.8 9.6 25%
LOOSES TI ME %
11.1 0.9 92% LOOSES TI ME %
11.8 1.8 85%
OEE % 69.9 82.4 15% OEE % 64.2 80.3 20%
Figur e 14. “ Per cent age of im pr ovem ent for OEE PM” .
JAN FEB MAR APR MAY JUN JUL AUG SEP OCT NOV DIS
LOOSES TIME % 46.5 9.5 9.2 3.2 4.9 6.6 1.0 0.4 0.6 1.0 0.0 0.3
DOWN TIME % 7.0 16.6 9.1 12.5 8.8 6.6 8.8 8.8 7.8 7.2 8.8 7.1
STOP TIME % 7.2 9.1 8.2 10.5 9.5 9.5 9.5 9.5 9.5 9.5 8.5 5.4
PROD TIME (OEE %) 39.5 64.8 73.6 74.1 76.8 77.3 80.9 81.7 81.9 82.0 83.0 87.5 0% 10% 20% 30% 40% 50% 60% 70% 80% 90% 100% %
DCS-1 OEE TREND
JAN FEB MAR APR MAY JUN JUL AUG SEP OCT NOV DIS
LOOSES TIME % 46.3 2.4 8.9 3.6 3.2 2 1.9 1.3 0.15 0.5 1.2 0.3
DOWN TIME % 6.5 18.8 9.8 9.8 9.1 8.75 9.3 8.8 8.75 8.0 8.8 8.8
STOP TIME % 7.5 10.5 10.8 7.5 7.5 8.5 7.5 8.5 9.5 8.5 6.4 7.5
PROD TIME (OEE %) 40.6 68.0 70.5 79.6 79.8 80.925 81.0 81.1 81.98 83.0 83.5 83.8 0% 10% 20% 30% 40% 50% 60% 70% 80% 90% 100% %
DCS-2 OEE TREND
JAN FEB MAR APR MAY JUN JUL AUG SEP OCT NOV DIS
LOOSES TIME % 0.0 0.0 10.6 9.1 8.3 2.6 5.9 3.7 1.1 0.0 0.8 0.4
DOWN TIME % 0.0 0.0 26.1 9.8 8.8 10.8 8.0 9.8 8.8 8.8 6.8 3.0
STOP TIME % 0.0 0.0 14.5 12.5 10.5 8.5 7.5 7.5 7.5 7.8 7.5 7.5
PROD TIME (OEE %) 0.0 0.0 48.9 68.9 75.5 78.1 78.7 79.2 82.2 83.8 84.8 88.6 0% 10% 20% 30% 40% 50% 60% 70% 80% 90% 100% %
DCS-3 OEE TREND
JAN FEB MAR APR MAY JUN JUL AUG SEP OCT NOV DIS
LOOSES TIME % 26.0 12.7 10.1 7.7 7.7 6.6 2.6 3.0 2.8 0.3 0.5 1.4
DOWN TIME % 10.8 12.8 17.0 15.8 9.8 10.8 11.0 9.8 8.8 9.6 8.9 9.8
STOP TIME % 7.5 17.5 14.5 10.5 9.5 7.5 9.5 9.5 9.5 7.8 7.5 5.3
PROD TIME (OEE %) 56.0 56.9 58.6 65.8 72.8 75.1 76.5 77.4 79.3 82.5 82.9 83.3 0% 10% 20% 30% 40% 50% 60% 70% 80% 90% 100% %
[image:25.595.91.509.266.730.2]5 .3 Se con d a r y da t a
The follow ing discussion is m ade based on t he secondar y dat a, w hich will be reflect ed t o lean goals set by t h e cust om er s.
The m ain purpose of m easur em ent is t o det ect t he rat e of defect part s per m illion. I n kit t ing depart m ent Leans goals Do it Right First Tim e ( DRFT) is used t o m easu re defect s occur ring w it hin t he pr oduct ion processes w hich also kn ow n as ‘I nt ernal m easur em ent ’. At t heir ext ernal cust om er, t he com panies m anage t o im plem ent DRFT int o t heir syst em . I t is im port ant for kit t ing depart m ent t o know it s DFRT because it ’s relat ed t o cust om er sat isfact ions. Low defect m eans lay - up depart m ent w ill receive higher qualit y kit s or set s, and t her e w ill be less int erru pt ion t o t he product ion flow .
Leans goals ( Do it Right First Tim e)
DCS 1 JULY AUG SEP OCT NOV DI S
DFRT QUANTI TY ( unit )
36394 13121 8808 3178 0 0
DFRT ( % ) 3.64 1.31 0.88 0.32 0 0
Figur e 15. “ Relat ionship of DRFT wit h pr oduct qualit y” .
From figure 15, DCS 1 m achine show s t hat in t he m ont h of July, it produced 3.64% of defect s, w hich is account ed for an am ount of 33 unit s of ply, if convert t o part s
JULY AUG SEP OCT NOV DIS
Defective Quantity 32.5 14 13 3 0 0
DFRT (%) 3.64 1.31 0.88 0.32 0.00 0.00
0.00 0.50 1.00 1.50 2.00 2.50 3.00 3.50 4.00 0 5 10 15 20 25 30 35 P e r c e n t a g e K IT S / S E T S
DCS 1 (DO IT RIGHT THE 1ST TIME)
JULY AUG SEP OCT NOV DIS
Defective Quantity 8.5 7 25.5 12 0 0
DRFT (%) 0.76 0.56 1.77 1.27 0.00 0.00
0.00 0.20 0.40 0.60 0.80 1.00 1.20 1.40 1.60 1.80 2.00 0 5 10 15 20 25 30 P e r c e n t a g e K IT S / S E TS
DCS 2 (DO IT RIGHT THE 1ST TIME)
JULY AUG SEP OCT NOV DIS
Defective Quantity 13 14.3 4.5 0 0 0
DFRT (%) 1.13 1.23 0.31 0.00 0.00 0.00
0.00 0.20 0.40 0.60 0.80 1.00 1.20 1.40 0 2 4 6 8 10 12 14 16 P e r c e n t a g e K IT S / S E T S
DCS 3 (DO IT RIGHT THE 1ST TIME)
JULY AUG SEP OCT NOV DIS
Defective Quantity 11 15 6 0.8 0 0
DRFT (%) 3.27 4.16 1.32 0.28 0.00 0.00
0.00 0.50 1.00 1.50 2.00 2.50 3.00 3.50 4.00 4.50 0 2 4 6 8 10 12 14 16 P e r c e n t a g e K IT S / S E T S
[image:26.595.90.507.377.682.2]per m illion, it will produced an am ount of 36394 of ply. From m ont h July t o Decem ber, t he t r end of DRFT show s t h e am ount of defect drops by t im e ( t rend going dow n) w hich is a posit ive sign of kit t ing depart m ent producing qualit y part s for it s cust om er w hich is lay - up depart m ent . By t he m ont h Nov and Dec, no defect s are being det ect ed. As a sum m ary DRFT has helped kit t ing depart m ent t o help im prove it s overall qualit y, cost and deliver.
People pr oduct ivit y is based on lean goals, w hich is show n in figure 16. I t is t he m easur es of proport ion of t im e spend adding value t o t he conv er sion process of raw m at erial t ransfor m ed int o product . Kit t ing depart m ent have realized t hat People Pr oduct ivit y m easuring can encourage t hem t o cont inuous focus on k ey elem ent of pr oduct cost , st im ulat e act ions t o reduce pr ocessing t im e, and reduce w ast eful w ork in order t o produce high am ount of pr oduct in an efficient m anner of t im e. From t he chart , t h e t r end of people produ ct ivit y is fluct uat ing all t he t im e, up and dow n all t he t im e.
Lean goals ( people pr oduct ivit y)
MONTH JAN FEB MARCH APRI L MAY JUNE JULY AUG SEP OCT NOV DI S Num ber of
wor k ing day 29.0 22.0 24 22 30 24 24 30 25 26 22 24
No. of m an 6 6 6 6 6 5 4 3 3 3 3 3
No. un it s
m ade 798.3 881.7 975.2 706.6 977.6 758 732 956.5 673.5 626.8 782.25 1028.75 Man hour s 2523 1914 2088 1914 2610 1740 1392 1305 1088 1131 957 1044 Pr oduct iv it y
% 40% 46% 47% 37% 37% 44% 53% 73% 62% 55% 82% 99%
Figur e 16. “ Relat ionship bet ween t im e and unit s pr oduced ( People product ivit y) ” .
The m ain purpose is t o achieve higher percent age of product ivit y, if possible, a rat io of should be m or e t han 100 % . Kit t ing depart m ent pr oduct ivit y is high, not
0% 10% 20% 30% 40% 50% 60% 70% 80% 90% 100%
0 500 1000 1500 2000 2500 3000
JAN FEB MARCH APRIL MAY JUNE JULY AUG SEP OCT NOV DIS
STACKING AREA PRODUCTIVITY
[image:27.595.93.509.416.683.2]ev en half, t his m eans m any w ast e occu r, part produced w it h t he t im e allocat ed is not fully ut ilize. Kit t ing depart m ent n eeds t o im prov e it s product ivit y in order t o cont r ol people cost associat ed w it h m anufact uring.
St ock t urn rat io can reveal t he level of cont r ol t hat kit t ing depart m ent has of t he process, because t ight ly cont r olled process display low values of raw m at erial and WI P. By cont rast , poorly cont rolled processes involve m ore w ork in pr ogr ess ( WI P) in order t o accom m odat e t he variat ions in t he process.
Lean goals ( st ock t u rn)
M ON TH JAN FEB MARCH APRI L MAY JUNE JULY AUG SEP OCT NOV DI S
N o. u n it s
m a d e 798 882 975 707 978 758 732 957 674 627 782 1029
W I P 100 67 80 73 75 65 88 50 45 22 16 28
Fin ish
g ood s 808 1017 1098 1052 1062 846 978 935 797 703 795 653
W I P+ Fin ish
g ood s 908 1084 1178 1125 1137 911 1066 985 842 725 811 681
St ock t u r n s 0.88 0.81 0.83 0.63 0.86 0.83 0.69 0.97 0.80 0.87 0.96 1.51
Figur e 17. “ St ock t ur n on Kit t ing depar t m ent invent or y” .
Figure 17 show s t he curr ent sit uat ion of st ock t urn on kit t ing depart m ent invent ory. I t can be n ot iced t hat t he num ber of unit s m ade ar e low er t han t he quant it y of finish goods and WI P. The st ock t urn t rend show in red line are going up and dow n all t he t im e, t his clearly show s t hat kit t ing depart m ent have som e problem s on cont r olling it s process. Meanw hile fr om t he graph, it is not iced t hat t he st ock t urn rat io are low , low er t han 1.0. During t he t im e t his st udy is conduct ed, kit t ing depart m ent has been t rying t o im plem ent Kanban superm ark et , t o cont r ol t heir process so t hat no ov erpr oduct ion is done. Kit t ing depart m ent hopes by im plem ent ing kanban superm ark et t h e st ock t urn rat io w ill be high.
0.00 0.20 0.40 0.60 0.80 1.00 1.20 1.40 1.60
0 200 400 600 800 1000 1200 1400
JAN FEB MARCH APRIL MAY JUNE JULY AUG SEP OCT NOV DIS
R
AT
IO
STACKING AREA STOCK TURNS
[image:28.595.89.510.291.556.2]Delivery Schedule Achiev em ent s ( DSA) m easures how w ell kit t ing depart m ent m at ches t h e planned deliveries requirem ent of t he cust om ers. Lat e deliveries are regarded as failures com pared t o t h e planned delivery sch edule. Kit t ing depart m ent sees t hat DSA w ill aid t hem in m at ch t he planned deliveries sch edule by pr ev ent ing lat e deliveries, elim inat ing fact ors t hat cont ribut e t o part deliveries.
Leans goals ( Delivery Schedule Achiev em ent )
MONTH JAN FEB MARCH APRI L MAY JUNE JULY AUG SEP OCT NOV DI S PLANNED 935 797 1098 846 978 1062 1017 653 703 808 1052 653 LATE
DELI VERI ES 136 91 122 88 96 84 61 26 29 25 23 26 DSA 0.85 0.89 0.89 0.90 0.90 0.92 0.94 0.96 0.96 0.97 0.98 0.96
[image:29.595.91.510.240.482.2]Figur e 18. “ Deliver y Schedule Achievem ent on kit t ing depar t m ent invent or y” .
Figure 18 abov e show s t he DSA rat io from t he m ont h January t ill Decem ber 2007 and a good DSA value w as achieved, m ost of t he t im e 0.90 and above, and t he st andard DSA value is 1.0. Th ose figures have proved t hat kit t ing depart m ent m anages t o deliver t heir product m ost of t he t im e on t im e. The t rend of DSA going up and dow n is not a m aj or pr oblem as ev er y m ont h t he planned deliveries are different fr om ot her m ont hs.
0.78 0.80 0.82 0.84 0.86 0.88 0.90 0.92 0.94 0.96 0.98 1.00
0 200 400 600 800 1000 1200
JAN FEB MARCH APRIL MAY JUNE JULY AUG SEP OCT NOV DIS
STACKING BACKLOG
Leans goals ( floor space ut ilizat ion)
Be for e Aft e r
Figur e 19. “ Floor spaced fr eed for Value added act ivit y” .
Tooling depart m ent need an ar ea for t he air pad process. Kit t ing depart m ent has given half of JI T super m ark et ar ea t o t ooling depart m ent . Th ese reduce space and m axim ize exist ing space usage for JI T super m ark et purpose. Reduct ion on floor space is 55.06 m2 and t ot al area of kit t ing depart m ent is 1096 m2 w hich lead t o t he im provem ent ar ound 5% w as achiev ed for y ear 2007.
Value Added per Per son ( VAPP) , is a financial m easur e t hat r elat es t he num ber of direct people involved in t he conv er sion process t o add value t o t h e product . Th e VAPP has a direct im pact on t h e cost s associat ed w it h a pr ocess and show s specifically how w ell people ar e used t o t ransform m at erials int o t he finished product .
[image:30.595.124.479.130.451.2]Figur e 20. “ Value Added per Per son Cost Tr end Char t ” .
The VAPP m easu re is im port ant as t he pr oduct ion process can be cont rolled t o ensur e t he m axim um different ial bet w een out put and input values. The out put and input values r eflect t he differen ce bet w een t he final value of t he end product and t he value of t he raw m at erials and ser vices used. The VAPP has a direct im pact on t he cost s associat ed w it h a process and Figure 20 show s specifically how w ell people are u sed t o t ransform m at erials int o t he finished product .
5 .4 Tot a l e m p loy e e in v olv e m e n t in PD S im p le m e n t a t ion
The graph in Figure 21, gives us an idea about differ ent t ypes of w ast ages of t he kit t ing depart m ent elim inat ed and reflect ed t o t he num ber of ideas generat ed, w her e t he w ast ages are classified int o 11 t ypes. The highest t ype of w ast e elim inat ed is relat ed t o t im e as around 50 ideas generat ed t o r educe t his w ast e. Wit hout classificat ion of any w ast age int o perform ance m easurem ent , no m onit oring can be m ade and no pr oblem solving can be done t o redu ce t h e w ast e, w hich is t he im pact of t he failure of lean process m anagem ent at Kit t ing depart m ent . I t indicat es em ployees of t he com pany hav e capabilit ies t o solve w ast e pr oblem using t he perform ance m easurem ent w hich act as t he visual indicat ors for t h em t o pract ice cont inuous im prov em ent .
Type of w ast ages elim inat ed
JAN FEB MARCH APRIL MAY JUNE JULY AUG SEP OCT NOV DIS
VperPP -67 -172 -121 -44 -44 -46 -64 2 -30 -17 3 22
-180 -170 -160 -150 -140 -130 -120 -110 -100 -90 -80 -70 -60 -50 -40 -30 -20 -10 0 10 20 30 40
R
M
R
ig
g
it
Value Added per Person Cost Trend
G
O
O
D
After PDS Implementation RM per PP improved
[image:31.595.142.456.109.344.2]Figur e 21. “ Type of wast ages elim inat ed for year 2007” .
Many st udies focus m ainly on t he cr eat ive or idea generat ion st age of pr oblem solving. I n t his cont ext , t he fact is, em ploy ees can help im prove business perform ance by solving problem s, t hr ough generat ion of ideas and use t hese ideas as building blocks for n ew er and bet t er product s, services and w ork pr ocesses. ( de Jong and Hart og, 2007)
I dea gen erat ed and lev el of involvem ent
Figur e 22. “ Level of em ployees’ involvem ent for year 2007” . Material
12%
Inventory 2%
Overproduction 2%
Labor 13%
Complexity 10%
Energy 7% Space
16% Defects
12% Transportation
2% Time 21%
Unnecessary Motion 3%
TYPE OF WASTAGE ELIMINATED FOR YEAR 2007
30 IDEAS
25 IDEAS
17 IDEAS 38 IDEAS
29 IDEAS 5 IDEAS
6 IDEAS
50 IDEAS
38 IDEAS
6 IDEAS
4 IDEAS
BOTTOM 27%
MIDDLE 9%
TOP 1% BOTTOM-MIDDLE
37% BOTTOM-TOP
1%
MIDDLE-TOP 25%
LEVEL OF EMPLOYEES INVOLVEMENT FOR YEAR 2007
35 IDEAS
38 IDEAS
139
Total # of Idea
Generated
=
Total # of Idea
Completed
=
122
1 IDEA
51 IDEAS
12 IDEAS
[image:32.595.116.484.108.310.2] [image:32.595.120.479.488.675.2]From Figure 22, t h e pie chart s show s idea had been generat ed in t he Kit t ing Depart m ent and t hat reflect s t he involvem ent of various levels. I n t he past one year a t ot al of 139 ideas had been generat ed. I t pr ov es t hat t he Kit t ing Depart m ent w as proact ively and cont inually seeking out ideas t o solve t heir problem s. This indicat es t hat t he em ployee has t he capabilit y t o solve pr oblem s, w hich m ay arise in an organizat ion, and t his becom es a cent ral t enet of lean m anufact uring’s best pr act ices ( Kerrin, 1999) .
The em ployee involvem ent s in idea generat ion ar e cat egorized according t o t he t hree m ain levels w hich are t op, m iddle and bot t om m anagem ent . The highest cont ribut ions cam e fr om t he bot t om level em ployees w hich are 38 ideas, and it is follow ed by t he m iddle lev el w it h 12, w hile t he t op level em ployees cam e up w it h 2 ideas. Beside t his, t her e is also com binat ion of levels in idea generat ion. That is, em ployees from Bot t om - m iddle level m anagem ent level cam e up wit h 52 ideas, m iddle- t op is 35 and bot t om - t op is 1. Furt her m or e, t he t ot al ideas generat ed by t he group com binat ion are 87 and t he ideas fr om single level are 52. Percent age for com binat ion level is 63% out of t he t ot al ideas gen erat ed and 3 t ype levels is 37% . How ev er , if w e com pare t he 2 gr oups, t he result show s t hat t ot al ideas generat ed by t he group com binat ion level are 35 m ore t han t he t ot al ideas generat ed by single em ployees. Thus, t he r esult indicat es t he im port ance of t eam w ork at t he bot t om , t he m iddle and t he t op m anagem ent in bot h sharing as w ell as applying know ledge for t he generat ion of ideas t o solve t he problem s. ( Delbridge, 1998)
I n gen eral, Figure 23, lean t ools for Kit t ing Depart m ent ar e cat egorized int o nine kinds such as 5S, Tot al Product Maint enance, Kaizen, Value St ream Mapping, Visual I ndicat or, Just I n Tim e, St andard Work Chart . Most com m on t ool used by Kit t ing Depart m ent is t he TPM or Tot al Produ ct Maint enance, w hich is 62 t im es, follow ed by 5s, w hich is pract iced 55 t im es, an d t he m ean values of using lean t ool are 21 t im es. I n order t o int roduce lean t hinking wit hin t he m anufact uring environm ent s, t he philosophy relies on t he ident ificat ion and elim inat ion of t he w ast e problem , w hich m ust have been effect ively t arget ed and applied t he various lean t ools (
Lean t ools used in pr oblem solving ( r eflect on cross funct ionalit y and sk ill m at rix)
problem . So, w e can conclude t hat em ployee have t he capabilit y of problem solving by ut ilizing t he lean t ools.
Figur e 23. “ Lean Tools used in pr oblem solving” .
Wit h t he im plem ent at ion of PDS it w as ident ified t hat people’s know ledge and skills are lim it ed t o t he t ask or funct ion t hey are t rained w hich have lim it ed t he cross-funct ional capabilit ies of t he shop floor em ployees. Thr ough PDS, Team m em ber s have dev eloped t he Skills Mat rix com pet ency chart t o ident ify each em ployee capabilit ies in PDS I m plem ent at ion. Aft er t he skills developm ent w er e init iat ed by t he t eam m em bers t hey have n ecessar y capabilit ies t o perform cross funct ional act ivit ies w hich have t he flexibilit ies required in Lean Pr ocess Managem ent s. Wit h cr oss funct ional capabilit ies t he m em ber s also developed t heir pr oblem solving capabilit ies w it h bet t er underst anding of t he processes and funct ions in t he shop floor t o ident it y w ast e and w or k out solut ions.
Befor e PDS w as int roduced, em ployee skills base on operat ional & funct ions w it h m inim um need t o know basis for Managem ent t o Shop floor em ployees. Not all em ployees in t he select ed depart m ent w ere select ed t o part icipat e and developed w it h necessary t raining. PDS int roduced all t he em ployees involved in t he im plem ent at ion of LPM w it h PDS wit h all t he necessary t raining and skills dev elopm ent t o dev elop t he problem solving of t he em ployee’s. Wit h t his done, t he em ployee’s n ot only ex ceeded t he h ours of per em ploy ee and also h ave received very good cooperat ion and com m it m ent by all em ployees in t he depart m ent and support depart m ent s. The t raining on Team developm ent and t eam w orking have
5S 29%
TPM 33% Kaizen
14% Std. Work
12% VSM
2% TQA
4% SMT
6%
Visual Indicator 7%
JIT 1%
LEAN TOOLS & TECHNIQUES USE FOR YEAR 2007
4 IDEAS 8 IDEAS
11 IDEAS
55 IDEAS 2 IDEAS
12 IDEAS
62 IDEAS 27 IDEAS
[image:34.595.119.479.155.351.2]helped t he t eam m em ber s in learning and applying t he various pr oblem solving t ools in m onit oring and w or king out solut ions. Aft er PDS im plem ent s Managem ent s com m it m ent skills developm ent s w it h t he necessary know ledge and skills clearly evident w her e t he t ot al hours per em ployee have significant ly increased exceeding t he goal t hey hav e set .
Cost saving is an im port ant st andard t o indicat e t he pr oblem solving capabilit y of t he organizat ion, especially t he w or kers. The aim of lean m anufact uring is elim inat ion of w ast e in ev ery area of product ion and it includes cust om er r elat ions, product design, supplier net w or ks, and fact ory m anagem ent . To m eet t he obj ect ives of saving cost and t her eby incor porat e lean pr ocess m anufact uring, Kit t ing Depart m ent has begun a Kaizen Proj ect in 2007 and t he t ot al cost s saved w hile reducing t he w ast ages in past one year is RM1, 952,617.98 ( Table 2) . Thus, achievem ent of cost sav ing for a com pany indicat es t hat t he em ployees had played a m aj or role in com ing up w it h solut ions t o solve t h e problem of w ast e. So, w e can conclude t hat pr oblem solving capabilit y of em ployee act ually has a significant im pact on cost savings. The Table 3, indicat es t he t ot al cost savings of t he Kit t ing Depart m ent w it h t he refer ence t o t heir Kaizen proj ect , w hich is generat ed fr om t he problem solving act ivit ies.
Cont inuous im pr ov em en t act ivit ies ( Kaizen and cost savings)
KI TTI N G CON TI N UOS I M PROV EM EN T PROJECTS FOR YEAR 2 0 0 7 / 2 0 0 8
2 0 0 7 2 0 0 8
REGI STERED TOTAL ( RM ) REGI STERED TOTAL ( RM )
1 . RED UCE TI M E SET UP FOR S9 1 CON TROLLER
$ 1 9 ,0 4 2 .8 0 1 . RED UCE CON SUM ABLE USAGE
$ 1 0 0 ,0 0 0
2 . JI T PROD UCTI ON PREPARATI ON
$ 1 3 6 ,9 7 3 .4 4 2 . RED UCE SPACE $ 2 0 ,0 0 0
* KANBAN REGULATOR * NESTI NG AND STI CKER
RACKS
* REDUCE PLASTI CS USAGE * JI T SUPERMARKET
* REDUCE OVERTI ME 3 . CON VERT W ALKW AY I N TO
CLEAN ROOM
$ 1 0 0 ,0 0 0
* ELI MI NATED NI GHT ALLOWANCES
* REDUCE ELECTRI CI TY USAGE
TOTAL $ 1 5 6 ,0 1 6 .2 4 TOTAL $ 2 2 0 ,0 0 0 .0 0
UN REGI STER TOTAL ( RM ) UN REGI STER TOTAL ( RM )
1 . TOOLS TROLLEY $ 1 2 7 .7 0 1 . D RY & RESI N RI CH I SSUE Under Monit or ing
2 . SPLI T AN D BATCH PAPERW ORK
$ 1 ,7 9 5 ,9 8 8 .1 6
2 . N ESTI N G I M PROV EMEN T ON A3 2 0 AN D A4 0 0 M
Under Monit or ing
TOTAL $ 1 ,7 9 6 ,1 1 5 .8 6
TOTAL
[image:35.595.89.511.489.726.2]Degr ee of leanness ( DOL) w as m easur ed as t he average of t he act ual changes t aking place as m easur ed by t he nine principles of lean m anufact uring. ( Refer t o Appendix A for Quest ionnaire) . Degr ee of m anagem ent com m it m ent ( DOC) w as m easur ed by t he lev el of invest m ent in support ing m anufact uring infrast ru ct ures, as m easu red by WEMP, TRAI N, GROUP and QLEAD. The t able 3 indicat es t he m ean and index value of DOL and DOC. The r esult s of surv ey in January 2007 indicat es t he degr ee of leanness of t h e com pany is low w it h m ean value is 2.90± 0.20. How ev er, for t he Decem ber 2007, t he m ean value is increase t o 3. 87± 0.47, t he increm ent s is 33.4 % , and becom e m oderat e level. Meanw hile, w e can see t hat w hen t he degree of m anagem ent com m it m ent is increased, t he degrees of leanness also increase. So, w e can conclude t hat t he level of m anagem ent support ing m anufact uring infrast ruct ures has been m aking t he com pany leaner. From t he r esult of t he analysis in t able 3, t he com m it m ent by Top m an agem ent for leanness in t he Kit t ing Depart m ent show s significant im provem ent . I t w as found t hat t he increm ent hav e st r ong r elat ionship wit h problem solving capabilit y of t he Kit t ing Depart m ent ’s em ployees, w hich lead t o t he achievem ent of bet t er Leanness level t hrough t he following infrast ruct ural invest m ent s. This is support ed by various research es conduct ed by r esearchers on each infrast ru ct ural invest m ent .
Degree of leanness and degr ee of m anagem ent com m it m ent sur vey r esult s
SURV EY FOCUS M ETH OD JAN 0 7
RESULTS
D EC 0 7 RESULTS
FI N D I N GS
LEAN N ESS
- degree of adopt ion ( t ot al 9 pr act ices) - suppor t ing m anufact ur ing infr ast r uct ure
• W EM P
• TRAI N
• GROUP
• QLEAD
Ave r a ge
Mean v alues ( t ot al is 4)
- 2.897
- 3.264 - 3.338 - 3.225 - 3.460
- 3.321
- 3.907
- 3.578 - 3.676 - 3.871 - 3.786
- 3.728
- 9 pr act ices of DOA all has significant incr em ent
- All got significant increase, especially GROUP,
incr em ent about 20%
TOP M AN AGEMEN T COM M I M EN T ( 6 pr a ct ice s )
Mean v alues ( t ot al is 4)
- 3.32 - 3.85
- All pr act ices has significant incr em ent , aver age
incr em ent is 16%
V a r ia ble M e a n ( JAN ) M e a n ( D EC) SD ( JAN ) SD ( D EC)
D OL 2.90 3.87 0.20 0.47
D OC 3.32 3.85 0.10 0.7
[image:36.595.86.513.476.689.2]This is support ed by various resear ch conduct ed by resear ches on each infrast ruct ural invest m ent s.
5 .5 Gr ou p pr oble m solv in g ca pa bilit ie s
Gr oup problem solving capabilit ies are r equired on t he part of t he em ployees t o w or k as t eam . Team m em bers n eed t raining in breadt h so t hat t hey can per form each ot h er s’ j obs and in dept h s