“ I hereby declare that I have read through this report entitle “Study the Characteristic of Current Distribution On Water Due To Short Medium Spark Gap” and
found that it has comply the partial fulfillment for awarding the degree of Bachelor of Electrical Engineering (Industrial Power)”
Signature : ...
Supervisor’s Name : ZIKRI ABADI BAHARUDIN
STUDY ON THE CHARACTERISTIC OF CURRENT DISTRIBUTION ON
WATER DUE TO SHORT MEDIUM SPARK GAP
MUHAMMAD SYAFIQ BIN MOHD KAMAL
A report submitted in partial fulfillment of the requirements for the degree of
Bachelor of Electrical Engineering (Industrial Power)
Faculty of Electrical Engineering
UNIVERSITI TEKNIKAL MALAYSIA MELAKA
iv
I declare that this report entitle “ Study on the Characteristic Distribution On Water Due To Short Medium Spark Gap” is the result of my own research except
as cited in the references. The report has not been accepted for any degree and is not concurrently submitted in candidature of any other degree.
Signature : ...
Name : MUHAMMAD SYAFIQ BIN MOHD KAMAL
v
ACKNOWLEDGEMENT
vi
ABSTRACT
vii
ABSTRAK
viii
TABLE OF CONTENT
CHAPTER TITLE PAGE
ACKNOWLEDGEMENT iv
ABSTRACT v
TABLE OF CONTENT vii
LIST OF TABLES xi
LIST OF FIGURES xii
LIST OF APPENDICES xv
1 INTRODUCTION 1
1.1 Motivation 1
1.2 Problem Statement 2
1.3 Objectives 2
1.4 Scope 3
2 LITERATURE REVIEW 4
2.1 Introduction 4
2.2 Current Distribution On Water Due to Lightning. 4
ix
CHAPTER TITLE PAGE
2 2.4 Electrical Discharge Application on Water Treatment 5 2.4.1 Water Electrode Ozone Generator 5
2.4. 2 A Latest Development on Water Treatment using Electrical Discharges in Water
7
2.5 Local Discharge on Wet Polluted Insulator 8
2.6 Rogowski Coil 9
2.7 Impulse Voltage Generator 10
2.7.1 Impulse Voltage 10
2.7.2 Standard Impulse Waveform 11
2.7.3 Impulse Voltage Generator 12
3 METHODOLOGY 13
3.1 Introduction 13
3.2 Project Flow Chart 14
3.3 Gathering All Related Information Regarding The Current Distribution on Water.
15
3.4 Recognized and get used with the possible experiment apparatus.
15
3.4.1 Experiment apparatus description 16 3.4.1.1 Regulating transformer 16 3.4.1.2 Single phase AC voltage test
transformer
17
3.4.1.3 HV Rectifier 17
3.3.1.4 Parallel (wave tail) resistor ( RE ) 18
3.4.1.5 Smoothing capacitor 18
3.4.1.6 Series (Wave front) Resistor 19
3.4.1.7 Sphere gap 19
3.4.1.8 Remote controlled switch (grounding switch)
x
CHAPTER TITLE PAGE
3.3.1.9 Pearson Current Monitor (Rogowski Coil)
20
3.4.1.10 Low Voltage Divider 21
3.4.1.11 Tektronik DPO4000 Mixed Signal Oscilloscope
21
3.3.1.12 DMI 551 Digital Measuring Unit 22 3.4.1.13 OT 276 Operating Terminal 23 3.5 Planning and Modeling The Experiment Design 24
3.5.1 The Experiment Design 24
3.5.2 The Water Tank 26
3.5.3 The Electrode System 27
3.5.4 Electrode Numbering 29
3.5.5 Electrode Design 29
3.6 Setup and Run An Experiment 30
3.7 Analyze The Experiment Data 33
3.8 Verification of The Experiment Result Towards Desired Project Outcome
33
3.9 Preparation for Final Report 33
4 RESULT AND DISCUSSION 34
4.1 Introduction 34
4.1 The Input Voltages 35
4.2 Input Current 36
4.3 Current Distribution Measurement Data 37
4.4 Current Tabulated at The Electrodes 38
xi
CHAPTER TITLE PAGE
4.7 Current Waveform 40
4.7.1 Tap Water Current Waveform 40
4.7.2 Saline Solution Current Waveform 44
4.8 Analysis and Discussion 48
4.8.1 The Waveform Analysis 48
4.8.2 Current Distribution Graph 49
4.8.3 The Conductivity Effect 51
4.8.4 The Distribution Analysis 52
4.8.4.1 Sprouting Distribution 52
4.8.4.2 The Distance Between Electrodes 52
5 CONCLUSION AND RECOMMENDATION 53
5.1 Conclusion 53
xii
LIST OF TABLES
TABLE TITLE PAGE
Table 2.1 Water Conductivity table 5
Table 4.1 Current Distribution Measurement Data 37
xiii
LIST OF FIGURES
FIGURES TITLE PAGE
Figure 1 Water Electrode Ozone Generator 6
Figure 2 Experiment setup for bubble on electrical discharge 7
Figure 3 Electrode system 8
Figure 4 Rogowski coil construction with electronic comparator 10
Figure 5 (a) Standard lightning impulse waveform 11
Figure 5 (b) standard switching impulse waveform 11
Figure 6 Impulse Voltage Generator Schematic 12
Figure 7 Project Flow Chart 14
Figure 8 Regulating Transformer 16
Figure 9 Single phase AC voltage test transformer 17
Figure 10 HV Rectifier 17
Figure 11 Parallel (wave tail) resistor ( RE ) 18
Figure 12 Smoothing Capacitor 18
Figure 13 Series (Wave front) Resistor 19
Figure 14 Sphere Gap 19
Figure 15 Remote controlled switch (grounding switch 20
Figure 16 Pearson Current Monitor (Rogowski Coil) 20
Figure 17 Low Voltage Divider 21
Figure 18 Tektronik DPO4000 Mixed Signal Oscilloscope 21
Figure 19 DMI 551 Digital Measuring Unit 22
Figure 20 OT 276 Operating Terminal 23
Figure 21 Experiment Design 24
Figure 22 Impulse Generator Schematic 25
Figure 23 The Implementation of Impulse Voltage Generator to the Water
xiv
Figure 24 Water Tank 26
Figure 25 The Plane Electrode Placement on the Tank 27
Figure 26 Plane electrode distance at the base of tank 27
Figure 27 Side view of the water tank 28
Figure 28 Electrode Numbering 29
Figure 29 Plane Electrode 29
Figure 30 Experiment configuration 30
Figure 31 (a) Input Voltage Waveform 35
Figure 31 (b) Input Current Waveform 36
Figure 32 Tap Water Current Tabulation 38
Figure 33 Saline Solution Current Tabulation 38
Figure 34 Samples of Electrodes 39
Figure 35 Electrode 8 Current Waveform (Tap Water) 40
Figure 36 Electrode 7 Current Waveform (Tap Water) 41
Figure 37 Electrode 6 Current Waveform (Tap Water) 41
Figure 38 Electrode 3 Current Waveform (Tap Water) 42
Figure 39 Electrode 12 Current Waveform (Tap Water) 42
Figure 40 Electrode 11 Current Waveform (Tap Water) 43
Figure 41 Electrode 19 Current Waveform (Tap Water) 43
Figure 42 Electrode 8 Current Waveform (Saline Solution) 44 Figure 43 Electrode 7 Current Waveform (Saline Solution) 44 Figure 44 Electrode 6 Current Waveform (Saline Solution) 45 Figure 45 Electrode 3 Current Waveform (Saline Solution) 45 Figure 46 Electrode 12 Current Waveform (Saline Solution) 46 Figure 47 Electrode 11 Current Waveform (Saline Solution) 46 Figure 48 Electrode 19 Current Waveform (Saline Solution) 47 Figure 49 (a) Current and Voltage at Electrode 8 (Tap Water) 48 Figure 49 (b) Current and Voltage at Electrode 8 (Saline Solution) 49
Figure 50 (a) Tap Water current distribution graph 49
Figure 50 (a) Saline Solutions current distribution graph 50 Figure 50 (a) Comparison between Tap Water and Saline Solution current
distribution
xv
LIST OF APPENDICES
1
CHAPTER 1
INTRODUCTION
1.1 Motivation
2
1.2 Problem Statement
Recently, the studies and information regarding the current distribution on water is available, but still lacking, if there are any. The focus more to the sea water current distribution analysis. Lightning strike is the common source that lead to current presence on the water, and it can caused a huge danger to the living things and any object. People that on the sea for swimming and equipment such as tidal wave generator exposed to lightning strike since it totally available on the water. Unfortunately, lightning does not strike on sea water only. It can be any type of water, since the water itself conduct electricity. Different water type has a different electric conductivity. Analysis on current distribution for different type of water is necessary, since this will provide a pathway to precautionary and protection act to avoid any accident and damages to occurs. Furthermore, application on current distribution also can be wider in industry and environment application such as water treatment and wet polluted insulator.
1.3 Objectives
The objectives of this project are :
To develop a small scale model for monitoring and demonstrating a current distribution on water for analysis and learning purpose.
To investigate the current distribution characteristic on the two different type of water
3
1.4 Scope
4
CHAPTER 2
LITERATURE REVIEW
2.1 Introduction
Current distribution in water studies is become important and its purposed can be useful in various applications. Several research and development show that current distribution process could be valuable for human, and also it could be exist in unexpected ways.
2.2 Current Distribution On Water Due to Lightning.
5
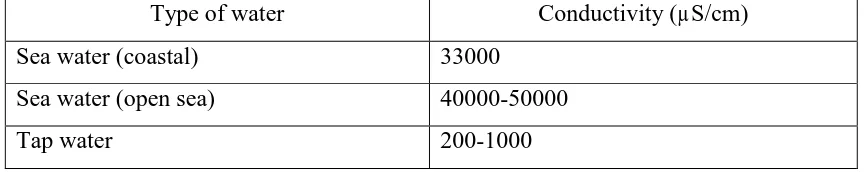
2.3 Water Conductivity
The current distribution on water are depend on the conductivity of the water itself, as the higher conductivity, the more current that can be through. Recent research [1,2] show that current distribution distance influence by the water conductivity. Dissolve salt in the water solution also decide how well water ability to distribute current.
From the table below, show the conductivity of different type of water that could be involved in this project. This data is according to Interim National Water Quality Standard Malaysia : Water Conductivity.
Table 2.1 : Water Conductivity table
2.4 Electrical Discharge Application on Water Treatment
2.4.1 Water Electrode Ozone Generator
Regarding to [5], ozone can be useful in water treatment process. In industry, ozone is generated using an ozone generator. Ozone basically used to sever carbon bond, bleaching substance and killing microorganism in water. It is also powerful oxidant to chemically attack contaminant on water for treatment purposes. Electrical discharge on water can be related to ozone generation because the ozone production involve the passage of an oxygen-bearing gas through by electrical discharge. It is also called "silent" electrical discharge method, by applying an electrical discharge in a gap between concentric electrodes separated by a glass or ceramic dielectric barrier.[5]
Type of water Conductivity (µS/cm)
Sea water (coastal) 33000
Sea water (open sea) 40000-50000
6
The ozone production relatively simple process is when the air is drawn into the ozone generator, the electrical discharges that been applied will split the air oxygen (O2) molecules into single atom O. O2 is a molecules from the combination of 2 atoms (O) .However, some of the O atoms will react to another available O2 molecules to form an ozone (O3).
7
2.4.2 A Latest Development on Water Treatment using Electrical Discharges in
Water
During this day, several research have been done as to improved water treatment quality. There is studies found in [4] that in certain condition, ozone usage in water treatment is less effectives as it is found difficult to treat the refractory organics in water. As it happen, the new method is to apply electrical discharge in bubbles in water to generate some other radical such as atomic oxygen, ozone, hydroxyl and hydrogen peroxide [4].Besides, there is also found that hydroxyl radical is the powerful and non-selective oxidant which have an ability to kill bacteria and oxidize organic compound [6].However this area of research are still developed as there are many unknown matters being concerned with the discharges phenomena in bubbles [4].
8
2.5 Local Discharge on Wet Polluted Insulator
According to [7], local discharge could be happen on the electrical insulators that exposed in a wet condition or a moisture. It is also called as wet polluted insulator. As an example, the wet transmission lines insulator and polluted transformer oil. It is known that local discharge propagates on wet polluted surface without drying the surface[7].Its mean, the discharge will be maintain, as the insulator is kept wet. An experiment in [7] has been conducted to gather information regarding local discharge on wet polluted insulator. The test is done by applying voltage on the electrolytic solution, which is represent the wet polluted insulator. The experiment used an electrolytic solution of aqueous solution of potassium chloride. The impulse voltages has been focused as to be related to lightning phenomena. The experiment setup is shown below.
9
Tungsten probe at the bottom and plane electrode functioned to detect current distribution and propagation during the discharges occur. When the voltages is applied from the rod electrode, the local discharge occur between the rod electrode and solution surface .The experiment recorded that current flow through the solution surface and voltages difference occurs between the tungsten probe. The voltages difference were varies as the local discharges propagates.[7]
2.6 Rogowski Coil
10
2.7 Impulse Voltage Generator
2.7.1 Impulse Voltage
Impulse voltages is a transient voltage where its amplitudes may hugely exceed the peak values of the normal AC operating voltage, in other words, a very short high voltage surges. There is two common type of impulse voltages, which is both over voltages of lightning and switching. The lighting over voltages is a natural phenomenon, where it is a peak discharge in which charge accumulated in the cloud discharges into neighbouring cloud or ground [11]. Lightning over voltages is very sudden, unpredictable and could draw a large value of current and voltages in a short time which make it considerably more dangerous. Meanwhile, the switching phenomena is occur in the electrical system during the connection and disconnection of circuit breaker contact or due to interruption of fault [11]. The rate of voltage rise is usually proportional to the operating voltages. This two phenomena normally brought a temporary over voltages to the system, and a good insulation is essential for protection purpose.
![Figure 1 : Water Electrode Ozone Generator [5]](https://thumb-ap.123doks.com/thumbv2/123dok/543966.63539/20.595.100.534.218.480/figure-water-electrode-ozone-generator.webp)
![Figure 3 : Electrode system [7]](https://thumb-ap.123doks.com/thumbv2/123dok/543966.63539/22.595.230.404.371.568/figure-electrode-system.webp)
![Figure 4 : Rogowski coil construction with electronic comparator [9]](https://thumb-ap.123doks.com/thumbv2/123dok/543966.63539/24.595.220.382.75.235/figure-rogowski-coil-construction-electronic-comparator.webp)
