SUPERVISOR DECLARATION
“I hereby declare that I have read this thesis and in my opinion this thesis is sufficient in terms of scope and quality for the award of the degree of Bachelor of Mechanical Engineering
(Plant And Maintenance)”
Signature: ………
Supervisor: PN. NUR IZYAN BINTI ZULKAFLI
ANALYSIS OF PREVENTIVE MAINTENANCE PLANNING FOR HYDROGEN MANUFACTURING UNIT (HMU)
IN SHELL MDS (M) SDN BHD
ROY HANSON JIMIT
This Thesis Is Submitted In Partial Fulfilment of Requirement For Degree of Bachelor of Mechanical Engineering (Plant & Maintenance)
Faculty of Mechanical Engineering Universiti Teknikal Malaysia Melaka
ii
DECLARATION
“I hereby declare that the work in this thesis is my own except for summaries and quotations which have been duly acknowledged.”
Signature: ………
Author: ROY HANSON JIMIT
iii
This thesis is dedicated to God Almighty who has been my eternal rock and source of refuge, and for His word in Habakkuk 2:1-3 that kept me all through the journey of completing this fine work. I also dedicate this work to my supervisor, Puan Nur Izyan
iv
ACKNOWLEDGEMENT
I would like to express my special thanks of gratitude to Puan Nur izyan, for her great efforts of supervising and leading me to accomplish this fine work. A special feeling of gratitude to the Lord my God for HIS presence always with me, my loving parent, friends and girlfriend miss Tiffany whose always encourage and support me throughout my degree. I will always appreciate all they have done.
v
ABSTRACT
This paper discussed the preventive maintenance planning in one of the process plant in Bintulu Sarawak which is SHELL MDS SDN.BHD. Preventive maintenance (PM) planning is method in which the maintenance activities are planned and scheduled based on predetermined counter intervals in order to prevent breakdowns and failures from occurring. This study investigates the effect of the maintenance performance in the Hydrogen Manufacturing Unit (HMU) and to estimate the total cost incurred within the maintenance planning time horizon. The scope of this study is to investigate the effect of maintenance performance related to the size of the labor force, preventive frequency and spare part inventory and the budget estimation that include the economic losses, PM cost, labor cost and inventory cost. Begin with process flow diagram (PFD) of the plant to determine the equipment that needed in this research. By identify the failure mode of the equipment, all the related parameter will be listed out such as the rate of failure, rate of PM, Mean Time Between Failure (MTBF) and also the rate of repair. From these parameters, the maintenance planning can be scheduled and the data can be simulated using the selected model. The application of the model resulted in the prolonged of the MTBF for each equipment, increases in the availability of the machine under the control parameters and the frequency of equipment down for PM increases to reduce the failure. A good preventive maintenance planning is found to decrease the system failure and the downtime. The most important is the availability of the equipment which to be always considered in all calculations.
vi
ABSTRAK
vii
TABLE OF CONTENT
CONTENT PAGE
DECLARATION ii
DEDICATION iii
ACKNOWLEDGEMENT iv
ABSTRACT v
ABSTRAK vi
TABLE OF CONTENT vii-xi
LIST OF TABLE xi
LIST OF FIGURE xii-xiii
LIST OF EQUATION xiv
LIST OF SYMBOL xv
LIST OF ABBREVIATION xv
viii
CHAPTER 1: INTRODUCTION
1.1Research Background 1-3
1.2Problem statement 4
1.3Objectives 4
1.4Scope of Work 4
CHAPTER 2: LITERATURE REVIEW
2.0 Introduction 5
2.1 Overview of Preventive Maintenance 5
2.2 Markov Model 6
2.2.1 Explanation Of Method 7
2.2.2 Mathematical Model Formulation 8
2.2.3 Output Variable 9
2.2.4 Implementation Of Markov Model 9-12
2.2.5 Conclusion 13
2.3 Montecarlo Simulation Model 13
2.3.1 Explanation Of Method 13
2.3.2 Input and Output Variable 14
2.3.3 Implementation and Analysis of Montecarlo 15-19
2.3.4 Conclusion 20
2.4 Total Productive Maintenance 20
2.4.1 Data and Analysis 21-22
ix
2.5 Summary Of literature Review 23
CHAPTER 3: METHODOLOGY
3.0 Introduction 24
3.1 Process Flow Diagram (PFD) 25
3.2 Preventive Maintenance Planning 25-26
3.2.1 FMEA 26-28
3.2.2 Historical Data Of Critical Equipment 28-29
3.2.3 Markov Model Planning 30-32
3.3 Total Maintenance Cost And Economic Losses Estimation 33 3.3.1 Total Maintenance Cost Estimation 33-37
3.3.2 Total Economic Losses Estimation 38-40
CHAPTER 4: RESULT AND ANALYSIS
4.1 FMEA 41-45
4.2 Historical Data Of Equipment 46-47
4.2.1 Analysis Of 1st case study 48-49
4.2.2 Analysis Of 2nd case study 50-51
4.2.3 Analysis Of 3rd case study 51-52
4.2.4 Analysis Of 4th case study 52-53
x
4.4 Economic Losses Estimation 57-58
CHAPTER 5: DISCUSSION
5.1 First Case Study 59-60
5.2 Second Case Study 60-61
5.3 Third Case Study 61-62
5.4 Fourth Case Study 62-63
5.5 Summary Of Markov Model 63
5.6 Total Maintenance Cost 64
5.6 Total Economic Losses 65
CHAPTER 6: CONCLUSION AND RECOMMENDATION
6.1 Conclusion 66
6.2 Recommendation 67
REFFERENCES 68-70
xi
LIST OF TABLES
TABLE TITLE PAGE
3.1 The historical data for the critical equipment 28 3.2 Spare part cost estimation for maintenance activity 37 3.3 The result characteristic life of each equipment 40
4.1 FMEA of Equipment in U-2000 42-45
4.2 Various Parameters for the equipment 46-47
4.3 Various parameter for the critical equipment 54
4.4 Result of Size of Labor 56
4.5 The cost for the equipment based on the PM activity 56 4.6 Total maintenance cost for each equipment/year 57
4.7 The result for PMopt for the equipment 57
4.8 The result for optimization economic losses 58 5.1 The comparison of MTBF before PM and after PM 60 5.2 The frequency of λpm to achieve (Pfail < Ppm) 61
xii
LIST OF FIGURES
FIGURE TITLE PAGE
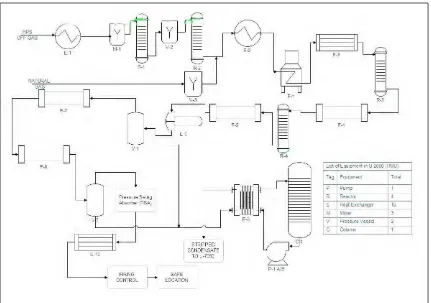
1.1 PFD of HMU draw using Edraw Max (trial version) 2 2.1 State Transition Diagram for the PM Markov Model 6
2.2 Various parameters for the CNC Lathe Machine 9
2.3 Results of the case with manipulated system failure rate (λfail) 10
2.4 Graph of the scenario with varying system failure rate (λfail) 10
2.5 Graph of the scenario with varying rate of system 11 being down for PM (λpm)
2.6 Results of inspection interval in hours 13
2.7 List of Equipment of the TE Process 16
2.8 Optimal PM frequency 16
2.9 Evolution of the current best objective value in GA iterations 17 2.10 The sum of cost and economic loss as a function of labor for FCC 18
2.11 Initial GA conditions 19
2.12 Initial GA results for FCC plant 19
2.13 Second-round GA results for FCC plant 20
2.14 Mechanical Equipment downtime for 5 years 21
2.15 Pareto Chart for mechanical equipment downtime within 5 years 22
2.16 Summary of downtime data 22
2.17 Production cost of losses from within 5 years 23
3.1 Project methodology chart 24
3.2 PM planning methodology chart 26
3.3 The ranking index for (a) Occurrence, 27
xiii
3.4 Cost estimation methodology chart 33
3.5 The annual salary by discipline area 36
3.6 The bath tub curve of equipment 38
3.7 The first step by set the time-to-failure input 39 3.8 The second step by set the location parameter 39 3.9 The third step by set the decimal place input 39 3.10 The fourth step by determine the result option to be displayed 39 4.1 First scenario result with varying system failure rate (λfail) of 48
(a) Pump, (b) Heat Exchanger and (c) Mixer.
4.2 Second scenario result with varying system down for PM rate 49 (λpm) of (a) Pump, (b) Heat Exchanger and (c) Mixer.
4.3 Third scenario result with varying Repair/Breakdown Maintenance 51 rate (μfail) of (a) Pump, (b) Heat Exchanger and (c) Mixer
xiv
LIST OF EQUATION
EQUATION TITLE PAGE
2.1 Pnormal 8
2.2 PPM 8
2.3 Pfail 8 3.1 Risk Priority Number 27
3.2 Mean Time To Repair 29
3.3 Repair Rate 29
3.4 Mean Time Between Failure 29
3.5 Pnormal (t) 31
3.6 Ppm (t) 31
3.7 Pfail (t) 31
3.15 Total Maintenance Cost 33
3.16 Labour Cost 34
3.17 Labour Force 34
3.18 The total preventive maintenance annual 34
3.19 PM Optimization 40
xv
LIST OF SYMBOLS
λfail = failure rate of a system/equipment μfail = repair rate of a system/equipment
λpm = rate of a system/equipment down for preventive maintenance μpm = rate of a system/equipment preventive maintenance performance A = rate of availability for system/equipment.
τ = Duration
ɳ = Characteristic Life
LIST OF ABBREVIATION
CM = Corrective Maintenance PM = Preventive Maintenance
FMEA = Failure Mode and Effect Analysis PMopt = Preventive Maintenance Optimization
LPM = Size of Preventive Maintenance Labour Force LOC = Worker Operating Condition
Pnormal = Probability of system to work normally (Availability)
Ppm = Probability of system down due to PM
Pfail = Probability of system down due to failure
MTBF = Mean Time Between Failure MTTR = Mean Time To Repair
TPM = Total Productive Maintenance RPN = Risk Priority Number
xvi
LIST OF APPENDICES
APPENDIX TITLE
A1 Result of varying λfail for Pump
Result of varying λpm for Pump Result of varying μfail for Pump Result of varying μpm for Pump
A2 Result of varying λfail for Heat Exchanger Result of varying λpm for Heat Exchanger Result of varying μfail for Heat Exchanger Result of varying μpm for Heat Exchanger
A3 Result of varying λfail for Mixer
Result of varying λpm for Mixer Result of varying μfail for Mixer Result of varying μpm for Mixer
A4 Data Obtain From SHELL MDS
1
CHAPTER I
INTRODUCTION
This research will focus on the Preventive Maintenance (PM) planning. The PM planning is an organized method to execute the maintenance strategies in the plant. Together with the implementation of PM planning, budget estimation will be the primary factor that must be taken into account. It is seen that careful planning of the methods is needed to achieve an optimum and cost effective maintenance strategies.
1.1. Background Research
R.Chumai (2003) said that maintenance is defined as the work of keeping an operating system in good condition or putting it in working order again after it fails. Maintenance refers to the collection of activities that include inspections, overhauls, repairs, preservation of parts and replacements carried on an operating equipment to preserve its functions, avoid consequences of failure and ensure its productive capacity. Therefore, a good maintenance planning in production plants have major impacts on product delivery, product quality and production cost.
2
respect to the budget estimation. In this study will investigate the reliability and availability of the units in relation to implementation of preventive maintenance planning.
In this opportunity, this report is made to assess the PM planning on the process plant beside to propose the good PM planning for the chosen company which is the Hydrogen Manufacturing Unit (HMU) of Shell (M) Middle Distillate Synthesis Sdn.Bhd shown in Figure 1.1. This analysis will use the concept and technique of Markov PM Model to improve the current PM planning used by the company. It shows that this process plant has to undergo a change in their PM planning in order to optimize their productivity and profit to maximum level. All the analysis and recommendations are stated in this report for future consideration.
3
The purpose of the Hydrogen Manufacturing Unit (HMU U-2000) is to manufacture pure hydrogen gas from natural gas and off-gas of the Heavy Paraffin Synthesis Unit (HPS U-3000). Both gas is mixed in the mixer (M-1) before it goes to reactor (R-1). R1 is the first stage of conversion takes place over an iron oxide catalyst at „high‟ inlet temperature and is very exothermic. The reforming process produces carbon monoxide as well as hydrogen. This carbon monoxide must be converted (shifted) to carbon dioxide and hydrogen to increase the yield of hydrogen. The process gas leaving R1 and R2 is used to pre-heat boiler feed water (BFW). The hydrocarbons are converted with steam over nickel catalyst to produce a hydrogen rich gas. The hot flue gases and reformed gases generate steam in exchangers. Their residual heat is further utilized for process pre-heating purpose. The Reformer F-1 and its convection bank contains six (6) exchangers. To prevent polymerization and cracking in the Reformer tubes, the olefins (unsaturated hydrocarbons) in the feed gas must be hydrogenated to paraffins (saturated hydrocarbons). This occurs over a palladium catalyst in R-3. In pre-shift conversion stage, to prevent carbon formation and deposition in the Reformer tubes, the carbon monoxide in the feed gas must be converted to carbon dioxide. This occurs over an iron oxide catalyst in the R-4. The gases then stored in V-2 after going through six (6) exchangers. From V-2, the hydrogen rich gas is purified by cyclic pressure swing absorption (PSA) process. The PSA off gas is utilized as fuel in F-1. The hydrogen leaving the PSA process has a purify of 99.5 mol%. Excess steam in the hydrogen rich gas upstream the PSA Unit is condensed out. This condensate is sent to a Condensate Stripper C-1 where dissolved gases (mainly hydrogen and carbon dioxide) are stripped out with LP steam. The condensate is then sent to T-7002 (Storage Tank). The net HP steam production is sent to U-7000 HP steam distribution system. The hydrogen is compressed to two pressure levels. The lower level (at 42barg) is supplied to the HPS Unit (U-3000) which is the major consumer of hydrogen. The higher level (at 52barg) is supplied to all other consumers, they are :
I. Shell Gasification Process (U-1000) II. Hydro Conversion Distillation (U-4000) III. Hydrogenation Unit (U-5100)
4
1.2. Problem Statement
Based on preliminary observations in one of the process plant in Bintulu Sarawak, it was found that the plant is not doing well with their PM planning. This indication can be seen from the previous internship experience where some of the work orders are redundant and not fully accomplish during the whole day. It also seen that some of the equipment that failed took quite a long time for the workers to figure out the problem before do the repair. The impact of this situation is to the total cost and economic loses that incurred within the maintenance planning time horizon. Poor PM planning will affect the productivity. Moreover, based on the observations unorganized PM planning in turn made great increment of economic losses and the effect of maintenance performances.
1.3. Objective
The objectives of this research are:
I. To study the effect of maintenance performance in a process plant.
II. To estimate the total cost and economic losses that incurred within the maintenance planning time horizon.
1.4. Scope Of Study
5
CHAPTER II
LITERATURE REVIEW
2 Introduction
In this chapter, all of the information related to the preventive maintenance planning and also the maintenance performances with respect to the estimation of the total cost and economic lose was elaborated. The literature review is an important step to get all information related to this research.
2.1 Overview Of Preventive Maintenance
Many researches, experiment and documents in the past that studied the techniques, modeling and policy of the preventive maintenance. Preventive Maintenance is one of the maintenance strategies that apply the philosophy of “ Fix It Before It Breaks “ and a predetermined time interval to perform the maintenance with the goal to prolong the useful life of equipment components. Preventive maintenance also helps to:
I. Protect the asset and integrity II. Decrease cost of replacement III. Improve system reliability
IV. Reduce the system downtime due to failure
6
Richa Chouhand et al. (2013) stated that, a well implemented preventive maintenance model can help to minimize the repair efforts and the maintenance costs in a production system. The maintenance department in the plant played an important role to run the PM activities routinely to avoid unplanned downtime because of the failure that occurred in the system.
2.2. Markov Model
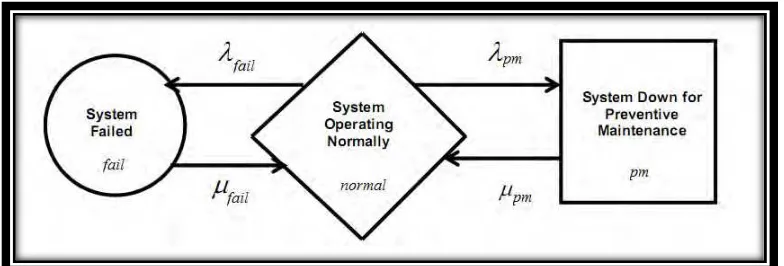
In the journal by Richa Chouhan et al. (2013), Markov Model for Preventive Maintenance discussed in this section represents a system that undergo a complete fail or a routine preventive maintenance within the time horizon, as shown in Figure 2.1. According to Jaroslaw Sugier (2011), Markov Model approach is valid for the equipment that having a constant rate of failure or in a steady state condition. There will some main point to be elaborated in this writing which may include the explanation of the method, mathematical formulation, output variable and also the implementation of result.
Figure 2.1: State Transition Diagram for the PM Markov Model (Source: Richa Chouhand et al., 2013)
7
By using this preventive maintenance planning, the result is to determine the probability of system availability, probability down for PM and the probability down due to failure. For this type of model, several assumption has to be made such as the following:
I. The equipment has a PM rate, repair rate and failure rates which is constant.
II. The equipment is assume to be well functional just after the maintenance activity being carried out.
All of data that are needed in this PM model will help to implement the model and analysis of result. The data are collected from the previous PM data of the equipment.
The input variables used in this model are as follows:
λfail = failure rate of a system/equipment μfail = repair rate of a system/equipment
λpm = rate of a system/equipment down for preventive maintenance μpm = rate of a system/equipment preventive maintenance performance A = rate of availability for system/equipment.