Modelling of Elastic Modulus Degradation in Sheet Metal Forming
Using Back Propagation Neural Network
(Permodelan Penyusutan Modulus Kenyal dalam Pembentukan Kepingan Logam Menggunakan Jaringan Neural Rambatan Belakang)
M. R. Jamli*, A. K. Ariffi n, & D.A. Wahab
ABSTRACT
The aim of this study is to develop an elastic modulus predictive model during unloading of plastically prestrained SPCC
sheet steel. The model was developed using the back propagation neural networks (BPNN) based on the experimental tension unloading data. The method involves selecting the architecture, network parameters, training algorithm, and model validation. A comparison is carried out of the performance of BPNN and nonlinear regression methods. Results show the BPNN method can more accurately predict the elastic modulus at the respective prestrain levels.
Keywords: Back propagation; elastic modulus degradation; neural network
ABSTRAK
Tujuan kajian ini adalah untuk membangunkan model penyusutan modulus kenyal semasa proses melepaskan beban terhadap kepingan logam SPCC yang telah mengalami terikan plastik. Model ramalan ini dibangunkan beban dengan menggunakan kaedah jaringan neural rambatan belakang (BPNN) berdasarkan data eksperimen tegangan-melepaskan beban. Penggunaan kaedah tersebut melibatkan pemilihan seni bina, parameter jaringan, algoritma latihan, dan penentusahihan model. Penilaian terhadap kaedah regresi tak lelurus dan kaedah BPNN dijalankan untuk tujuan perbandingan. Hasil perbandingan menunjukkan kaedah BPNN berupaya untuk meramal model penyusutan modulus kenyal dengan lebih baik dan jitu untuk pra-terikan plastik yang tertentu.
Kata kunci: Rambatan belakang; penyusutan modulus kenyal; jaringan neural
INTRODUCTION
Springback is a major problem faced in conjunction with the formability of sheet metal. It causes the dimensions of a product to diverge from the intended result. To move on from the trial and error approach, prediction techniques have been studied over many years. The fi nite element method (FEM) has been used to reduce the cost and time required to
conduct analysis. There are a number of factors that require comprehensive understanding to formulate a FEM prediction. These include mesh density, friction coeffi cient, and material model. The factor that most affects the accuracy of the FEM
is the material constitutive model (Eggertsen & Mattiasson 2011). The factors that affect springback during unloading include the yield criteria, hardening law, and elastic behaviour. Standard elastoplasticity theory still underpins the majority of FEM practices. The assumption is after plastic deformation, which the unloading modulus will remain the same. However, research has shown the unloading modulus is a function of accumulated plastic strain (Eggertsen & Mattiasson 2009; Yoshida et al. 2002).
Using the classic elastoplasticity theory, the results for springback showed a signifi cant error for part geometries coupled to the uniaxial state of stress (Cleveland & Ghosh
2002). The elastic modulus degradation effect has also been cited as more infl uential than the hardening law (Eggertsen & Mattiasson 2009). However, if the hardening law is used to predict springback, it should be considered in conjunction with unloading modulus degradation. Experiments have been undertaken by Yang et al. (2004) with the aim of linking the microscopic properties and alterations in macroscopic behaviour of SPCC mild steel sheet. Close to the grain boundary of large plastic deformation, the elastic modulus had a lower value that at other areas. It was predicted that the accumulation of pile-up and dislocation at the grain boundary, were the most infl uential factors affecting elastic modulus degradation. A saturated value resulted from decreased unloading modulus and increased prestrain (Yoshida et al. 2002). An exponential formula was introduced to describe the relationship between the unloading modulus degradation and plastic prestrain. More accurate springback prediction was sought by applying this formula in several studies (Chatti 2010; Eggertsen & Mattiasson 2010).
complex experimental data can increase understanding, as it captures linear and nonlinear patterns. A strong accuracy fi t is obtainable by randomly comparing complex nonlinear models and multidimensional data.
Inverse techniques previously applied in BPNN to sheet metal forming, concentrated on predicting the parameters for establishing constitutive models (Aguir et al. 2011; Chamekh et al. 2009; Güner et al. 2010). Other fi elds in metal forming contain reports of BPNN applied to complex constitutive
models (Lu et al. 2011; Zhu et al. 2011). Therefore, potentially there are extensive BPNN applications in sheet metal forming capable of representing the unloading modulus behaviour as part of a constitutive model. The present study is concerned withSPCC mild steel sheet and BPNN to predict the unloading modulus where plastic prestrain is applied. A comparison is made of model performance predictions and the exponential equation model by applying the regression method.
DATABASE
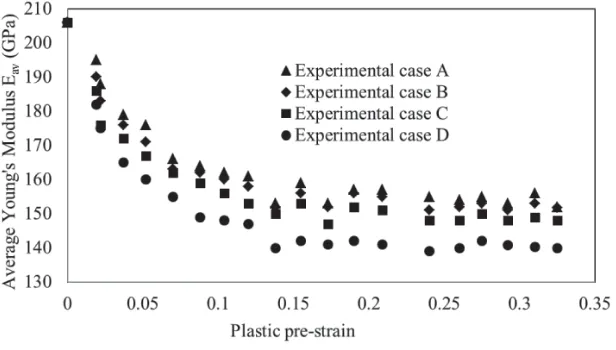
Experimental data published by previous researchers was used in this study (Yoshida et al. 2002). Mild steel sheet (1 mm SPCC) was cut in the rolled direction. A clip-on
extensometer and strain gauges were used to accurately measure 20 different unloading moduli, including virgin and increasingly prestrained specimens. The average unloading modulus (Eav) was introduced instead of Young’s modulus. The stress ranges shown in Figure 1 were used: (A) 0.75ı0 <
=ı0 <=0.95ı0; (B) 0.5ı0 <=ı0 <=0.95ı0; (C) 0.25ı0
<
= ı0 <= 0.95ı0; and (D) 0 <=ı0 <=0.95ı0. Immediately after
the unloading commenced, high nonlinear stress–strain was experienced. Therefore, 0.95ı0 was defi ned as the starting point of the calculations, the results of which are shown in Figure 2, where the plastic pre-strain and the average Young’s modulus are the input and the output of the BPNN model.
FIGURE 2. Average unloading modulus vs. reverse plastic strain of SPCC mild steel sheet (Yoshida et al. 2002)
BACK PROPAGATION NEURAL NETWORK MODELLING
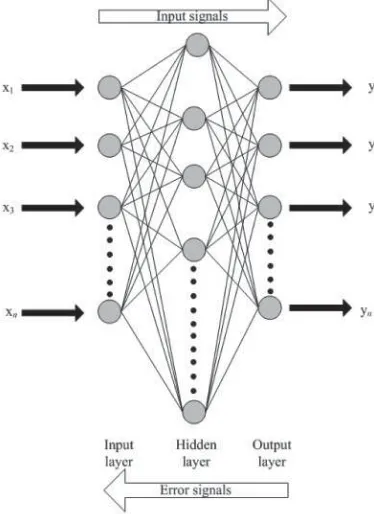
BPNN models are mathematical or computational mimicking of neuron interconnections in the human brain, used to perform complex processing tasks. The sophistication of the technique has developed more recently in response to high-performance computer technology. In this paper, ANN tool
box of MATLAB software was used to simulate the proposed
BPNN. Figure 3 is a schematic representation of a BPNN
structure composed of input and output layers, which are the plastic pre-strain and average Young’s modulus. The input signals are propagated through the hidden layer, until they reach the output layer. The input layer, which consists of a single neuron receives signals from the experimental data, but does not process an input pattern. The signals are weighted and redistributed to all the neurons in a hidden layer, which sums correspondingly weighted signals to determine the output pattern through the output layer, which also consists of a single neuron.
1 All input data were normalized according to the following equation: whereXn is the normalized value of plastic pre-stain, and
Xmin and Xmax are the minimum and maximum values of X
accordingly, so that all input lies between -0.5 to 0.5. The input value is generated as a sigmoid activation function:
2
The derivative of this function is easily computed, and the neuron output range is -1 to 1. The degree of
BPNN prediction accuracy is substantially affected by the number of hidden layer neurons. An optimum number is determined by a trial and error procedure. Figure 4 shows the relationship between the trained network performance and number of hidden layer neurons using mean square error (MSE). The optimum number is 22 neurons, as performance deteriorated above that amount. The Lavenberg–Marquardt training algorithm method was selected. It is commonly used in BPNN, as it converges optimum weights in an entire network quickly and effi ciently (Hagan et al. 2003). Table 1 shows the network training parameters that were set for this study.
FIGURE 3. Schematic structure of a BPNN
The learning algorithm propagates signals from the input to output layers via each layer. When there is a deviation between the target and actual output patterns, the errors are calculated. These are then propagated back from the output to the input layer. The signal weight is modifi ed according to the backward propagated error for the next epoch. The BPNN is determined by neuron connections, activation functions, and the weight modifi cation procedure of the training algorithm. In this study, there is a single hidden layer and the output for each neuron is computed as a net weighted input:
TABLE 1. Neural network training parameters Network Training Performance Max. training Error
function function epoch goal
Feed- Train1m MSE 400 1 x 10⁻⁴
forward (LM)
RESULTS AND DISCUSSION
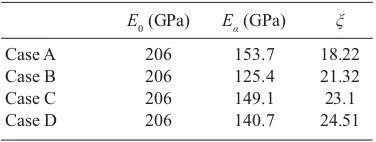
The deformation of the unloading modulus degradation curves of SPCC mild steel sheet in the four stress ranges are shown in Figure 5. The curves exhibit saturated degradation contingent on increased plastic prestrain. More stress causes a decrease in degradation, indicated by the slightly curved unloading paths deviating from linearity. The effect is a secant to the curves around an imaginary mean line. In a given stress range, the relationship between the unloading modulus and plastic prestrain can usually be expressed by the following equation (Yoshida et al. 2002):
0 ( 0 )[1 0 ]
p
av a
E E E E exe (4)
where,Eav is the average unloading modulus, E0 and Ea are the unloading moduli for virgin and infi nitely large prestrained materials respectively, and ȟ is the material constant for a particular prestrain.
To compare all the stress ranges, the unloading modulus degradation data were calculated by Equation 4 using nonlinear regression analysis. Both Ea and ȟ constants are listed in Table 2 for each of the ranges, calculated by the regression method. For each range they are slightly different, because of the nonlinear unloading modulus characteristic.
An interpolation data set was used to train, validate, and test the BPNN. The training stopped at a 0.0013 MSE and 237 epochs as shown in Figure 6. The generalisation capability of the trained network was quantifi ed by the correlation coeffi cient (R) and relative error (ER) using the target output
where, E is the experimental value and P is the predicted value obtained from the network model. E– and P– are the mean values of E and Prespectively, and n is the total number of data employed in the investigation.
Figure 7(a–b) shows the experimental and calculated plots of the unloading modulus using Equation 4, together with the predicted value by the BPNN model. An optimal line inclined at 45º from the horizontal has been added. All points should lie on this line for a perfect prediction. Most of the data points are positioned very close to the line. The BPNN model and Equation 4 correlation coeffi cients are 0.98259 and 0.971 respectively. The BPNN model has achieved greater accuracy in predicting the unloading modulus than the regression method. The BPNN model has produced a good correlation between the predicted and experimental data.
FIGURE 5. Average unloading modulus vs. plastic prestrain of
SPCC mild steel sheet (Yoshida et al. 2002)
TABLE 2. Material constants calculated by Equation 4
Source: Yoshida et al. 2002
FIGURE 6. Network performance of the selected architecture
A comparison is made of the relative errors of the BPNN
and regression models to the experimental values, which are depicted as scatters in Figure 9. The relative error in the
stress ranges. Figure 9 shows the result of the comparison, using the experimental unloading moduli for cases A and D only. The BPNN model provides an accurate evaluation
of the unloading modulus. From these results, the network architecture and performance is satisfactory, as there is good agreement with the experimental data.
CONCLUSION
The unloading modulus degradation for plastically prestrained
SPCC mild steel sheet using the BPNN model was studied. The accuracy of predictions was assessed in relation to the infl uence of network training and its parameters. The BPNN
method gave a higher level of accuracy than the nonlinear regression method when representing the unloading modulus degradation. For future research, the authors are planning to further explore the BPNN method to be integrated with the commercial fi nite element software to provide high quality simulations of springback in sheet metal.
ACKNOWLEDGEMENT
The author wishes to thank the Malaysian Ministry of Education, Universiti Teknikal Malaysia Melaka and Universiti Kebangsaan Malaysia, for the fi nancial support provided to undertake this research.
REFERENCES
Aguir, H., Belhadjsalah, H. & Hambli, R. 2011. Parameter identification of an elasto-plastic behaviour using artifi cial neural networks-genetic algorithm method.
Materials & Design 32(1): 48-53.
Chamekh, A., Bel Hadj Salah, H. & Hambli, R. 2009. Inverse technique identifi cation of material parameters using fi nite element and neural network computation.
The International Journal of Advanced Manufacturing Technology 44(1): 173-179.
Chatti, S. 2010. Effect of the elasticity formulation in fi nite strain on springback prediction. Computers & Structures
88(11-12): 796-805.
Cleveland, R. M. & Ghosh, A. K. 2002. Inelastic effects on springback in metals. International Journal of Plasticity
18(5-6): 769-785.
FIGURE 7. Comparison between experimental and predicted values for Case A; (a) regression model vs. experiment; and (b) BPNN prediction vs. experiment
FIGURE 8. Comparison using experimental data of relative error ofBPNN predicted value and calculated value by regression
Eggertsen, P.-A. & Mattiasson, K. 2011. Experiences from experimental and numerical springback studies of a semi-industrial forming tool. International Journal of Material Forming: 1-19.
Eggertsen, P. A. & Mattiasson, K. 2009. On the modelling of the bending-unbending behaviour for accurate springback predictions. International Journal of Mechanical Sciences 51(7): 547-563.
Eggertsen, P. A. & Mattiasson, K. 2010. On constitutive modeling for springback analysis. International Journal of Mechanical Sciences 52(6): 804-818.
Güner, A., Yin, Q., Soyarslan, C., Brosius, A. & Tekkaya, A. 2010. Inverse method for identifi cation of initial yield locus of sheet metals utilizing inhomogeneous deformation fi elds. International Journal of Material Forming: 1-8.
Hagan, M. T., Demuth, H. B. & Beale, M. H. 2003. Neural Network Design. Vikas Publishing House.
Lu, Z., Pan, Q., Liu, X., Qin, Y., He, Y. & Cao, S. 2011. Artifi cial neural network prediction to the hot compressive deformation behavior of Al–Cu–Mg–Ag heat-resistant aluminum alloy. Mechanics Research Communications 38(3): 192-197.
Yang, M., Akiyama, Y. & Sasaki, T. 2004. Evaluation of change in material properties due to plastic deformation.
Journal of Materials Processing Technology 151(1-3): 232-236.
Yoshida, F., Uemori, T. & Fujiwara, K. 2002. Elastic–plastic behavior of steel sheets under in-plane cyclic tension– compression at large strain. International Journal of Plasticity 18(5-6): 633-659.
Zhu, Y., Zeng, W., Sun, Y., Feng, F. & Zhou, Y. 2011. Artifi cial neural network approach to predict the fl ow stress in the isothermal compression of as-Cast Tc21 titanium alloy.
Computational Materials Science 50(5): 1785-1790.
Mohamad Ridzuan Jamli*
Department of Manufacturing Process Faculty of Manufacturing Engineering Universiti Teknikal Malaysia Melaka Hang Tuah Jaya
76100 Durian Tunggal, Melaka Malaysia
Ahmad Kamal Ariffi n & Dzuraidah Abdul Wahab Department of Mechanical & Materials Engineering Faculty of Engineering & Built Environment Universiti Kebangsaan Malaysia
43600UKM Bangi, Selangor D.E.
Malaysia
*Corresponding author; email: [email protected] Received date: 3rd December 2014