Original Article
Food and nutrition security and the economic crisis
in Indonesia
Soekirman
PhDDivision of Community Nutrition and Family Resources, Bogor Agriculture University, Bogor, Indonesia
Indonesia has been afflicted by an economic crisis since July 1997. The economic crisis was preceded by a long drought associated with El Nino. The result has been a decline in food production, especially rice. In the eastern part of the country, especially in Irian Jaya, there was food insecurity during the early stages of the economic crisis. When the crisis escalated to become an economic, social and political crisis in 1998, food insecurity spread to other provinces, especially to urban areas in Java. The crisis led to increasingly high inflation, unemployment, poverty, food insecurity and malnutrition. The official figures indicate that poverty in Indonesia increased from 22.5 million (11.3%) in 1996 to 36.5 million (17.9%) in 1998. Food production decreased by 20–30% in some parts of the country. Compared with prices in January 1998, food prices had escalated 1.5- to threefold by August/November 1998 when acute food shortages occurred, especially in urban Java. Coupled with a drop in purchasing power, the higher food prices worsened health, nutritional status and education of children of urban poor and unemployed families. Despite social and political uncertainties, the Indonesian Government has taken prompt action to prevent a worsening of the situation by massive imports of rice, instituting food price subsidies for the poor and launching social safety net programmes to cope with food shortages and malnutrition. The present paper attempts to highlight the impact of the economic crisis on food insecurity and malnutrition in Indonesia.
Key words: crisis, food, nutrition, poverty, social.
Introduction
For more than two decades, starting in the 1970s, Indonesia witnessed a success story in its development. From 1987 to 1996, Indonesia had sustained annual economic growth of 7–8%, per capita income increased from US$561 in 1990 to US$1155 in 1996, poverty was significantly reduced from 87 million people in 1970 to 22 million people in 1995, there was self-sufficiency in rice over the period 1984–1993 and the country enjoyed social and political stability. From a food security point of view, there was optimism that Indonesia was achieving universal food security as defined by the Indonesian food law: ‘. . . a condition in which every house-hold has access to adequate food in quantity and quality, safe and affordable.’1
The situation suddenly changed when the Asian economic crisis began to affect Indonesia in the late 1990s. First hit by the El Nino-induced draught in 1997 in the Eastern region of the country, Indonesia witnessed declining food availability and accessibility. There were signs of a threat to food security. Meanwhile, the economic crisis expanded to become a polit-ical and social crisis that lead to a chaotic situation, especially in the first 8 months of 1998. The chaotic situation in some big cities, such as Jakarta, was triggered primarily by the worsening food crisis, with the disappearance of rice and other basic foods (sugar, cooking oils, soybean, baby foods etc.) and escalating food prices, coupled with weakened purchasing power, mass lay-offs and unemployment. The escalating number of poor people became a great concern.
Except in the agricultural sector, there was a general dec-line in employment during the crisis (1997–1998). According to the Central Bureau of Statistics,2the number of people
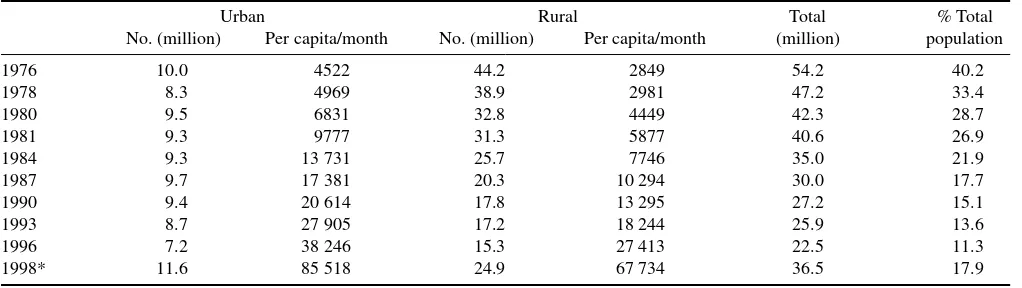
in Indonesia living in poverty increased from 22.5 million (11.3%) in 1996 to 36.5 million (17.9%) in 1998 (Table 1).
The present paper attempts to describe how the crisis has affected food security and nutritional status, the causes of the crisis, the government response and the lessons that have been learned with regard to the nutrition programme in Indonesia.
Threat to food security
The drought induced by El Nino, which preceded the crisis in Indonesia, caused a decline in food production and avail-ability between 1997 and 1998. Rice production dropped 8.8% in 1998, the biggest fall in a single year over 20 years.3The
first troublesome effect of the food shortage, experienced primarily by urban households, was soaring food prices. Rice virtually disappeared from the market, so rice prices were especially affected.
This phenomenon reminded many people of the situation in the 1960s when the country was still very poor and just recovering from the nightmare of the communist coup in 1965.
The threat to food security during the crisis also arose because of the breakdown of the food distribution system. The riots and burning in May 1998 in Jakarta and other cities caused the collapse of the public and commercial transporta-tion system. This situatransporta-tion continued for several months.
Correspondence address: Soekirman, Professor of Nutrition, Bogor Agriculture University, Bogor, Indonesia. Tel.: 62 21 799 2993; Fax: 62 21 798 7130
Thus, while stocks of food were abundant in some locations, surplus food could not be transported to needy areas.
How poor households coped with the crisis
As shown in Fig. 1, households affected by the crisis tried to cope by increasing the proportion of household income spent on staples, such as rice and oil, and by decreasing the alloca-tions on important food items, such as meat and vegetables, as well as on health care, education, household goods, hous-ing and recreation. Despite the increased percentage alloca-tion to foods (Fig. 2), families actually still get much less food for their money because the prices of many basic foods have increased substantially. Helen Keller International data from Central Java validate the observation that some house-holds have reduced their consumption of protein from animal sources.4
Effect on nutritional status
Surprisingly, analysis of the prevalence of underweight chil-dren on the basis of aggregate data provided by the National Social and Economic Survey (SUSENAS) does not indicate that the nutritional status of children aged under 5 years in 1998 was declining. Disaggregated data by age nevertheless show a significant increase in the prevalence of underweight children aged 6–24 months between 1996 and 1998. Figure 3 shows how the prevalence of underweight children under 5 years of age changed between 1989 and 1998. Figure 4 shows changes in the prevalence of underweight children aged 6–17 months over the same period.
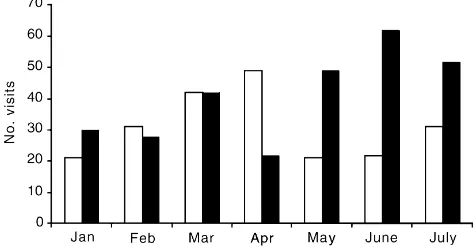
In rural areas, the situation of children aged 6–17 months worsened between 1995 and 1998. Throughout 1998 and 1999, Indonesian newspapers reported almost daily on the inci-dence of marasmic kwashiorkor. Various studies on the re-emergence of marasmic kwashiorkor cases in hospitals, nutrition clinics and the community have confirmed the cases reported by the press.4–6Figure 5 illustrates the increasing
rates of severe malnutrition in East Java among paediatric admissions to one physician, reflecting the impact of the cri-sis. Figure 6 shows how the number of visits related to severe malnutrition recorded by the nutrition clinic at Puslitbang Gizi, Bogor, West Java, varied between 1997 and 1998.
Studies also reveal that micronutrient malnutrition has been exacerbated by the crisis. For example, the prevalence of low haemoglobin values indicative of iron deficiency has
tripled in infants aged 4–5 months in Central Java. Across all age groups in the critical first 3 years of life, the per-centage of children with anaemia has increased from the already high precrisis levels. Among children aged between 6 and 23 months, the level has risen from 50 to above 70%.
Impact of the crisis on Indonesia
The factors that caused the current setback in Indonesia have been the subject of economic analysis and may be sum-marized as follows.7In the 1980s, Indonesia began a process
of massive economic deregulation. While this led to strong macroeconomic performance, it was not supported by a strong microeconomic foundation. The strong macroeconomic per-formance led to high expectations for future income. The financial deregulation enacted in 1988 fuelled massive cap-ital inflow and a strong currency, but also created a trend towards a large current account deficit. The weak micro-economic foundation consisted of policy, legal and institu-tional failures on the part of the government and the private sector. Examples of legal and institutional failures include the weakness of the legal system due to poor enforcement, the unsupervised banking system and the generally weak and inefficient financial sectors. The combination of these fail-ures led to the excesses of corruption, collusion and nepotism in Indonesia, known as Korupsi, Kolusi, Nepotisme (KKN). The economy was damaged by a severe misallocation of resources. The crisis had become more complicated, leading to a complex crisis or a ‘total’ crisis as some Indonesians called it.
Government response to food insecurity
With the aim of ensuring food security, the initial policy was to maintain market control and keep food prices low through food trade deregulation, encouraging local food production and subsidizing the poor by means of a rice price subsidy operating a special market for rice for the poor and providing subsidies for agricultural inputs.
The deregulation policy allows for free trade in basic food commodities, thereby abolishing the food import monopoly of the National Logistic Agency, namely, Badan Urusaon Logistik (BULOG). Under the new policy, the domestic dec-line in food production was partly offset by food imports, including rice. Food imports, especially rice (Table 2) and wheat, increased dramatically in 1997 and 1998.
Table 1. Poverty trends in Indonesia from 1976 to 1998
Urban Rural Total % Total
No. (million) Per capita/month No. (million) Per capita/month (million) population
1976 10.0 4522 44.2 2849 54.2 40.2
1978 8.3 4969 38.9 2981 47.2 33.4
1980 9.5 6831 32.8 4449 42.3 28.7
1981 9.3 9777 31.3 5877 40.6 26.9
1984 9.3 13 731 25.7 7746 35.0 21.9
1987 9.7 17 381 20.3 10 294 30.0 17.7
1990 9.4 20 614 17.8 13 295 27.2 15.1
1993 8.7 27 905 17.2 18 244 25.9 13.6
1996 7.2 38 246 15.3 27 413 22.5 11.3
1998* 11.6 85 518 24.9 67 734 36.5 17.9
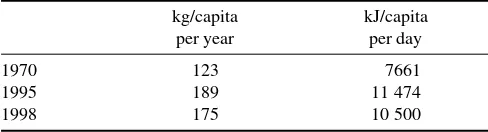
As a result of higher food imports, the per capita per annum availability of cereals in 1998 was relatively stable. As shown in Table 3, this is 175 kg and the availability of energy per capita per day is approximately 10 500 kJ. Com-pared with 1995, the reduction in availability of cereals per capita per annum in 1998 was only 14 kg, while the decreased energy availability per capita per day in 1998 was only approximately 966 kJ.
These data are supported by other evidence,8of the
avail-ability of 10 500 kJ of energy per capita per day in 1997 and 1998. This level is well above the levels of energy avail-ability historically associated with widespread hunger in Indonesia (i.e. 6300 kJ per capita per day in the 1890s, the 1920s, the 1940s and the early 1960s). This probably explains why, despite the economic and political turmoil during the early months of the crisis in 1998, including threats to food security, there has been no widespread overt hunger and starvation, except in Irian Jaya in early 1997, because of El Nino.
The goal of the government social safety net is to protect the poor or those who are impoverished because of the crisis by ensuring food security, creating employment, developing small and medium-sized enterprises and providing basic social services in health, nutrition and education.
To reduce the risk of malnutrition, three main nutrition activities are being implemented as part of the social safety
Figure 1. Percentage of household expenditure on food in Indonesia in 1997 and 1998. Data from Frankenberg et al.11
Figure 2. Proportion of household food expenditure in Indonesia in 1997 and 1998. Data from Frankenberg et al.11
Figure 3.Prevalence of underweight children under 5 years of age in Indonesia from 1989 to 1998. (䊏), 1989; ( ), 1992; ( ), 1995; (䊐), 1998. Data from Jahari et al.6
Figure 4. Prevalence of underweight children aged 6–17 months in Indonesia from 1989 to 1998. (䊏), 1989; ( ), 1992; ( ), 1995; (䊐), 1998. Data from Jahari et al.6
Figure 5.Rates of severe malnutrition among paediatric admissions to Dr Soetomo Hospital, Surabaya, East Java, from 1996 to 1998. (䊐), males; (䊏), females. Data from United Nations International Children’s Fund (UNICEF Jakarta, pers. comm., 1998).
net: (i) the provision of supplementary feeding to children aged 0–24 months and anaemic mothers; (ii) revitalizing the village nutrition centres (posyandu); and (iii) revitalizing the nutrition surveillance system.
The specific objectives of these activities are to prevent increasing trends in the prevalence of malnutrition among poor people due to the crisis, to reduce the prevalence of low birth weight, wasting and stunting in children and micro-nutrient deficiencies in children and mothers (particularly iron, vitamin A and zinc) and to educate mothers on good infant feeding practices using either local or home-made sup-plementary foods or industry products.
The current situation
In 1999, the macroeconomic indicators were positive. The rupiah exchange rate was strengthening, food prices were back to levels before the crisis, inflation had gone down to single digits, the contraction in GDP growth was getting smaller and some analysts were optimistic that it could reach zero or even positive growth in 2000. The GDP Indonesia in 2000 (the third quarter) was 5.1% (Economic Data. Far Eastern Economic Review 2001; 1). Unfortunately, macro-economic progress was still fragile because of political uncertainty, especially after the Bali Bank scandal was disclosed in July 1999 and after the result of the East Timor referendum was announced in August 1999.
The fragility of macroeconomic progress in 1999 is indi-cated by the persistent and increasing incidence of marasmus and kwashiorkor among children found in certain groups of people in various provinces and districts in Indonesia.
In August 1999, the press was still reporting that a num-ber of infants and young children were dying from severe
malnutrition. While that extreme is at least debatable, there is no doubt that a significant number of people in Indonesia are still struggling to secure their right to adequate food.
Lessons learned from the crisis in Indonesia
The unexpected re-emergence of marasmus and kwashiorkor during the crisis is to be regretted. In the 1980s, Indonesia developed a nutrition surveillance system to continually mon-itor the probability of the occurrence of food crises and the incidence of severe malnutrition, such as marasmic kwash-iorkor.9In addition, Indonesia’s successful development of a
community nutrition institution at grassroots level called ‘posyandu’, was recognized by United Nations International Children’s Emergency Fund and the World Health Organiza-tion. Posyandu empowers local women and the community to prevent malnutrition among children under 5 years of age and their mothers using local resources. Unfortunately, since the early 1990s, neither the nutrition surveillance nor posy-andu have functioned properly. In some cases, they have been abandoned and, thus, the village community has no institutional mechanism to protect young children from the threat of food insecurity arising from an emergency such as the economic crisis.
The re-emergence of marasmus and kwashiorkor during the economic crisis has been caused more by bureaucratic, structural and functional problems at the grassroots level than by problems of availability and accessibility of food. For example, since 1993 there has been less of a role for the community and more of a top-down bureaucratic approach in the nutrition programme in Indonesia. This has led to a decreased role for posyandu in protecting children from mal-nutrition. The economic crisis is believed to have acted as a trigger in worsening the nutritional status of children.
From the above, it has been argued10 that existing
traditional nutrition interventions, such as providing supple-mentary feeding, are enough to deal with crisis-induced malnutrition. Many institutional aspects of community empowerment should have preceded nutrition intervention. Therefore, it is clear that traditional nutrition intervention is necessary but not sufficient to ensure food and nutrition security at a time of total crisis as has been experienced in Indonesia.
References
1. Government of Indonesia. Law No. 6, 1996 on Food. Ministry of Food Affairs, Jarkarta.
2. Central Bureau of Statistics. 1999 Statistical yearbook and indica-tor. Badan Pusat Statistik, 1999; Jakarta.
3. Ministry of Agriculture. Bulletin Informasi Agribisnis: October– December 1998. Understanding the 1998 crisis–supply, demand or supply failure. In: Simatupang P, Pasaribu S, Bahri S, Stringer R, eds. Indonesia’s economic crisis: effects on agriculture and policy responses. University of Adelaide, 1999; 75.
4. Helen Keller International Bulletin Crisis No. 1–4. Jakarta: Helen Keller International. 1999.
5. Directorate of Nutrition. Monthly report on the incidence of severe malnutrition from the provinces in Indonesia. Jakarta: Department of Health, 1999.
6. Jahari AB, Sandjaja, Sudiman Het al.Nutrition status of under-five children in the period of 1989–98. Proceedings, Widyakarya Nasional VII Pangan dan Gizi, LIPI, Jakarta 2000.
7. Feridhanusetyawan T. Social impact of the Indonesian economic crisis. Indonesian Q 1998; 15: 1–4.
Table 2. Rice imports to Indonesia from 1985 to 1998
Import Export Export – Imports (tons) (tons) (tons) 1985 33 800 403 123 +371 332 1986 27 800 240 691 +212 691 1987 55 000 118 641 +63 641 1993 24 317 564 000 +539 663 1994 633 048 233 000 –400 048 1995 1 807 875
1996 2 149 810 1997 2 500 000*
1998 3 100 000 (planned)*
Data from Himpunan Kerukunan Tani Indonesia/Kompas (9 June 1998).* Badan Urusan Logistik (BULOG) Estimates: 1997, 3582 tons; 1998, 4200 tons.8 Actual imports in 1998 by BULOG: 5782 tons (Sawit H. Seminar Lokakarya Penyusunan Kebijakan Perberasan, IPB-Department of Agriculture, Bognor, Indonesia, 2000).
Table 3. Availability of cereals (rice, wheat, corn) in Indo-nesia from 1970 to 1998
8. Tabor SR, Dillon HS, Husein Sawit M. Understanding the 1998 food crisis: supply, demand and policy failure. In Simatupang P, Pasaribu S, Bahri S, Sringer R, eds. Proceedings of the International Seminar on Agricultural Sector During the Turbulence of Economic Crisis, 17–19 February 1999 Bogor, Indonesia. University of Ade-laide, 1999; 75–110.
9. Soekirman, Karyadi D. Nutrition surveillance: A planner’s perspec-tive. Food Nutr Bull 1995; 16: 112–114.
10. Simatupang P. Toward sustainable food security: The need for a new paradigm. In: Simatupang P, Pasaribu S, Bahri S, Sringer R,
eds. Proceedings of the International Seminar on Agricultural Sector During the Turbulence of Economic Crisis, 17–19 February 1999 Bogor, Indonesia. University of Adelaide, 1999; 141–168. 11. Frankenberg E, Beegle K, Sikoki B et al. Health, family planning
and well-being in Indonesia during economic crisis: Final Report. RAND, Santa Monica, CA. 1998.