AN ASSOCIATION MODEL OF THE CHANGING COLOR
INDICATOR OF SMART PACKAGING AND PRODUCT
QUALITY
ELFA SUSANTI THAMRIN
GRADUATE SCHOOL
BOGOR AGRICULTURAL UNIVERSITY BOGOR
DECLARATION OF ORIGINALITY
AND COPYRIGHT TRANSFER*
Hereby, I declare that the thesis entitled An Association Model of The Changing Color Indicator of Smart Packaging and Product Quality is my own work under supervision of Dr Endang Warsiki, STP MSi and Dr Eng Taufik Djatna, STP MSi. It has never previously been published in any university. All of incorporated originated references from other published as well as unpublished papers are stated clearly in the text as well as in the references.
Hereby, I state that the copyright to this paper is transferred to Bogor Agricultural University.
Bogor, May 2015
SUMMARY
ELFA SUSANTI THAMRIN. An Association Model of The Changing Color Indicator of Smart Packaging and Product Quality. Supervised by ENDANG WARSIKI and TAUFIK DJATNA.
Smart packaging is an innovation in the field of packaging that can monitor and provide information to producers and consumers about the quality of the packaged product. TTI (Time Temperature Indicator) is one of smart packaging as an indicator label that can record temperature and time history of a packaged product during distribution and storage. In Indonesia, there have been several studies on the indicator labels to monitor the temperature history of the product. This label is a crucial indicator for customers to get real information and to minimize the risk dealing with expiry storage that affect the product quality. The color change was in line with the quality changes of the product during storage. Nowadays, there is no exact model to relate both of the changing between the label and the product quality. Thus, association model is required an to relate discoloration smart packaging indicator with the packaged product quality change. The objectives of this research are to identify the association parameters, to select the important attribute which sufficiently describes the relationship and furthermore this research is to develop an association model of discoloration of smart packaging indicator with natural dyes and the quality changes.
This research focused on modeling the association of the discoloration indicator label and the quality change of packaged products and then connecting between the two. One technique that is used to connect a combination was by applying association rules of a combination of items. Before the model was associated, it took an identification of parameters that will be used in the modeling.
Parameter identification conducted by literature study and collects the primer or secondary data. Parameter identification may process generate a lot of parameters, so it necessary to use particular method to select the important parameter attributes which sufficiently describes the relationship between the changes of indicator color and the changes of product quality. It used a Relief (Reliable Eliminated of Feature) method. Relief is an attribute selection algorithm on binary classification.
At initial stage, data were obtained from a previous research in the form of data °Hue, the value of L*; a*; b* (the values were to obtain the value of ΔE), preference (hedonic) value and total colony of dairy products with labels of ERPA (Aerva sanguinolenta) leaves. The data was discretized to classify the data °Hue, ΔE, consumer preferences and the total colony into categorical value.
Selection of attributes by using the Relief method showed that there were three attributes with the highest weight value (Wi). The quality parameter of
organoleptic value (preference of consumers) with weight value is 0.423, ΔE value with weight value is 0.262, and ° Hue with weight value is -0.0103. Those were the important parameters and sufficiently describing the relationship of discoloration and product quality changes.
packaging indicator and product quality changes parameter. The rules were generated by calculating the support, confidence, lift and bond measure values from each combination of itemsets. One of the association model which was obtained from the association analysis with the ARM method is {° Hue = red, ΔE = low, hedonic = like, colony = safe } → {color indicator = red} with the support of 30.7% (the occurance is 30.7% of the whole experiment), confidence 100% (100% probability of the indicator color was red if the °Hue is red, low ΔE value, consumers like, and safe from contamination), bond 40% (there was a 40% joint frequency of the relationship), and lift > 1% indicated the color change and quality changes which correlated positively (the rules can be used). Practically, the association rules facilitate the consumers and researchers to predict the quality products which were adhered smart label indicator in computerized.
Smart label initially red in color, became progressively yellow as product approached the end of shelf life and consumers advised not to consume the product if the smart label turned to yellow in color. The color changes due to changes in temperature during storage in the refrigerator because of the activities which opened and closed the refrigerator repeatedly.
The statistical significance test concluded that all of the rules were productive rules because they had extremely small which could safely reject the null hypothesis. These rules were representative the real condition of association between discoloration and quality product changes in observed data.
The development of association model changing color indicator of smart packaging and product quality applied to several types of products which must keep in cold temperature or cold chain products. The further researches need to develop the association model in several types of products in predicting the quality of the product to minimize the cost and time of the research.
RINGKASAN
ELFA SUSANTI THAMRIN. Model Asosiasi Perubahan Warna pada Indikator Kemasan Cerdas dan Perubahan Mutu Produk. Dibimbing oleh ENDANG WARSIKI dan TAUFIK DJATNA.
Kemasan cerdas merupakan suatu inovasi dalam bidang kemasan yang dapat memantau dan memberikan informasi kepada produsen dan konsumen perihal kualitas produk yang dikemas. TTI (Time Temperature Indicator) merupakan salah satu pengembangan kemasan cerdas yang merupakan label indikator yang dapat mencatat sejarah waktu dan suhu dari suatu produk yang dikemas selama distribusi dan penyimpanan. Di Indonesia sudah ada beberapa kajian mengenai label indikator untuk memonitor sejarah suhu dari produk. Kemasan cerdas merupakan indikator yang sangat penting bagi konsumen untuk mendapatkan informasi dan untuk meminimalkan resiko yang berhubungan dengan kadaluarsa penyimpanan yang berdampak pada kualitas produk. Perubahan warna sejalan dengan terjadinya perubahan mutu produk selama masa penyimpanan dan saat ini belum ada perhitungan kuantifikasi yang menghubungkan keduanya. Sehingga, model asosiasi dibutuhkan untuk menghubungkan antara perubahan warna indikator kemasan cerdas dengan terjadinya perubahan kualitas produk yang dikemas.
Tujuan dari penelitian ini yaitu mengidentifikasi parameter asosiasi, memilih atribut yang penting dan cukup untuk menggambarkan hubungan dan mengembangkan model asosiasi perubahan warna indikator kemasan cerdas dengan pewarna alami dan perubahan mutu produk.
Penelitian ini berfokus pada pemodelan asosiasi perubahan warna label indikator kemasan cerdas dan perubahan mutu produk yang dikemas dan menghubungkan antara keduanya. Salah satu teknik yang dapat digunakan untuk menghubungkan suatu kombinasi yaitu dengan menerapkan aturan hubungan asosiatif (Association rules) dari suatu kombinasi item. Sebelum dilakukan pemodelan asosiasi, dibutuhkan suatu identifikasi parameter-parameter yang akan digunakan dalam pemodelan.
Identifikasi parameter dapat dilakukan dengan studi literatur dan pengumpulan data primer atau sekunder. Proses identifikasi parameter mungkin menghasilkan banyak parameter sehingga dibutuhkan suatu metode untuk memilih atribut parameter yang penting dan cukup untuk menggambarkan hubungan antara perubahan warna indikator dan perubahan mutu produk. Peneliti menggunakan metode Relief (Reliable Eliminated of Feature). Relief merupakan algoritma pemilihan atribut pada binary classification.
Awalnya, data diperoleh dari penelitian sebelumnya berupa data nilai Hue, nilai L*; a*; b* (untuk mendapat nilai ∆E), nilai uji organoleptik (kesukaan konsumen) dan total koloni produk pada penyimpanan produk susu dengan label indikator kemasan cerdas dari daun erpa. Data didiskretisasi untuk mengklasifikasikan data Hue, nilai ∆E, nilai kesukaan konsumen dan total koloni menjadi nilai kategori.
Pemilihan atribut dengan menggunakan metode Relief menunjukkan bahwa terdapat tiga atribut dengan nilai bobot (Wi) tertinggi. Parameter mutu nilai
bobot 0.262, dan nilai °Hue dengan nilai bobot -0,0103. Parameter ini merupakan parameter yang penting dan cukup menggambarkan hubungan dari perubahan warna dan perubahan mutu produk.
Pengembangan model asosiasi dengan menggunakan kaidah aturan asosiasi (Association Rules Mining) membentuk 77 aturan yang memiliki hubungan yang kuat antara terjadinya perubahan warna label indikator kemasan cerdas dan perubahan mutu produk. Aturan ini diperoleh dengan perhitungan nilai support, confidence, lift dan bond dari masing-masing kombinasi itemsets. Proses kombinasi itemsets hingga kombinasi 5 itemsets. Salah satu model asosiasi yang dibentuk dari analisa asosiasi dengan metode Association Rules Mining yaitu
{° Hue = red, ΔE = low, hedonic = like, colony = safe } → {color indicator = red} dengan nilai support 30,7% (kejadian munculnya hubungan adalah 30,7% dari seluruh percobaan), confidence 100% (100% kemungkinan warna indikator merah apabila nilai Hue merah, nilai ∆E rendah, konsumen suka, dan aman dari kontaminasi), bond 40% (terdapat 40% frekuensi bersama dari terjadinya hubungan keduanya), dan lift > 1% menunjukkan terjadinya perubahan warna dan perubahan mutu berkorelasi positif (rules tersebut dapat digunakan). Secara praktis, aturan asosiasi ini dapat memfasilitasi konsumen dan peneliti untuk memprediksi kualitas prduk yang dilekatkan indikator label cerdas secara komputerisasi.
Label cerdas pada awalnya berwarna merah, kemudian berangsur-angsur mejadi warna kuning ketika produk mencapai akhir dari umur simpannya dan konsumen disarankan untuk tidak mengkonsumsi produk jika label cerdas berubah menjadi warna kuning. Perubahan warna dikarenakan perubahan suhu selama penyimpanan didalam kulkas (refrigerator) karena adanya kegiatan membuka dan menutup kulkas secara berulang-ulang.
Pengujian statistical significance dapat disimpulkan bahwa semua rules adalah rules yang produktif karena memiliki nilai yang sangat kecil yang dapat menolak H0. Rules ini merepresentasikan kondisi nyata dari
asosiasi antara perubahan warna dan perubahan kualitas produk pada data pengamatan.
Pengembangan model asosiasi antara perubahan warna kemasan cerdas dan perubahan kualitas produk diaplikasikan pada beberapa jenis produk yang harus disimpan pada suhu dingin atau produk rantai dingin. Peneliti selanjutnya perlu mengembangkan model asosiasi pada beberapa jenis produk dalam memprediksi kualitas produk untuk meminimalkan biaya dan waktu penelitian.
©Copyright 2015 by IPB
All Rights Reserved
No Part or all of this thesis may be excerpted without or mentioning the sources. Excerption only for research and education use, writing for scientific papers,
reporting, critical writing or reviewing of a problem. Excerption doesn’t inflict a financial loss in the paper interest of IPB.
Thesis
as partial fulfillment of the requirements for the degree of Master of Science in the Agroindustrial Technology Study Program
AN ASSOCIATION MODEL OF THE CHANGING COLOR
INDICATOR OF SMART PACKAGING AND PRODUCT
QUALITY
GRADUATE SCHOOL
BOGOR AGRICULTURAL UNIVERSITY BOGOR
2015
Thesis Title : An Association Model of the Changing Color Indicator of Smart Packaging and Product Quality
Name : Elfa Susanti Thamrin Student ID : F351120021
Approved by Supervisor
Dr Endang Warsiki, STP MSi Chairman
Dr Eng Taufik Djatna, STP MSi Member
Acknowleged by
Head of
Agroindustrial Technology Study Program
Prof Dr Ir Machfud, MS
Dean of Graduate School
Dr Ir Dahrul Syah, MScAgr
Examination date: April 13th 2015
PREFACE
I would like to thank Allah Subhanahu Wa Ta’ala for all His gifts so that this research is successfully completed. The theme chosen in the research which conducted during July 2014 is association model, with the title of An Association Model of The Changing Color Indicator of Smart Packaging and Product Quality.
I would like to express my sincere gratitude to Dr Endang Warsiki as Chair of Advisory Committee for her support and encouragement during my study in Bogor Agricultural University. I am very grateful to Dr Eng Taufik Djatna as Member of Advisory Committee for his advice and supervision during the thesis work. I would like to say many thanks to my family H. Thamrin (father) and Hj. Hartati (mother), Hafiz Fajar Saputra (brother), Miftahul Jannah (sister), Rahmat Saleh (brother), Muhammad Taufiq for their true and endless love, for never failing patience and encouragement.
I would like to thank all lecturers and staff of Agroindustrial Technology Department, all of my colleagues, especially my best friend in Agro-industrial Technology (Elfira Febriani, Nina Hairiyah, Nova Alemina Sitepu, Eddwina Aidil Fitria and M. Rafi), colleagues in Computer Laboratory of Agro-industrial Technology Department (M. Zaki Hadi, Novi Purnama Sari, Riva Aktivia, Hetty Handayani Hidayat, Aditya Ginantaka, IB Dharma Yogha, Rahmawati, Azri Firwan, Rohmah, Fajar Munichputranto, Husnul Khotimah, Puspa, Aisyah, Yudhis, Ikhsan, Imam, Denny, Septian), Teguh Pamungkas, Aziz Rahmad, Iswahyudi, all of colleagues in Agro-industrial Technology 2012 and 2013, and colleagues in IMPACS IPB for their support. It has been a pleasure to work with you.
Hopefully this thesis is useful.
TABLE OF CONTENTS
TABLE OF CONTENTS v
LIST OF TABLES vi
LIST OF FIGURES vi
LIST OF APPENDIX vi
1 INTRODUCTION 1
Background of Research 1
Problem Statement of Research 2
Objective of Research 2
Benefit of Research 2
Boundaries of Research 2
2 LITERATURE REVIEW 3
The Color Changes 3
The Quality Changes 5
Association Rule Mining 6
Smart Packaging 7
Previous Research 10
3 METHODOLOGY 11
Research Framework 11
Identification of Association Parameter 12
Attribute Selection Analysis 13
Association Analysis of Discoloration 14
Model Evaluation 16
4 RESULT AND DISCUSSION 17
Identification of Parameter 17
Selection of Attributes 18
Association Rules Model 19
Association Model Evaluation 26
5 CONCLUSION AND RECOMMENDATION 28
Conclusion 28
Recommendation 29
REFERENCES 29
APPENDIXES 33
GLOSSARY 51
LIST OF TABLES
1 Discretization of the data 18
2 The maximum weight (W) of variable combinations 18
3 The quality parameters that affect the color change indicator 19 4 The causal relationship color changes with product quality changes 19
5 The combination of 5-itemsets 21
6 Association Rules 22
7 The matrix of Top-10 Ranking Association Rules 22
8 Kinetic model of pasteurized milk color quality changes 26 9 Contingency table for Z and Y, conditional on W= X Z 26
LIST OF FIGURES
1 Color graph of L*, a*, b* (chrome dan ºhue) 3
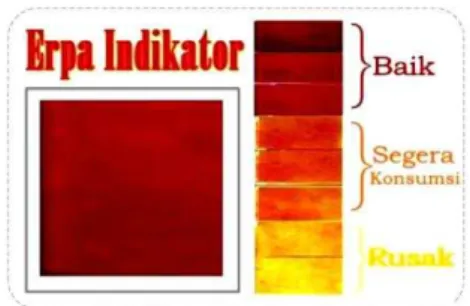
2 Color indicator label (Nofrida 2013) 11
3 Research Framework 12
4 Flow diagram of identification association parameter 12
5 Flow diagram of selection important parameter 13
6 Flow diagram of association rule stage 16
7 Flow diagram of the computer program of association rules for smart
packaging 17
8 Combination process of 2 items 20
9 The relationship between ln value of total colony and storage times at
refrigerator temperature and room temperature 25
10 Arrhenius equation plot from ln of total colony 25
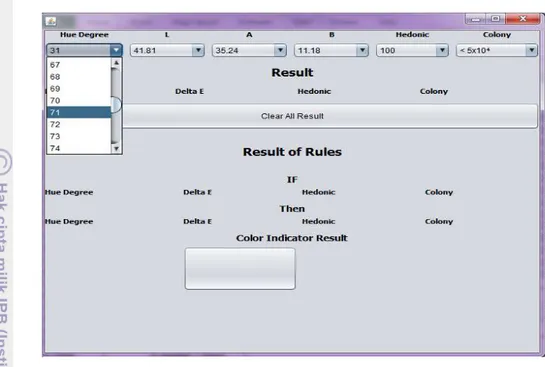
11 Program interface 28
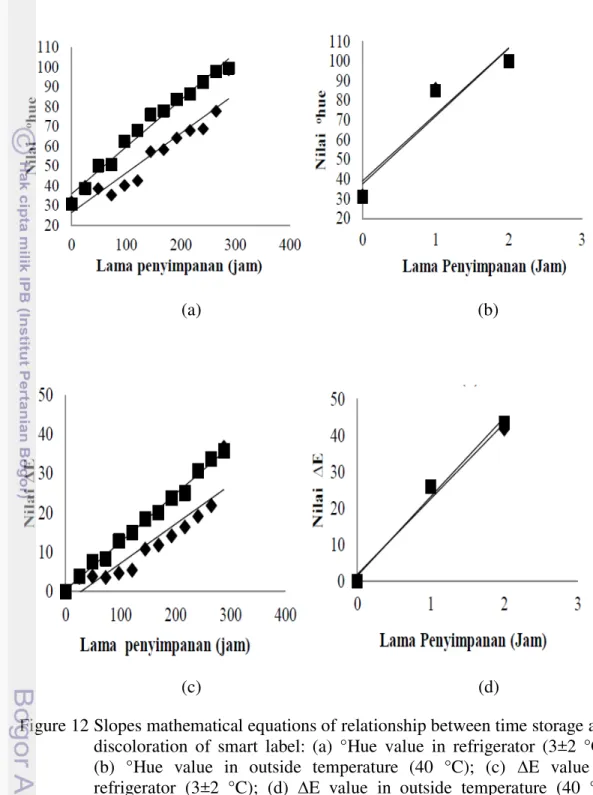
12 Slopes mathematical equations of relationship between time storage and
discoloration of smart label 41
13 User selects the value in combo box 49
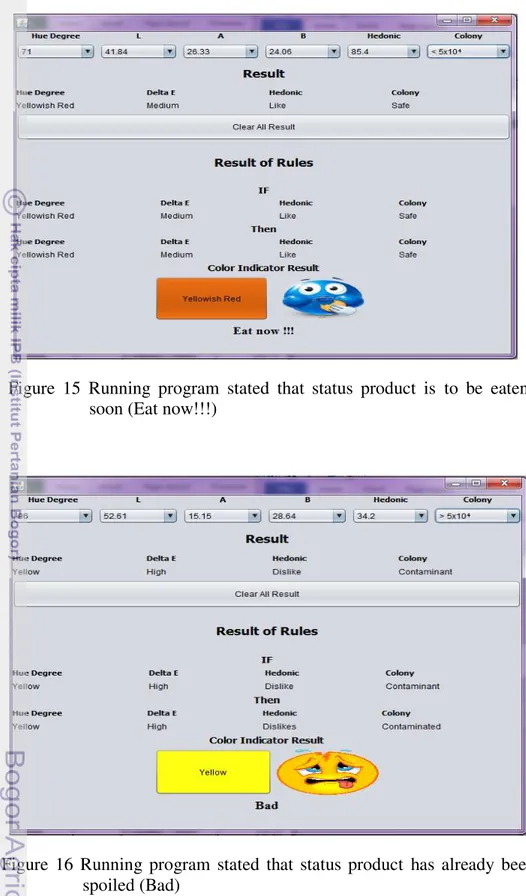
14 Running program stated that status product is “Good” 49 15 Running program stated that status product is to be eaten soon (Eat now!!!) 50 16 Running program stated that status product has already been spoiled (Bad) 50
LIST OF APPENDIX
1 Research database in refrigerator temperature (3 ± 2° C) 33
1
INTRODUCTION
Background of Research
Smart packaging is an innovation in the field of packaging that can monitor and provide information to producers and consumers about the quality of the packaged product. Smart packaging has an indicator adhered inside or outside of the packaging, which is able to provide information about the condition of the packaging and or quality of the food inside (Robetson 2006). TTI (Time Temperature Indicator) is one of smart packaging in form of a label (indicator) that can record temperature and time history of a packaged product during distribution and storage. The indicator will provide information about the changing of product quality by changing the color label (Wanihsuksombat et al. 2010).
The temperature and time indicators have been applied to reflect exposure of cold temperatures and frozen products such as marine products (Hasnedi et al. 2010), horticulture (Warsiki and Putri 2012), dairy products (Nofrida et al. 2013), as well as poultry and meat products (Vaikousi et al. 2009). In addition, TTI also has been applied to pasteurized and sterilized products as to estimate the shelf life of food products (Wanihsuksombat et al. 2010).
In Indonesia, there have been several studies on the indicator labels to monitor the temperature history of the product. Previous research of Warsiki and Putri (2012) shows that the color of film-indicator with synthetic dyes is changing along with degradation of the sliced-pineapple quality during storage. The color of film indicator shifted from bright red to pink because of degradation of acid content of sliced pineapple during storage. The result of Nofrida‟s work (2013) shows that the color of film-indicator of smart packaging with natural dyes from Aerva sanguinolenta stored at 40° C shifted from red to yellow within two hours. Furthermore, the research showed that the label‟s color yellow in one day at room temperature, and at refrigerator temperature (3±2 °C), the smart packaging indicator turned to yellowish red on the 8th day and turned into bright yellow on the 12th day, whereas, the color in film indicator stored at freezer temperature changed a bit after 78 days. Smart label was then applied to pasteurized milk products.
Parameters such as Hue, value of L*; a*; b*, preference (hedonic) value, total colony and color indicator of smart label are identified as results of literature study and primary or secondary data collection. Parameter identification process may generate lot of parameters, so it necessary to use particular method to select the important parameter attribute which sufficiently describe the relationship between the changes of indicator color and the changes of product quality. In this research Relief (Reliable Eliminated of Feature) method is used. Relief is an attribute selection algorithm on binary classification (Kira and Rendell 1992).
2
parameters. It is required an association between discoloration of smart packaging indicator and the packaged-product quality-change.
Focus of this research is making an association model of indicator color changes and the changes of packaged product quality to give a solution of problems. One technique is used to connect a combination is by applying a‟priori algorithm. A‟priori algorithm is one of data mining techniques for data retrieval using association rules of itemsets combination.
Association rules mining (ARM) is commonly referred as market basket analysis. This is because the use of association rules mining can help manufacturers or retailers to make decisions in running the business by analyzing the consumer purchasing behavior. The mechanism of the association rules is to calculating the value of support, confidence, lift and bond of relationship items. If the support value is greater than the minimum support and confidence value is greater than the minimum confidence, it determines an association rules from a combination of items (Yin et al. 2011).
Problem Statement of Research
Nowadays, there is no exact model to show the relation of the changing between the label and the product quality. The challenge in this research is to find a causal relationship between the color change and the quality changes of the packaged products. The value of parameters; ΔE, °Hue, preference and total are based on previous researcher‟s result, that have been analyzed by previous researchers and also to classify the causal relationship.
Objective of Research
The objectives of this research are to identify the association parameters, to select the important attribute and sufficiently describing the relationship and furthermore this research is to develop an association model of discoloration of smart packaging indicator with natural dyes and the quality changes.
Benefit of Research
This research is expected to formulate a relationship model of the changing color of smart label and product quality. The result is expected to facilitate prediction of product quality using smart packaging instead of conducting laboratory test.
Boundaries of Research
3 analysis of smart label which‟s stored in refrigerator temperature (3 ± 2° C) during 12 days. These assumed data are able to generate causal relationship between the changing color of label and product quality to set the rules which will serve as a basis in predicting the other products.
2
LITERATURE REVIEW
The Color Changes
Color becomes an important thing for human and agro industry product. By using color, it can appraise the product quality. Color is the important factor in sensory estimation due to give information about the quality of products (Setiautami 2013). Three factors are related to the color which is captured by sight sense; shine source, chemistry and physics object characteristics, and spectrum sensitivity characteristic (Putri 2012).
There are two methods for color measurement; they are subjective and objective method. The subjective method is conducted directly by sight sense and assisted by chromaticity diagram. The second one, the objective color measurement uses analytical instrument, such as chrome meter and spectrophotometer. Chrome meter can detect spectral ray deviation from light emission automatically. The measuring results are in output color system CIE (Commission Internationale d‟Eclairage), color system Hunter LAB and color system CIELAB. In a general way, CIELAB system is commonly used by users (MacDougall 2002). Chrome meter is used for measuring solid sample, whereas spectrophotometer for measuring liquid samples.
CIE system describes the color using Y symbol, Hunter LAB system interpreted color as XYZ and CIELAB interpreted color as L*, a*, b* and additional requirements such as Hue (h), chrome value (C) and total of color difference (ΔE) (MacDougall 2002).
The color change of smart label TTI is measured by chrome meter which explained as total of color difference (ΔE) (Wanihsuksombat et al. 2010):
2 2 2
( ) ( ) ( )
E L a b (1)
4
Where ΔL* is brightness degree (0) black and (+100) white, Δa* is difference of greenish degree (-60) and florid degree (+60), Δb* is difference of deep blue (-60) and yellowness (+60) (Vaikousi et al. 2009; Kim et al. 2012). The value of Hue shows the chrome degree on chromatic revolution which is seeing by sight sense.
Dye materials are in two categories, namely natural dye and synthetic dye. Natural dye is dye material for food product which the materials were took from the plants (chlorophyll, anthocyanin, bixsin, curcumin, and carotene), animals (myoglobin and hemoglobin), caramel and mineral dye. Natural dye is safe and added into the other food materials. The weaknesses of natural dye are instability, weakness of color effort, and limited of color variations. These cases motivate the producer to use synthetic dye as addition in food and drink products. Synthetic dye is soluble easier in the water, more stable, more interesting, distributed the food color, and brought back the color of base material which turned during process (Warsiki and Putri 2012). Synthetic dye which is usually found in food product, namely sunset yellow, tartrazine, carmoisin, and ponceau 4R. Except that there are rhodamin B and metanil yellow. The synthetic dye is toxic for human health (Sumarlin 2008).
One of the natural dyes used are anthocyanins. Stability of anthocyanin is influenced by the structure and anthocyanin concentration, temperature, pH, oxygen, light, ascorbic acid, sugar and sulfite (Jackman and Smith 1996).
Anthocyanin dominant structure is in the form of the flavium cation core protonation and electron deficiency in acidic conditions. When the pH value is increase, flavium cation is unstable and prone to structural transformation into a colorless compound (kalkon) (Jackman and Smith 1996).
Oxygen causes oxidation of anthocyanin then become colorless compound that lowers the color stability of anthocyanins (Ningrum 2005). Light has a certain energy which stimulates the occurrence of photochemical reactions (photooxidation) are able to cause carbon ring number 2 was opening. Photooxidation reaction is capable of forming a colorless compound (degradation indicator) (Nofrida 2013). The increase in temperature resulted in deterioration and discoloration anthocyanins quickly through the hydrolysis process of glycosidic anthocyanin and produce open aglycone ring so formed groups‟ carbinol and kalkon which is colorless (Nofrida 2013).
According Nofrida (2013), the increase in the value of L* on the indicator label with ERPA leaf dye occured due to anthocyanin degradation process under the influence of temperature, the higher of storage temperature then the faster the L* value increased because of the color samples are nearly white. Inversely proportional to the measurement of a* value, the higher of storage temperature then the faster a* value decreased due to a decrease in the degree of redness caused an increase in the reaction rate of structural transformation of flavium cations (red) into kalkon (colorless). While the value of b* increased due to an increase in the storage temperature. Increased temperature and light cause anthocyanin compounds are degraded more rapidly becoming kalkon compounds.
5 temperature increase and storage time led to the value °Hue increase (Nofrida 2013).
Synthetic dyes are sensitive to acidic conditions. If the synthetic dye contacts with the acidic conditions then occur degradation in synthetic dyes became more faded (Putri 2012).
The Quality Changes
Deterioration is a deviation of the product from the first quality. The degradation of food product is occurred when there are some products digressions after they are produced (Nurkhoeriyati 2007). The reaction of deterioration conducts when the product contacts to the environment directly or there is beating of mechanical. The deterioration occurs when the product contacts to the environment directly due to contact with the air, oxygen, light, aqueous vapor or there is temperature change. The degree of deterioration influenced with storage time, and rate of degradation influenced with environment condition of storage (Savitri 2000).
Determination the quality of food stuffs generally were on several factors; taste, color, texture, nutritional value and microbiological properties. Pasteurized milk is very susceptible to high temperatures, the packaging showed that milk able to damage faster than the expiration date when stored at temperatures > 5°C. The quality of pasteurized milk through organoleptic and total plate test which stored at refrigerator temperature (3 ± 2° C) and room temperature (25 ± 3° C) (Nofrida 2013). The main cause of milk deterioration is microbes (bacteria), it due to the high nutrient content of milk become the preferred medium of microorganisms to grow and thrive. Lactic acid is formed as a result of lactose fermentation by lactic acid bacteria and other bacterial contamination (E. coli). The maximum limit of microbial contamination in milk is 5x10⁴ colonies / mL (Nofrida 2013).
Pasteurized milk is milk that has undergone a heating process at a temperature of 72 °C for 15 seconds, namely High Temperature Short Time (HTST) or heating at 63 °C-66 °C, namely Low Temperature Low Time (LTLT) for 30 minutes, then immediately is cooled to 10 °C. Furthermore, it is treated aseptically and stored at a maximum temperature 4.4 °C to increase the shelf life of milk. The temperature does not cause spoilage microbes die, but no longer able to grow and reproduce. During the microbial spoilage are not active, then the milk remain durable and good to eat (Mulyani 2011).
Pasteurized milk quality testing refers to SNI No 01-3141-1998 which is testing i.e. color, smell, taste, alcohol test, density, fat content, protein content, the degree of acid, microbial contamination (TPC, E. coli, Salmonella) and metal contamination (Mulyani 2011). As a result of a variety of chemical reactions that occur in food products are accumulative and irreversible during storage, so that at certain times of the reaction products result unacceptable food quality (Nurkhoeriyati 2007).
6
form (cold chain product) or in cold conditions parameters such as the growth of microbes (Nurkhoeriyati 2007).
The changes of fruit quality are affected by water content, total acid, fruit hardness, pH levels and vitamin C. The high water content of fruit makes the fruit easily damaged if it does not conduct handling during storage. Minimally processed fruits undergo browning faster because a polyphenol oxidase compound catalyzes the phenol oxidation to be o-quinone compound. Spontaneously, it carries out the polymerization reaction to be brown color pigment (melanin). One way to prevent browning in fruits and vegetables is by cold storage. Total acid of fruit increased during storage because of the hydrolysis of starch into simple sugars and then converted into organic acids that cause a decrease in the pH value on the fruit (Putri 2012).
According to Labuza (1982), the reaction of food quality changes can be explained by the order of zero and one. The types of deterioration that follow zero-order kinetics include enzymatic breakdown reactions, enzymatic browning and oxidation reactions. Degradation of zero-order reaction is constant, the speed of degradation takes place remains at a constant temperature. The types of deterioration that followed the first order are rancidity, microbial growth, off flavor production by microbes in meat, fish and poultry, destruction of vitamins and protein degradation.
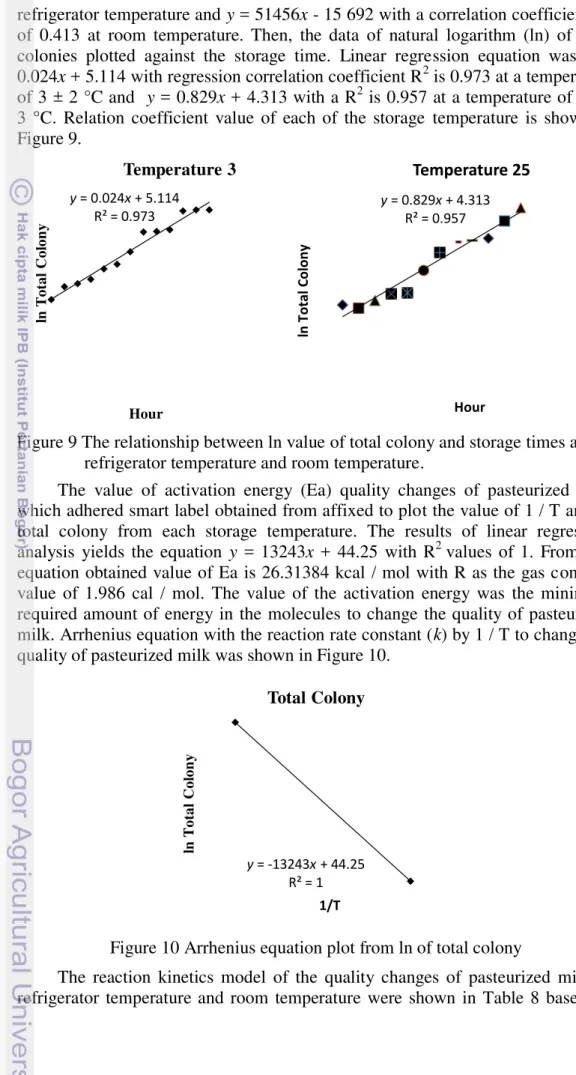
The calculation of reaction kinetics of quality changes based on parameters of total colony in pasteurized milk by means of looking for ln score of total colonies in refrigerator temperature 3 ± 2 °C and room temperature 25±3 °C. The obtained results are then plotted on a graph the relationship between the score ln as the y-axis and storage time as the x axis. Thereafter, it looks for the value of a constant (k) quality changes per day were derived from the slope of the regression equation graph. After the k value is obtained, and then it searched ln k values for each storage temperature. Hereafter Arrhenius plot is devised by the x-axis represent the value of 1 / T (K-1) and the y-axis declared ln k value at each storage temperatures. Linear regressions obtained in this Arrhenius curves were predict the quality changes of products by using the Arrhenius formula:
0 kt t
Q Q e (2)
Where, Qt is the total colony that has changed the quality, Q0 is the total
initial colony, e is the base value of the natural logarithm, k is a constant, t is time storage Labuza 1982; Nurkhoeriyati 2007).
Association Rule Mining
Data mining is a generic term which covers research results, techniques and tools used to extract useful information from large databases (Niu and Chen 2013). Association rule is one of the most popular data mining techniques widely used for discovering interesting association and correlation between data elements in a diverse range of application (Agrawal and Srikant 1994; Kotsiantis and Kanellopoulus 2006; Shaharanee et al. 2010; Özseyhan et al. 2012; Niu and Chen 2013).
7 Omiecinski (2003) gave an example “we may find that 95 percent of the customers who bought bread also bought milk”. A rule may contain more than one item in the antecedent and the consequent of the rule. Association rules mining (ARM) is useful for discovering relationships among data and application to many different domains including market basket and risk analysis in commercial environments, clinical medicine, epidemiology, crime prevention, and fluid dynamics (Niu and Chen 2013).
In association rules mining, every rule must satisfy two user specified constraint; one is a measure of statistical significance called support and the other a measurement of goodness of the rule called confidence (Omiecinski 2003). But according to Han and Kamber (2012) to discover interesting rules efficiently, three main sets of constraints on significance and interest of the rules are defined, these are support, confidence, and lift. According to the original definition based on Agrawal and Srikant (1994), support (supp(X,Y)) of a rule is the proportion of transactions including item sets (X Y) over all transactions. Confidence is the proportion of transactions that fulfill the rule completely over the ones having only the left-hand-side of the rule true. Lift measures how much the observed confidence of the rule deviates from the expected confidence. The other measurement of association rules in data mining is bond. Bond measure is much the same with support measure. Bond measure knows about relationship ratio of items from total transactions of the items, whereas support knew about relationship of items from over all transactions (Erniyati 2013).
The problem of mining association rules is to generate all rules that have support and confidence greater than some user specified minimum support and minimum confidence thresholds (Omiecinski 2003; Niu and Chen 2013). The minimum support threshold and minimum confidence threshold can be set users or domain experts (Raorane et al. 2012). Rules that satisfy both a minimum support threshold and minimum confidence threshold are called strong (Raorane et al. 2012).
Smart Packaging
Ahvenainen (2003) asserted “modern packaging consist of two types, namely active packaging to change the condition of the packed food to extend shelf life or to improve safety or sensory properties, while maintaining the quality of the packaged food, and smart packaging as systems monitor the condition of packaged foods to give information about the packaged food during transport and storage”. Smart packaging is packaging which senses and informs the condition of the product. Thus, the term can be used in a broad sense including features concerning product identify, authenticity, and traceability, tamper evidence and theft protections as well as safety and quality issues (Kuswandi et al. 2011).
8
question is whether, for example, a slice fruits is safe to use or consume, and currently this is answered by “best before” date stamping (Kuswandi et al. 2011)
The intelligent packaging or smart packaging includes indicators to be used for quality control of packed food. They can be external indicators, for example indicators which are adhered outside the packages (time temperature indicator), and so called internal indicators which are placed inside the package, either to the head-space of the package or adhered into the lid. Some of indicators which are placed inside, namely oxygen indicators for indication of oxygen or package leak, carbon dioxide indicators, microbial growth indicators and pathogen indicators (Ahvenainen 2003).
Time and temperature indicator was already applied to represent the products which have cool and frozen storage such marine products (Taoukis et al. 1999; Mendoza 2003; Hasnedi et al. 2010), horticulture product (Bobelyn et al.
Time-temperature indicator has working mechanism based on different principle namely chemical, physical, and biological. For chemical or physical response, it is based on chemical reaction or physical change towards time and temperature. While for biological response, it is based on the change in biological activity, such as microorganism, spores, enzymes towards time or temperature (Kuswandi et al.2011).
Time temperature indicator that has been commercialized namely 3MTM Monitor MarkTM, Fresh-Check® TTI, CheckPoint® TTI, OnVu TTI, TT Sensor TTI, Timestrips® TTI (Kuswandi et al. 2011; Pavelková 2013).
The 3MTM Monitor MarkTM is diffusion-based indicator label and is on the color change of an oxidable chemical system controlled by temperature-dependent permeation through a film (Pavelková 2013). A film strip separates the wick from the reservoir that is removed at the activation stage. At this point, the porous wick, white in color, is shown in the window. Upon exposure to a temperature exceeding the critical temperature, the substance melts and begins to diffuse through the porous wick, causing a blue coloring to appear (Kuswandi et al. 2011). Response of the indicator is measured by the progression of the blue dye along the track, and this is complete when all five windows are blue. The working principle is based on the melting and diffusion of the blue dye. The label change color when exposed to higher than recommended storage temperature and will also change as the product reaches the end of shelf life.
9 rapidly the polymer change in color Consumers are advised not to consume or purchase the product, regardless of the “use-by” date. This indicator may be applied to packages of perishable products to ensure consumers at point-of-purchase and at home that the product is still fresh. These indicators have been used on fruit cake, lettuce, milk, chilled food (Kuswandi et al. 2011; Pavelková 2013).
The CheckPoint® TTI is a simple adhesive label on enzymatic system. These labels react to time and temperature in the same way that food product react, and thus give a signal about the state of freshness and remaining shelf-life. The TTI is based on a color change caused by a pH decrease that is the result of a controlled enzymatic hydrolysis of a lipid substrate. Hydrolysis of the substrate causes acid release and the pH drop is translated into a color change of a pH indicator from deep green to bright yellow to orange red (Pavelková 2013). This CheckPoint® devices consists of a bubble-like dot containing two compartments; one for the enzyme solution, lipase plus pH indicating dye and the other one for the substrate, consisting primarily of triglycerides. The dot activated at the beginning of the monitoring period by application of pressure on the plastic bubble, which breaks the seal between compartments. The ingredients are mixed and as the reaction proceed a pH change results in a color change (Kuswandi et al. 2011). There are two configurations i.e., CheckPoint®I (single dot) is used for transmit temperature monitoring of cartoons and pellets of product. The other one is CheckPoint®III (triple dot) is especially used in the wholesale distribution chain and incorporate three graded responses in a single label (Kuswandi et al. 2011).
The OnVu TTI is a newly introduced solid state reaction TTI. It is based on photosensitive compounds; organic pigments e.g. benzylpyridines, that change color with time at rates determined by temperature. The TTI labels consist of a heart shaped „apple‟ motif containing an inner heart shape. The image is stable until activated by UV light from an LED lamp, when the inner heart changes to a deep blue color. A filter is then added over the label to prevent it being recharged. The blue inner heart changes to white as a function of time and temperature. The system can be applied as a label or printed directly onto the package (Pavelková
2013).
The TT Sensor TTI is based on a diffusion–reaction concept. A polar compound diffuses between two polymer layers and the change of its concentration causes the color change of a fluorescent indicator from yellow to bright pink (Pavelková 2013).
Timestrips® TTI are smart labels that monitor how long a product has been open or how long it has been in use. Timestrips® TTI is activated by squeezing a start button which moves the liquid into direct contact with the membrane (Kuswandi et al. 2011).
Fresh-Check® and CheckPoint® as freshness indicators for fish and meatare based on pH change. Practically, these label prepared by entrapping within a polymer matrix a pH sensitive dye (e.g. bromocresol green) that responds, through visible color changes to the spoilage volatile compounds that contribute to a quantity known as total volatile basic nitrogen (Kuswandi et al. 2011).
10
growth indicator (freshness indicator, pH dye indicator for perishable food), pathogen indicator, and RFID (Ahvenainen 2003).
ripeSenseTM using a sensor label that reacts to the aromas released by fruit as it ripens. The sensor initially red and graduates to orange and finally yellow. This sensor has already applied for pears, and can also be applied as ripeness indicator for kiwifruit, melon, mango, avocado and other stone fruit etc (Kuswandi et al. 2011).
Modified atmosphere packaging (MAP), in these cases, the atmosphere of packaged is not air but consists of a lowered level of O2 and a heightened level of
CO2. The MAPs for non-respiring food typically has a high concentration of CO2
(20-80%) and a low concentration of O2 (0-2%). It has been claimed that the color
change of the O2 indicators used in MAPs containing acidic CO2 gas is not
definite enough (Kuswandi et al. 2011).
Biosensors such as conducting polymers can also be used by detecting the gases released during microbe metabolism. The biosensors are formed through inserting conducting nanoparticles into an insulting matrix, where the change in resistance correlates to the amount of gas released (Kuswandi et al. 2011).
RFID is a very crucial factor in modern supply chains where large amounts of raw material may be coming from different regions to be processed in one site, and then distributed to consumers. It is widely envisioned that RFID tags are expected to replace barcodes that are commonly used today (Kuswandi et al. 2011).
Previous Research
Research development about smart packaging is already conducted and applied on several products which susceptible of temperature and light. Hasnedi et al. (2010) detected spoilage of tilapia fillet using color indicator of smart packaging Bromothymol Blue with quality parameters including TVBN (Total Volatile Basic Nitrogen) value and TBC (Total Bacterial Counts) value. The developments of color indicator of smart packaging by using natural and synthetic dye have already done. Warsiki and Putri (2012) made smart packaging with red cherry dye and adhered on slice pineapple which packed using styrofoam with discoloration parameters including ∆E and Hue value and quality product change parameters including water content, C vitamin content, total acid, pH value, and weight decrease of product. Natural dye from bit fruit (Warsiki and Setiautami 2013) and ERPA leaves (Nofrida 2013) already used in the making of color indicator which applied on pasteurization milk by conducting the analysis of color changes including ∆E and Hue value, whereas product change parameters including preference of consumers and total colony.
11
Total acid at slice pineapple was higher so that the pH of the fruit was lower caused synthetic dyes on the smart label degraded so that the indicator color became faded (Putri 2012).
The color change of smart label was applied to the fillet of tilapia because of the volatile base component chemical which result of degradation process in tilapia fillet meat tends to increase during decomposition of fish (Hasnedi et al. 2010). Indicator color changed from yellow to dark yellow to bluish green.
But, researches of smart packaging are still limited in specifically analysis on color indicator which applied in certain product. The analysis in laboratory scale needs time consuming and expensive. Thus, it needs a model which able to detect and predict the packaged product condition.
3
METHODOLOGY
Research Framework
The research framework activities can be seen in Figure 3. The stages of research began by identifying the parameters which was used in the association analysis by collecting secondary data from previous research, then selected the important attributes parameters and analyzed the association to see the pattern of the relationship between color changes and quality changes. The research framework was illustrated in the following figure.
This research was conducted at the Laboratory of Computer on Department of Agro-industrial Technology. This research began in July 2014 to January 2015.
12
Figure 3 Research Framework
Identification of Association Parameter
The association parameters used in this research were identified from literature study and secondary data of Nofrida (2013) which included the color change parameters, product quality change parameters, color changes of label, as well as time and temperature storage of the product. The parameters which were used in this research adapted to the requirements of association analysis.
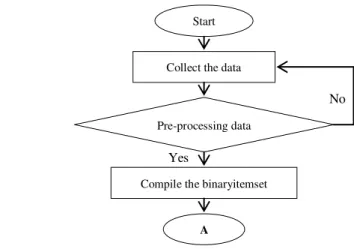
Furthermore, the parameters were pre-processed for problems, such as the various types of data and indifferent dimensions. One of the pre-processing methods is by discretization in a certain range. After all, the data was compiled and converted into the discretization data form of binary table. The flow diagram was shown in Figure 4.
Figure 4 Flow diagram of identification association parameter
Start Collect the data Pre-processing data Compile the binaryitemset
A
Yes
No
Start
Evaluate the model
Finish Identify the association
parameters Select the important
parameter
Develop the association model
Association Rules Ranking of influential
13
Attribute Selection Analysis
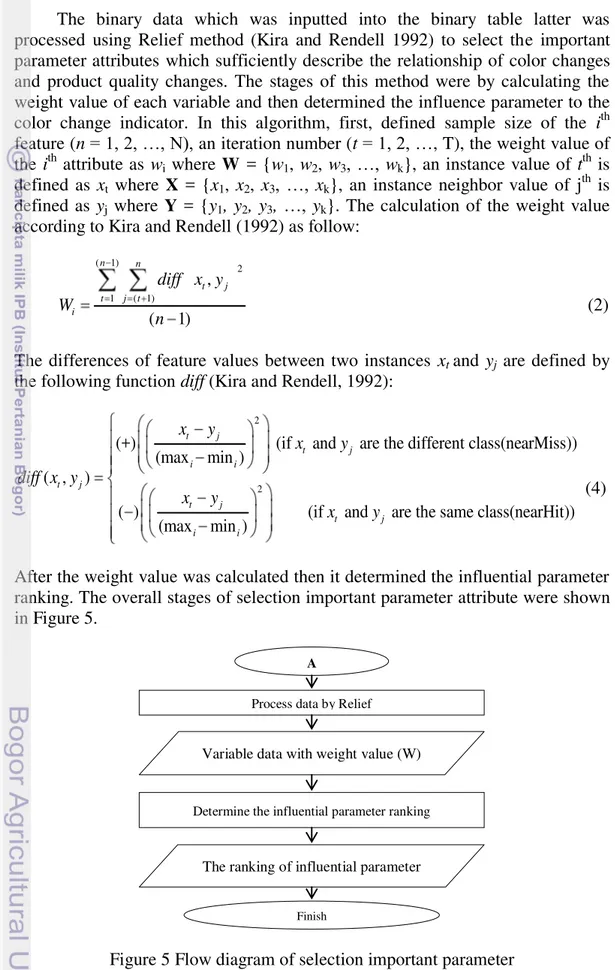
The binary data which was inputted into the binary table latter was processed using Relief method (Kira and Rendell 1992) to select the important parameter attributes which sufficiently describe the relationship of color changes and product quality changes. The stages of this method were by calculating the weight value of each variable and then determined the influence parameter to the color change indicator. In this algorithm, first, defined sample size of the ith feature (n = 1, 2, …, N), an iteration number (t = 1, 2, …, T), the weight value of the ith attribute as wi where W = {w1, w2, w3, …, wk}, an instance value of tth is
defined as xt where X = {x1, x2, x3, …, xk}, an instance neighbor value of jth is
defined as yj where Y = {y1, y2, y3, …, yk}. The calculation of the weight value
according to Kira and Rendell (1992) as follow: ( 1)
the following function diff (Kira and Rendell, 1992): 2
After the weight value was calculated then it determined the influential parameter ranking. The overall stages of selection important parameter attribute were shown in Figure 5.
Figure 5 Flow diagram of selection important parameter
14
Association Analysis of Discoloration
The association analysis is an analysis method to obtain the pattern of the relationship between color changes and quality changes. Association analysis is done in 2 stages, i.e. it conducts calculations to find the frequent sets and measures the bond value from item combinations, after that it determines association rules from the frequent itemsets.
The stage in analyzing the frequency pattern is carried out by inputting the data obtained in a table and calculates the attribute in binary table. Then, it determines the rules by combining the itemsets to combination 2-itemsets, 3-itemsets, etc.
A‟priori algorithm formed the candidate itemset, then it generated be large itemset. The formation of large itemset was conducted by searching all item combinations that had support value greater than minimum support (Agrawal and Srikant, 1994). Although there would be many rules obtained, typically more than 80% rules would be discarded or eliminated due to they did not meet the minimum support and minimum confidence (Prasetyo, 2012).
Agrawal et al. (1993) first developed a framework to measure the association relationship among a set of items. The association rule mining can be defined formally as follows. I = {i1, i2, i3… im} is a set of items. For instance,
discolorations parameters such as Hue and ∆E are items. D = {t1, t2, t3 … tn} is a
set of testing, called a testing database, where each data t has an identifier tid and a set of items t-itemset, i.e.,t =(tid, t-iteset). X is an itemset if it is a subset of I. For example, a set of items for experiment result in laboratory is an itemset. Over all association rule stages were shown in Figure 6.
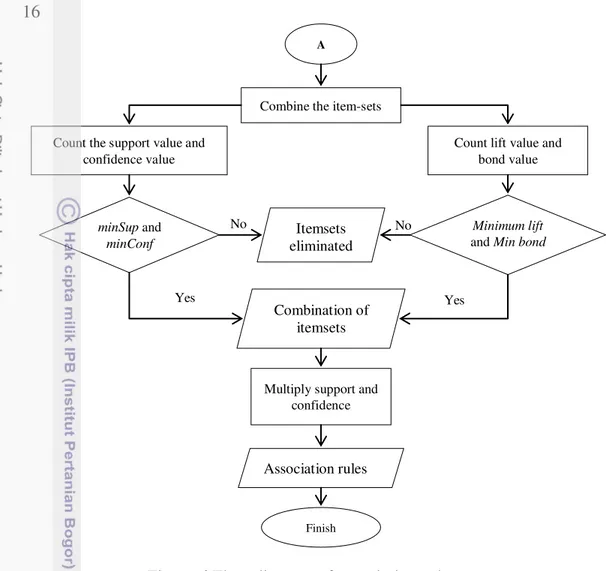
Association rules stages: a. Estimation of support value
Support value is a measurement which indicates how likely a combination of items A and B of the whole database. A combination itemset in a testing database D is called frequent if its support is equal to, or greater than, the threshold minimal support (minSup) given by users (Yin et al. 2011).
15
Where; is the number of combinations A and B, and Conjunctive (A) is number of combination containing A. A and B are the itemsets of quality product and color indicator, i.e., A,B ⊆ I. Where = {t in D|t contains X}. c. Estimation of lift value
Improvement (Lift) value asserts the possibility of two items which appear simultaneously. The improvement value > 1 (Geng and Hamilton, 2006).
( , )
Where; A and B are the itemsets of quality product and color indicator, i.e., A,B ⊆ I. Where = {t in D|t contains X}.
d. Estimation of bond value
Bond value states the comparison between conjunctive (number of combinations frequency of items A and B) and disjunctive (number of frequency of items A or B which appears) (Younes et al. 2010).
( ) be eliminated to obtain the threshold. After that, it determined top ten association rules (Top-10 Ranking) based on the largest value of the calculation hereunder (Sari 2013):
(9) The final step was formulated the association rules into mathematical models.
16
Figure 6 Flow diagram of association rule stage
Model Evaluation
After the association rules obtained, then it directly tested whether the rules were productive. According to Zaki and Meira (2013), to check whether a rule was known as the Fisher Exact Test, the formulation was shown in Equation 10.
min( , ) number of combinations that contain and but not , and finally denotes the number of combinations that contain but neither nor .
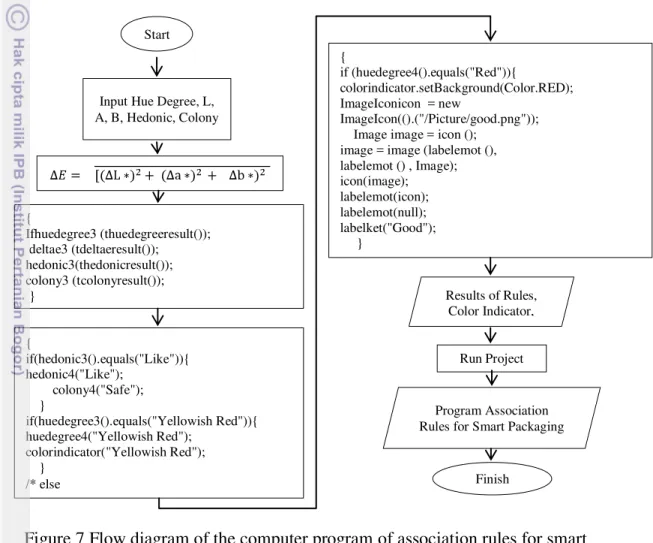
17 The evaluation of association model was verified by using program simulation with java programming. The verification is a phase to find out whether the program obtained in term research meet the overall expectation output. Verification was conducted during the program was generated until the re verify further it after when the program complete it. The model implementation used the rules which have generated before. NetBeans IDE 8.0.2 is used to compute the association rules for smart packaging. The flow diagram of the computer program was shown in Figure 7.
Figure 7 Flow diagram of the computer program of association rules for smart packaging
4
RESULT AND DISCUSSION
Identification of Parameter
Smart packaging senses and informs the condition of the product, thus the term could be used in a broad sense including features concerning product identity, authenticity and traceability, tamper evidence and theft protection as well as safety and quality issues (Kuswandi et al. 2011).
While, a good example of smart packaging is time-temperature indicator (TTI) that showed irreversible change in a physical characteristic, usually color or
Start
Input Hue Degree, L, A, B, Hedonic, Colony
{
18
shape, in response to temperature history. Some are designed to monitor the evolution of gases and temperature change along the distribution chain. In order to be used as food quality and safety monitoring devices, the rate of change in the device correlated well with the rate of deterioration of the food product (Kuswandi et al. 2011). Therefore, in this research generated relationship between the changing color of smart label and product quality changes by using association rules mining.
At initial stage, data were obtained from a previous research which was conducted by Nofrida (2013), in the form of data °Hue, the value of L*, a* and b*, preference (hedonic) value and total colony of dairy products with labels of ERPA (Aerva sanguinolenta) leaves at 3 ± 2° C temperature stored for 12 days. The temperature was the best treatment of the four types of treatment (freezer temperature, refrigerator temperature, room temperature, and outside temperature with overexposure / 40º C). It observed °Hue, the value of L*; a*; b*, the value of preferences panelists to the products and total colony products since early in storage. The value of L*; a*; b* was calculated by equation (1) to obtain the value of ΔE which could quantify the color. These data were secondary data in this research. The research database was shown in Appendix 1.
Table 1 showed the discretization data to classify the data °Hue, ΔE, consumer preferences and the total colony to categorical value. This was to facilitate the researcher to associate each item sets. Then, the discretization data entered into the binary table (Appendix 2) and used binary number. It wrote a digit "1" if there was data on the item-sets and wrote a digit "0" if there was no data and calculated the support value of each item set.
After that, the data in binary table were selected the important parameter attributes by using Relief method and then developed a relationship model between color changes and quality changes of dairy products by using ARM.
Selection of Attributes
The analysis results by using the Relief method showed that there were four combinations of the variables with the highest weight value (Wi). The weight
value was calculated by equation (3) and (4). These weight values (W) were
19 Variable-x (parameter value) consisted of the °Hue value (x1), ΔE (x2), preference value (x3), and total colony (x4). While, the variable-y was as color change indicator of smart packaging consisting of red (y1), yellowish red (y2) and yellow (y3).
In Table 2 the highest weight value that affected y1 was x2d of 0.262. After
that, the variables-y were sorted by maximum weight to determine the factors that influence the color change indicator of smart packaging and be the deciding factor. This could be seen in Table 3.
Table 3 showed that the parameters that influenced the color change indicator were hedonic, ΔE value, and ° Hue. There were two different parameters in hedonic quality, but produced the same color change. Nofrida (2013) asserted the results of organoleptic test were in line with the color change indicator of smart packaging. When consumers did not like it, at the same time the color of the smart label turned to yellow. Therefore the relationship "consumers liked" and the indicator color "yellow" was an invalid relationship with real conditions. The chosen parameters were presented in Table 4.
By using the Relief method, it could be chosen parameter attributes that were important of the existing parameters. These results were the important parameters which sufficiently describe the relationship of color change smart label and product quality changes.
Association Rules Model
Association rules is one of data mining techniques which a generic term that covers research results, techniques and tools used to extract useful information from large database (Niu and Chen, 2013). The association rules particularly are useful to discover relationships among data in huge database and applicate to many different domains including this research. The stages to form the association rules by determining the support value of each item set which met the minimum support. It was combined item (X) with item (Y) as illustrated in Figure 8. In Figure 8, item ° Hue "red" was in combination with ΔE "low", Preference value "like", the total colony "safe", and the color of the indicator "yellowish red" and
Table 3 The quality parameters that affect the color change indicator
Quality Parameters Color Indicator Visualization Weight
Consumers liked Yellow 0.423
Consumers dislike Yellow 0.423
Low ∆E Red 0.262
Red °Hue Yellowish Red -0.0103
Table 4 The causal relationship color changes with product quality changes
Quality Parameters Color Indicator Visualization
Consumers dislike Yellow
Low E Red
20
so on. First, it combined the 2-itemsets and obtained 67 rules of 13 item-sets in binary table. The item-sets combination put into binary data and calculated the support value (equation 5).
If the support value was ≤ 20%, then the combination would be eliminated. There were 67 combinations between quality parameters of product which‟s adhered smart label and discoloration of smart label and some of them eliminated to 29 combinations (Appendix 3). In addition, the combinations calculated the confidence values (equation 6) and set the minimum confidence. The objective of determining the minimum support and minimum confidence is to eliminate unnecessary rules. According to Niu and Chen (2013), the generated association rules is to discover all the association rules that have been support greater than, or equal to, a minimum support (minSup) threshold and confidence greater than, or equal to, a minimum confidence (minConf) threshold. The rules provided many possible patterns which appeared in the database. The rules were interpreted just the rules which have a lift value > 1, neither all rules were interpreted. Lift value obtained from equation (7) which indicated the strength level of the rules on random events of the antecedent and consequent based on each of support values. The next stage, it calculated conjunctive and disjunctive values from each combination. The conjunctive and disjunctive values are to calculate the bond value (equation 8). Conjunctive value is the probability value of A and B appeared at the same time, and the disjunctive value is the probability value of A or B appeared in each combination.
After that, the twenty nine combinations continued with a combination of 3-itemsets. In 3 itemsets combination, there were 30 rules are formed and all the rules met the threshold (Appendix 4). The formed rules were combined into 4-itemsets combination and obtained as much as 15 rules and all met the threshold minSup and minConf (Appendix 5). Thus, the fifteen rules generated 3 rules of 5 itemsets combination which met the threshold (Table 5).
Item (X) Combine 2 items
21
The results were to obtain the relationship between the color changes of smart label and the quality change of dairy products. The research obtained 3 rules (5 combinations of parameters) with lift > 1 and confidence ≥ 80%. In Table 5, one of the formed rules was "{°Hue = red, ΔE = low, hedonic = like, colony = safe } → { color indicator = red} with the support of 30.7% (the occurance is 30.7% of the whole experiment), confidence 100% (It was 100% probability of the indicator color was red if the °Hue is red, low ΔE value, consumers like, and safe from contamination), bond 40% (there was a 40% joint frequency of the relationship), and lift > 1% indicated the color change and quality changes which correlated positively (the rules can be used). The interpretation of the rule is "If quality changes with the °Hue value red, low ΔE value, consumers like the product and the product is safe from contamination then color indicator of smart packaging is red ". These rules could be used as a basis to assign a color change of smart label with product quality changes parameter because they had strong relationships. Rules that satisfied both minimum support threshold (minSup) and minimum confidence threshold (minConf) were called strong (Raorane et al. 2012).
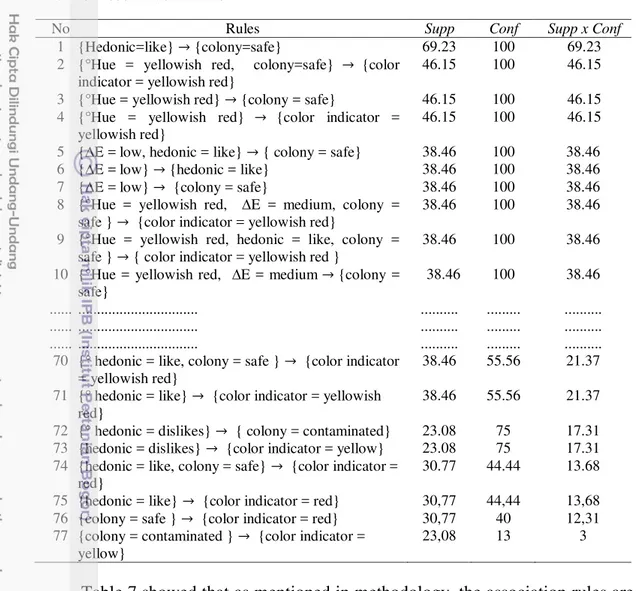
There were seventy seven rules which met the threshold and had relationships between antecedent and consequent part and the rules implied in smart label (Table 6).
Association rules were established by multiplying the support value and confidence value (equation 9) to select the top-10 association rules with the highest value. Top-10 association rules were selected to appear majority results from whole data and the rules were frequency appearance in research data. The whole association rules were shown in Appendix 6.
Table 5 The combination of 5-itemsets
No The combination rules of 5 itemsets Support Conf Lift Conj Disjunc Bond 1 { Hue= red, ∆E= low, hedonic= like,
colony= safe} {color indicator= red}
30,76 100 0,032 4 10 40
2 { Hue= yellow red, ∆E= medium, hedonic= like, colony= safe} {color indicator= yellowish red}
30,76 100 0,021 4 10 40
3 { Hue= yellow, ∆E= high, hedonic= dislike, colony= contaminant} {color indicator= yellow}
22
Table 7 showed that as mentioned in methodology, the association rules are interpreted as follow.
Table 7 The matrix of Top-10 Ranking Association Rules
23 As an example of the rules which interpreted in the matrix of top-10 association rules, i.e. the eighth rule showed: °Hue.Yellowish red, ∆E.Medium, Total Colony.Safe→ Color indicator.Yellowish red, it meant if °Hue was yellowish red in chromatograph, ∆E value is medium and the product saves from contamination of colony then the color changes of smart label would be yellowish red. When the product adhered smart label and in chromatograph showed the color changed into yellowish red, so based on the eighth rule, this product must be eaten as soon as possible. The obtained rules could see the association between the changing color indicator of smart packaging and product quality that had strong rules and had frequency appearance in research data.
Eventually it was reasonable to state that the association rules could facilitate the consumers and researchers to get information about the quality product which was adhered smart label. Thus, by observing the rules, the consumers could know quality status of product whether it is still good, must be eaten soon or it is have already bad. The researchers do not need to conduct experiment repeatedly in laboratory if they have used the association rules. So, it could minimize the cost and time. This research obtained the rules by using smart label which applied limited to pasteurized milk products so it need further research for generalized application.
TTI could play a critical role in indicating the freshness and safety of a food product, for instance in this research used pasteurized milk which adhered smart label using ERPA leaf dye. This became extremely important when food was stored in less than optimal conditions such as extreme heat or freezing. In this case, milk sensitive to high temperature and the duration of exposure.
Smart label or TTI which was using natural dye was instability and weakness of color effort. In this case using ERPA leaf that contained anthocyanin. Anthocyanin is not stable in high temperature; it results in damage and discoloration smart label quickly through the hydrolysis process of glycoside anthocyanin and produces open aglycone ring so formed group‟s carbinol and kalkon which is colorless.
The quality of pasteurized milk changed during storage. The quality changes can be seen from the increasing number of colonies on pasteurized milk. The maximum limit of microbial contamination in milk is 5x10⁴ colonies / mL (Nofrida 2013). This change is affected by the increasing storage temperature during distribution from processor to the retailer and until the point of retail sale.