CRANFIELD UNIVERSITY
SCHOOL OF ENGINEERING
Energy System And Thermal Processes
MSc
Academic Year 2013 - 2014
MOHD FARID ISMAIL
Simulation Analysis of Energy Saving Potentials from Residential
HVAC Systems in Hot Country Buildings
Supervisor: Dr. Karl Jenkins
August 2014
This thesis is submitted in partial fulfilment of the requirements for
the degree of Master of Science Energy System and Thermal
Processes
©Cranfield University 2014. All rights reserved. No part of this
publication may be reproduced without the written permission of the
Abstract
Natural ventilation becomes a more popular method to implement in modern buildings nowadays because of its potential to reduce energy consumption and carbon footprint. However, thermal comfort conditions should not be sacrificed in order to achieve energy saving objectives. This research aims to study the potentials of implementing natural ventilation in Malaysia's modern residential building to reduce energy consumption from air conditioning systems. Computational Fluid Dynamics methods were used to simulate air ventilation behaviour in a master bedroom from double storey cluster house in Melaka, Malaysia. The method was validated with a similar research done in China published recently. Three methods were proposed to find the best ventilation performance in terms of air temperature and wind speed. The 2°C increment of air-conditioning setting temperature and increasing air speed from 0.501
mis to
1.25mis
at wall air-conditioning unit shows the best performance among three methods proposed to achieve thermal comfort condition. None of the proposed methods achieves 80% of ADPI satisfaction percentage as recommended in the ASHRAE 55 standard but three of four simulation runs in this research improved the thermal comfort level compared to control condition.Keywords:
Thermal comfort, CFO, Tropical climate, Energy efficiency, Cross ventilation, Wind induced, Stack ventilation
Acknowledgements
In the name of Allah, the Most Merciful, the Most Compassionate
AlhamdulillahiRabbil'alamin, praises be to Allah SWT, the exclusive Owner of the utmost Glory. It is my pleasure to express my gratefulness for each and every one of His mercies to accomplish this project. It gives me great pleasure to record my gratitude to every individual who had assisted and motivated me to struggle to complete this study. Special thanks to my supervisor Dr. Karl Jenkins and my course coordinator Dr. llai Sher. On my personal note my heartiest thanks to all my dearest family members -- my wife Fatimah and our beloved children Muhammad Al Fateh and Farihah Mardhiyyah. I would like to mention my thousand appreciations to my family members and in-laws for their prayers and support.
Not to forget my acknowledge to Universiti Teknikal Malaysia Melaka, Ministry of Education and Government of Malaysia for giving me an opportunity to study here and support my technical and financial needs.
Finally, I wish to thank all brothers from Cranfield Islamic Society especially to Brother Abdullah, Abdel Aziz and Hammad for all the assistance offered to me in order to complete this research.
May Allah grant every good deed you have showered me in the form of countless rewards and may peace and the blessings of Allah be upon all of you.
Contents
Abstract ... iii
Acknowledgements ... iv
List of Figures ... vii
List of Tables ... x
List of Equations ... x
Abbreviations ... xi
Nomenclature ... xii
1 INTRODUCTION ... 1
1 .1 Background and Motivation ... 1
1 .2 Problem Statement ... 1
1 .3 Aim and Objectives ... 1
1.4 Scope ... 2
1.5 Thesis Structure ... 2
2 LITERATURE REVIEW ... 3
2.1 Ventilation System ... 3
2.2 Thermal Comfort ... 4
2.2.1 Natural Ventilation and Thermal Comfort ... 4
2.2.2 Energy Efficiency and Thermal Comfort ... 8
2.3 CFO Numerical Simulation ... 10
3 CFO METHODOLOGY VALIDATION ... 12
3.1 Overview ... 12
3.2 CAD Model and Simulation from Literature ... 12
3.3 Reconstruction 30 CAD Model and Mesh Generations ... 13
3.4 Simulation Time ... 14
3.5 Results Validation ... 14
4 CONTROLLED CONDITION ... 18
4.1 Model Geometry ... 18
4.2 Environment and Weather ... 20
4.3 Mesh Generations ... 22
4.4 Simulation Settings ... 22
4.5 Simulation Time ... 25
4.6 Simulation Results ... 25
4.6.1 Velocity Vector ... 25
4.6.2 Temperature Contour ... 25
4. 7 Recap ... 28
5 RESULTS AND DISCUSSIONS ... 28
5.1 Pre Discussion ... 28
5.2 Mesh Generations ... 29
5.3 Simulation Time ... 29
5.4 Method 1 ... 30
5.4.1 CFO Simulation Settings ... 31
5.4.2 Simulation Results ... 31
5.5 Method 2 ... 33
5.5.1 CFO Simulation Settings ... 33
5.5.2 Simulation Results ... 35
5.6 Method 3 ... 36
5.6.1 CFO Simulation Settings ... 37
5.6.2 Simulation Results ... 37
5.7 Discussions ... 39
5.7.1 Air Velocity ... 40
5.7.2 Air Temperature ... 40
5.7.3 Effective Draft Temperature ... 42
5.7.4 Thermal Stratification ... 43
5.7.5 Air Diffusion Performance Index ... 44
6 CONCLUSIONS AND RECOMMENDATIONS ... 46
6.1 CONCLUSIONS ... 46
6.2 RECOMMENDATIONS ... 46
REFERENCES ... 47
APPENDICES ... 52
Appendix A Validation Pictures ... 52
Appendix B Boundary Conditions Value Determination ... 53
Appendix C Selected Cross-sections ... 55
Appendix D Additional Figure for Simulation Results ... 56
Appendix E Temperature and Velocity profile ... 62
Appendix F Effective Draft Temperature ... 65
List of Figures
Figure 2.1 Recommended thermal comfort zone for air speed below 0.2 m/s
and humidity less than 80% (ASHRAE, 2013a) ... 5
Figure 3.1 :Geometry comparison between current research and the literature 16 Figure 3.2: Comparison of air temperature distributions at three selected planes between Yang et. al.,2014 and this current research ... 17
Figure 4.1 Actual figure of a double-storey cluster house ... 18
Figure 4.2 Top and side view of the controlled condition room ... 19
Figure 4.3 Daily Maximum and minimum temperature in 2013 ... 21
Figure 4.5 Average hourly temperature for Melaka, Malaysia in 2013 ... 22
Figure 4.5 Velocity vector at Z=1.5 m ... 26
Figure 4.6 Temperature contour at Z=1.5 m ... 26
Figure 4.7 Temperature contour at Z=0.5 m ... 27
Figure 4.8 Temperature contour at Z=2.9 m ... 27
Figure 5.1 Velocity vector at Z=1.5 m ... 31
Figure 5.2 Comparison of temperature contour at Z=1.5 m for controlled condition (top) and Method 1 (bottom) ... 32
Figure 5.3 Monthly wind speed data (m/s) for Melaka (WindFinder.com, 2014; Weather2 Ltd, 2014; Diebel and Norda, 2014; Islam et al., 2012) ... 34
Figure 5.4 Wind direction data from three different sources ... : ... 34
Figure 5.5 Velocity vector at Y=1.7 m ... 35
Figure 5.6 Temperature contour at Y=0.6 m ... 36
Figure 5. 7 Velocity vector from top view for Y=0.1 m ... 37
Figure 5.8 Velocity vector from front view for Z=1.5 m ... 38
Figure 5.9 Temperature contour at Y=0.6 m ... 38
Figure 5.10 Plan view (XZ plane) of 15 selected points location at three different heights Y=0.1 m, Y=1.1 and Y=1. 7 m ... 39
Figure 5.11 Comparison of air velocity for three different method at Y=0.1 m .. 41
Figure 5.12 Comparison of air temperature for three different method at Y=0.1 m ... 42
Figure 5.13 Distribution of Effective Draft Temperature for different method at Y=0.1m ... 43
Figure 5.14 Vertical air temperature difference at the height of standing man, 0 .1
m -
1 . 7m ... 44
Figure 5.15 Vertical air temperature difference at the height of standing man, 0 .1 m - 1 .1 m ... 44
Figure 5.16 comparison of ADPI for every method proposed ... 45
Figure A-1: Wind velocity distribution (m/s) at z=0.5m ... 52
Figure A-2: Wind velocity distribution (m/s) at z=1.5m ... 52
Figure A-3: Wind velocity distribution (m/s) at z=2.5m ... 52
Figure 8- 1 Extraction of figure from An sys Fluent Help file ... 53
Figure C-1 Plan view of the room and selected cross section for results examination ... 55
Figure C-2 Front view of the room and selected cross section for results examination ... 55
Figure D-1 Velocity vector at Z=0.5 m ... 56
Figure D-2 Velocity vector at Z=2.9 m ... 56
Figure D-3 Comparison of temperature contour at Z=0.5 m for controlled condition (top) and Method 1 (bottom) ... セ@ ... 57
Figure D-4 Comparison of temperature contour at Z=2.9 m for controlled condition (top) and Method 1 (bottom) ... 57
Figure D-5 Temperature Contour for Y=0.2 m ... 58
Figure D-6 Temperature Contour for Y=0.6 m ... 58
Figure D- 7 Velocity vector at Y=1.1 m ... 58
Figure D- 8 Temperature contour at Y=0.2 m ... 59
Figure D- 9 Temperature contour at Y=0.6 m ... 59
Figure 5.11 Comparison of air velocity for three different method at Y=0.1 m .. 41
Figure 5.12 Comparison of air temperature for three different method at Y=0.1 m ... 42
Figure 5.13 Distribution of Effective Draft Temperature for different method at Y=0.1m ... 43
Figure 5.14 Vertical air temperature difference at the height of standing man, 0 .1 m - 1 . 7 m ... 44
Figure 5.15 Vertical air temperature difference at the height of standing man, 0.1 m - 1.1 m ... 44
Figure 5.16 comparison of ADPI for every method proposed ... 45
Figure A-1: Wind velocity distribution (m/s) at z=0.5m ... 52
Figure A-2: Wind velocity distribution (m/s) at z=1.5m ... 52
Figure A-3: Wind velocity distribution (m/s) at z=2.5m ... 52
Figure B- 1 Extraction of figure from Ansys Fluent Help file ... 53
Figure C-1 Plan view of the room and selected cross section for results examination ... 55
Figure C-2 Front view of the room and selected cross section for results examination ... 55
Figure D-1 Velocity vector at Z=0.5 m ... 56
Figure D-2 Velocity vector at Z=2.9 m ... 56
Figure D-3 Comparison of temperature contour at Z=0.5 m for controlled condition (top) and Method 1 (bottom) ... セ@ ... 57
Figure D-4 Comparison of temperature contour at Z=2.9 m for controlled condition (top) and Method 1 (bottom) ... 57
Figure D-5 Temperature Contour for Y=0.2 m ... 58
Figure D-6 Temperature Contour for Y=0.6 m ... 58
Figure D- 7 Velocity vector at Y=1.1 m ... 58
Figure D- 8 Temperature contour at Y=0.2 m ... 59
Figure D- 9 Temperature contour at Y=0.6 m ... 59
Figure D- 10 Temperature contour at Y=1.1 m ... 59
Figure D- 11 Velocity vector from top view for Y=0.6 m ... 60
Figure D- 12 Velocity vector from top view for Y=1.1 m ... 60
Figure D- 13 Velocity vector from top view for Y=1. 7 m ... 60
Figure D- 14 Temperature Contour for Y=0.2 m ... 61
Figure D- 15 Temperature Contour for Y=1.1 m ... 61
Figure D-16 Temperature ContourforY=1.7 m ... 61
Figure E-1 Comparison of air temperature for three different method at Y=0.6 m ... 64
Figure E-1 Comparison of air temperature for three different method at Y=1.1 m ... 64
Figure E-1 Comparison of air temperature for three different method at Y=1.7 m ... 64
Figure F-1 Distribution of Effective Draft Temperature for three different method at Y=0.6 m ... 65
Figure F- 2 Distribution of Effective Draft Temperature for three different method at Y=1 .1 m ... 65
Figure F- 3 Distribution of Effective Draft Temperature for three different method at Y=1 . 7 m ... 65
List of Tables
Table 2.1 Ventilation rates required to limit C02 concentration for differing
activity levels (Barnard and Jaunzens, 2001) ... 3
Table 2.2: Neutral temperature obtained from previous and recent thermal comfort studies in countries with hot-humid climate (Kwong et al., 2014) ... 7
Table 3.1: Boundary conditions set in Yang et. al. ,2014 ... 15
Table 4.1 Dimensions and heat information for all objects in the room ... 20
Table 4.2 Mean monthly temperature data for 2013 ... 21
Table 4.3 Boundary setting for controlled conditions for the room ... 23
Table 4.4 Selected cross-sections for thermal comfort assessment.. ... 24
Table B- 1 Inlet velocity determination data ... 54
Table E-1 Temperature and velocity information from nine different points in two cross section plane ... 62
List of Equations
Equation 5-1 Effective Draft Temperature (Lin, 2011) ... 42Abbreviations
30
AC
ACH
ADPI
ASH RAE
BSRIA
CAD
CFD
CFM
CIBSE
EAS
EE&C
EDT
ET*
HVAC
ISO
PDW
PET
PMV
PPD
RE
RNG
TV
Three-dimensional
Air-conditioning
Air change per hour
Air Diffusion Performance Index
American Society of Heating, Refrigerating and Air-Conditioning Engineers
Building Services Research and Information Association
Computer Aided Design
Computational Fluid Dynamics
Cubic feet per minutes
Chartered Institution of Building Services Engineers London
Elevated Air Speed
Energy Efficiency & Conservation
Effective Draft Temperature
Effective Temperature
Heating, Ventilation and Air-conditioning
International Organization for Standardization
Part Design Workbench
Physiologically Equivalent Temperature
Predicted Mean Vote
Predicted Percentage of Dissatisfied
Renewable Energy
Re-Normalisation Group
Television
Nomenclature
P10.1 -P150.1
P1o.6 -P15o.6
P111 -P1511
P11.1-P15u
The GRID
Effective draft temperature for mixing ventilation, K;
Carbon dioxide
Average room dry-bulb temperature, °C;
Local airstream dry-bulb temperature, °C Point 1 to Point 9 at Y=0.1 m
Point 1 to Point 9 at Y=0.6 m
Point 1 to Point 9 at Y=1.1 m
Point 1 to Point 9 at Y=1. 7 m
A small Linux cluster intended for running a large number of single processor applications
Local airstream centreline speed, mis.
1 INTRODUCTION
1.1 Background and Motivation
Heating, Ventilation and Air-conditioning (HVAC) system is a system that today's people depend on to achieve thermal comfort condition. The needs for cooling by ventilation and mechanical air-conditioning (AC) become more important in hot climate countries compared to that for heating system. By increasing the cooling demand will directly increase the energy demand particularly in electrical energy. We noticed that the costs of electrical energy production increase significantly from time to time because this energy generates mainly from fossil fuel. This situation initiates the awareness to reduce energy consumption in order to reduce cost to buy energy and environmental impact as well.
1.2 Problem Statement
Amidst the increasing fuel price, people become more worried of the cost incurred to buy electric energy from grid. An alternative way to reduce energy cost is to reduce energy consumption from daily usage. In hot climate countries, HVAC system contributes a larger portion of electrical energy cost compared to other appliances. Current mechanical air-conditioning systems used in many buildings nowadays are seen like the most practical and cost effective way to provide cool air for the occupants. However, the energy consumed by this system may be reduce to some possible percentage by implementing natural ventilation systems to the building. This project studies about the potentials of energy saving to current mechanical air-conditioning system by implementing natural ventilation device to the system.
1.3
Aim and Objectives
The aim of this project is to develop a Computational Fluid Dynamics (CFO) simulation analysis to determine the potentials of reducing energy consumption by changing HVAC system for a typical residential room in Malaysia. In order to achieve the above aim, a few objectives have been created:
1 . Develop and verify CFO model with previous works
2. Model and meshing a room with in Three-dimensional (30) Computer Aided Design (CAD) software
3. Create air flow simulation for room with natural ventilation systems
4. Analyse thermal comfort criteria for each simulation data for justification of energy reduction potentials
1.4 Scope
There are quite big areas of study available for this kind of research. Therefore, some limitations were set for this research in order to complete the research according to the given time frame. This research project only covers:
1. Development of one CFO simulation analysis using Ansys Fluent platform.
2. Modelling and analysing thermal behaviour of a room with three proposed methods in a typical Malaysian residential building.
1.5 Thesis Structure
This thesis covers five main chapters that discuss the CFO simulation study on energy saving potential in a residential building. The introduction, aims, objectives and scope of research have already been discussed in this chapter. In the next chapter, previous studies related to this topic are discussed. A Few important topics selected to be written in this chapter include ventilation system, thermal comfort, energy efficiency and numerical simulation. The preview on previous study is very important to know the relevance of this study in order to contribute to advancement of knowledge.
In chapter three, the methodology of research is discussed. As we realized that CFO is just a computer numerical simulation that employs many assumptions in its calculation, verification of CFO results is very important. The verification method of the result will discuss is discussed in detail in this chapter to ensure the reliability of the simulation results.
The simulation of controlled condition is presented in chapter four. The simulation was run using a normal bedroom condition in hot climate country with the present of air-conditioning unit. Indoor furniture, heat sources and outdoor environments were employed in this simulation to construct the best computer model as close to the actual condition.
In chapter five, simulation results for all proposed methods are discussed. The simulation for three methods and two different values of initial air velocity used in Method 2 are discussed in detail. Several thermal comfort criteria regularly used to evaluate simulation data are presented as post-process result.
The last chapter contains the conclusions and suggestions for further study as well as the references used in conducting this research.
2 LITERATURE REVIEW
2.1 Ventilation System
In the design stage of a building, one of the important aspect that should be incurred is the ventilation. Ventilation system which that is normally referred to as artificial ventilation, is a system where fans are being installed in a building to inhale ambient air from outside and replace the air inside the building. This system is normally employed when the designer realizes that the natural ventilation of the building is just not enough to supply fresh air for all occupants. Some rooms have special requirements to control humidity or avoid from any dust that drove the need to install ventilation system (Osbourn, 2002). The requirement for fresh air supply vary according to the size of building, number of occupants and occupants' activities in a building. For a normal person at rest,
0.2 liters. s-1 of fresh air is enough for him or her to stay alive. Meanwhile to
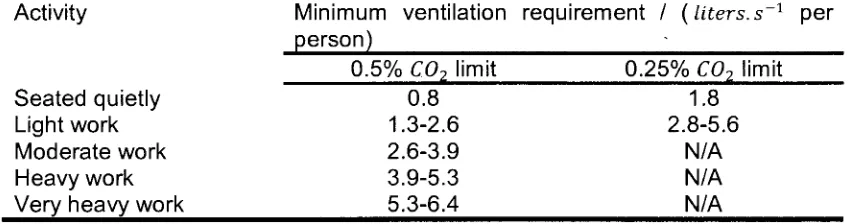
achieve a comfort condition, the amount of fresh air must be much greater than that (Jones, 2001 ). Chartered Institution of Building Services Engineers London (CIBSE) in its guide divided fresh air requirement to five levels of activities that include seated quietly, light work, moderate work, heavy work and very heavy work. -see Table 2.1.
Another reason for ventilation is the odours presents that should be diluted in the air to maintain social acceptable level. Ventilation also helps to remove moisture, heat and contaminated air to provide satisfactory condition in a room for all occupants (Faber and Kell, 1989).
Table 2.1 Ventilation rates required to limit C02 concentration for differing activity levels (Barnard and Jaunzens, 2001)
Activity
Seated quietly Light work Moderate work Heavy work Very heavy work
Minimum ventilation person)
0.5% C02 limit 0.8 1.3-2.6 2.6-3.9 3.9-5.3 5.3-6.4
3
requirement I (liters. s-1 per
0.25% C02 limit 1.8 2.8-5.6
[image:15.595.62.487.550.662.2]Ventilation is very important to achieve comfortable condition because of a few reasons. First, fresh air provides oxygen to occupants for respiration. Fresh air containing oxygen is needed by human and other living things to breathe and to perform the respiration process. Without enough oxygen in a room, people feel breathless and the lack of oxygen may lead to death.
2.2 Thermal Comfort
Thermal comfort normally relates to the satisfaction of occupants in a room or building to the thermal condition. People also relate thermal comfort with human health especially in the performance for an activity. Even though many physical experiments were done in the past to relate thermal comfort with these two reasons, there has been no strong enough evidence to justify the relationship (Fanger, 1972). Referring to a study back in 2010, 87% of human time was spent in building and another 6% in enclosed vehicle in the case of majority of people (Lien and Ahmed, 2011 ). Another researcher mentioned in his book that 90% of people's time nowadays is spent in artificial environments like dwelling, workplace and transport (Awbi, 1991 ). This figure acts as an indicator on how important it is for a building owner to provide comfort condition to their occupants.
To provide thermal comfort is not limit to provide suitable air temperature for people, but a building designer should consider the level of humidity, air velocity, air quality, acoustics, aesthetics, and the radiant temperature as well. In a more detail study, the rate of metabolism, people's activities, people's emotions, type of fabric used by occupants and the perceptions will take into account in terms of determining the comfort level of an area. Even though many theories have been made to find the relationship between those parameters to thermal comfort level, the main factor that determines the comfort temperature is the thermal perception by people themselves. In previous studies, researchers used Physiologically Equivalent Temperature (PET) index to determine thermal perception. However, thermal perception varies between area of studies and target groups. Besides, the thermal perception also is affected by thermal adaptation and psychological parameters especially for human thermal comfort level in outdoor spaces (Makaremi et al., 2012). Determination of thermal comfort also should comply with international standards. Another favourable method used in determining thermal comfort is Predicted Mean Vote (PMV) and Predicted Percentage of Dissatisfied (PPD) (International Organization for Standardization, ISO, 2005).
2.2.1 Natural Ventilation and Thermal Comfort
Thermal comfort temperature in many previous studies are commonly called as neutral temperature or comfort zone. According to American Society of Heating, Refrigerating and Air-Conditioning Engineers (ASHRAE) Standard 55-2013, the
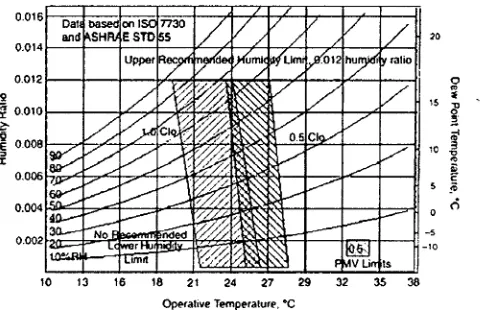
comfort zone is located at the temperatures between 19°C to 26°C for clothing insulation level at 1.0 clo and between 25°C to 28°C for 0.5 clo. This recommendation only limited to a building space with relative humidity level less than 80% and the air speed below than 0.2 m/s. -see Figure 2.1. For a building with stronger wind speed, Elevated Air Speed (EAS) method can be used to determine maximum allowable temperature at the specific air speed. The maximum air speed is allow up to 1.2 m/s and 0.8 m/s for a space with and without local ventilation control respectively. (ASHRAE, 2013a).
However, some research findings in Southeast Asia and other similar climate countries found that people in this region prefer a more slightly higher temperature to feel comfort compared to the recommended temperature by ASHRAE 55. Busch in its research in Thailand found that the neutral temperature for an office worker should be as high as 31°C in natural ventilated condition while for the office equipped with air-conditioning system, it should be 28°C (Busch, 1992).
In a similar study done in Bangladesh, researchers found the acceptable conditions for residence are between 24°C to 33°C and 95% is the acceptable humidity level (Mallick, 1996).
In Indonesia, a survey made to nearly 600 office-workers in Jakarta found that no artificial air-conditioning was required at their workplace as they already achieve thermal comfort level (Karyono, 2000). This study was contined by Feriadi and Wong in 2004 who made another survey to 525 residential building occupants. They found lower thermal perception felt by people in comparison to results from analysed data using PMV equation. They also found people in hot and humid tropical climate countries prefer higher wind speed to stay in comfort in natural ventilated buildings (Feriadi and Wong, 2004).
O.Q16
20
0.014
0.012 0
2 セ@
セ@ 0.010 lS セ@
セ@ 3
:0 0.008 セ@
E 10
" "'
J: "'
セ@
s i6
0 0
-s
-10
[image:17.595.156.396.519.674.2]10 13 16 18 21 24 27 29 32 35 38 ()pHalive Temperature, •c
Figure 2.1 Recommended thermal comfort zone for air speed below 0.2 m/s and humidity less than 80% (ASHRAE, 2013a)
Another hypothesis of a study found that 80% of thermal surveys to natural ventilated building comply with ASHRAE 55. Wong and his group conducted this study on public residence in Singapore. Based on comparative analysis of people votes and thermal sensation, they found many people still in comfort even the temperature sense shows 2°C or 3°C higher than recommended in ASHRAE Standard (Wong et al., 2002).
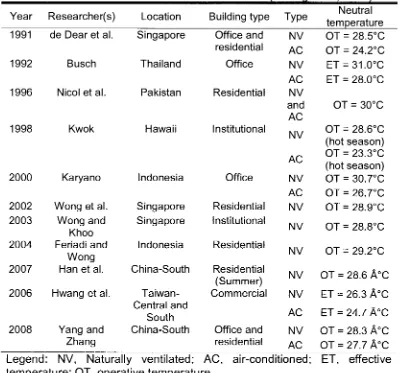
A more recent study about determining thermal comfort temperature conducted in Malaysia found 30°C of ambient temperature is just enough for people to feel comfort. This study concludes that thermal comfort level still can be achieved without additional air-conditioning system (Djamila et al., 2013). Some data of previous studies related to thermal comfort and determining neutral temperature are shown in Table 2.2. In this table, most of the studies found people who live in hot-humid climate prefer higher temperatures compared to the data determined by PMV to get comfort in their building. That means, for this type of climate countries, neutral temperatures should be put higher as suggested by Kwong and his group in their review (Kwong et al., 2014). -see Table 2.2.
Natural ventilation happens when the movement of the air was induced by wind or by the effect of temperature difference. Generally, natural ventilation can be divided into four possible combinations: natural inlet and outlet, temperature different effect, wind effect and natural inlet Mechanical extract. All these combinations are widely used in the market especially in cold weather countries. Some of the researches discussed previously had shown the relationship between natural ventilation and thermal comfort. In Southeast Asia specifically natural ventilation and higher air velocity affect people preference in determining thermal comfort level. Higher wind speed makes air heat transfer coefficient greater. The air speed makes occupants in a building feel at ease and in comfort even when the air temperature is slightly higher than the recommended standard temperature.
In rural areas of hot climate countries, natural ventilation for residential buildings is more preferable while most people cannot afford to install mechanical air-conditioning to their houses. However, the houses must have a good design to allow air circulation and heat removing activities. This is what Zain and his team conclude in their research among rural area people in Malaysia (Zain et al., 2007).
Similar results were found by Liping and Hien where large number of hours can be considered as thermally comfort by implementing fa9ade design in natural ventilated residential buildings in Singapore. They also suggest guidelines for fa9ade design to achieve required indoor air velocity for thermal comfort (Liping and Hien, 2007).
Table 2.2: Neutral temperature obtained from previous and recent thermal comfort studies in countries with hot-humid climate (Kwong et al., 2014).
Year Researcher(s) Location
1991 de Dear et al. Singapore
1992 Busch Thailand
Building type Office and residential Office Type NV AC NV Neutral temperature OT= 28.5°C OT= 24.2°C ET= 31.0°C
AC ET = 28.0°C
1996 Nicol et al. Pakistan Residential NV
and OT= 30°C
1998 2000 2002 2003 2004 2007 2006 2008 Kwok Karyano
Wong et al. Wong and
Khoo Feriadi and
Wong Han et al.
Hwang et al.
Hawaii Indonesia Singapore Singapore Indonesia China-South Taiwan-Central and South Institutional Office Residential Institutional Residential Residential (Summer) Commercial AC NV AC NV AC NV NV NV NV NV AC
Yang and China-South Office and NV
Zhang residential AC
Legend: NV, Naturally ventilated; AC, air-conditioned; temperature; OT, operative temperature.
OT= 28.6°C (hot season) OT= 23.3°C (hot season) OT= 30.?°C OT= 26.?°C OT= 28.9°C OT= 28.8°C OT= 29.2°C
OT= 28.6 A°C
ET= 26.3 A°C
ET= 24.7 A°C
OT= 28.3 A°C OT= 27.7 A°C ET, effective
Based on references cited above for hot and humid tropical climate countries, researchers noticed that in general, the range of neutral temperature in determining thermal comfort condition is actually beyond the acceptable thermal comfort recommended in ASHRAE 55. This argument has more physical sense for building without artificial air-conditioning system and ventilate naturally. Over estimation of thermal sensation of occupants in many researches is the reason why the results of PMV index become unusable for actual practice. The suggested natural ventilation in many studies suggested is more practical for residential building and in rural areas. For industrial and commercial buildings, normal air temperature control is an essential because of safety issue and industrial requirements.
2.2.2 Energy Efficiency and Thermal Comfort
Energy efficiency is an important subject when air-conditioning system is discussed because energy used to operate HVAC system apparently becomes the main contributor, up to 40% to energy usage for a building (Mobil, 2013). In another research, the power consumption for HVAC system in service and residential building can be arrived up to one third or nearly 68% from the total. The number shows how important the system is in nowadays-daily life activities and the opportunity to reduce the consumption and the cost as well (Stavrakakis et al., 2010).
According to research results done in 1997, 34.4% of the energy use in buildings can be reduced by maintaining the indoor temperature at 2°C higher than the conventional temperature setting (Yang and Su, 1997). Because of energy consumption brings effect to operational cost, sometimes people make energy improvement program to reduce cost and unintentionally sacrificing the thermal comfort for the user of that building. In a more extreme condition, some building designer ignores the main objectives of building to provide healthy and productive environment for occupants just to reach their aim to make an energy efficient building. Ideally, thermal comfort should not be sacrificed for energy manager or building designer to achieve better energy efficiency because it defeat the purpose of the building itself. Kwong and Ali made a conclusion in their study that "Energy efficiency strategies should be done in accordance to the occupants' comfort and safety, as buildings are built to serve humans in various kinds of activities" (Kwong and Ali, 2011 ).
Energy saving without large investments are commonly suggested in many studies related to thermal comfort in hot-humid climate regions. Comparison between the research results and recommended indoor temperature stated in international standard always shows some different values, which the temperature determines from the survey slightly lower than the standard range. From the results obtains, suggestions were made to energy management improvement for the respective buildings. However, practical energy improvement program creates a big challenge to engineers and energy manager to make balance between efficiency and thermal comfort.
One of the solutions sustaining thermal comfort condition effiCiently has been studied by Wan and friends at Guangzhou, China in 2009. In their study, they tried to find the effects of indoor temperature and relative humidity on human thermal comfort and energy consumption. At the end of the study, they found when indoor temperature increases, system cooling load and energy consumption would increase proportionally to the indoor temperature. By using effective temperature (ET*) recommended in ASHRAE fundamental Handbook (ASH RAE, 2001 ), they determine the most efficient indoor temperature and relative humidity by intersecting graph line between ET*-cooling load curve and temperature-cooling load curve for a required human thermal comfort level (Wan et al., 2009).
Getting efficient cooling system is not just adjusting set temperature to required point. The perceived temperature felt by occupants also is affected by the air movements. Air is known as poor thermal conductor because of its low thermal conductivity coefficient. However, this coefficient becomes greater by the increase of air velocity. In one of the reference documents in Malaysia mentions that the thermal comfort of people in hot-humid tropic countries may increase by the increase in air movement. The movement of air evaporates the water on human skin and increases the cooling rate by convective heat transfer. It is also noted in that document that the air velocity between 0.15 - 1.5 m/s would provide more comfort condition for people in tropical climates (STANDARDS MALAYSIA, 2007). A survey made by Zhang to 200 office workers regarding air movement preference shows dissatisfaction in the amount of air movement commonly happen to the workers. More than half from the total sample of the survey says the air motion is not enough for them to feel comfort even if the air motion setting comply with ASHRAE and ISO standards (Zhang et al., 2007). Candido and colleagues suggested in their studies about air movement acceptability limit that for the indoor temperatures at 26°C and 30°C, the air motion should be reach up to 0.4 mis and 0.9 mis respectively. The participants from a total number of 2075 survey also demand that the air speed should be more than what they feel at that time and the extreme finding is that air velocity required exceed ASH RAE standard limit by 0.8 mis (Candido et al., 2010). Another survey made in a similar climate in India where most offices surveyed was supplied with air velocity at 0.2 m/s or below. Most of occupants in the offices use fans to get better condition. At a temperature of 29°C, 87% workers use fan in natural ventilation office while 50% of people works in office with mechanical air-conditioning need fans at the same temperature (lndraganti et al.,2014).
Many results from air motion study survey in hot-humid countries conclude their research with questions to ASHRAE and ISO standard. Some of them suggest that the standard should be revised for the mentioned study areas. To achieve more energy efficient building status, air velocity should be increased to reasonable speed especially for office and natural ventilated buildings.
In Malaysia, many studies done in the literature talk about energy efficiencies in buildings. A part of them studies about effectiveness comparison between different types of ventilation. Based on their finding, night v:entilation either passive or active cooling are more efficient than day ventilation or full day ventilation (Jamaludin et al., 2014) Kwong and his team already discussed extensively in their review about thermal comfort and its relation to energy efficiency. In their conclusion, about 2150 GWh energy can be reduced from annual Malaysian consumption by just increasing the thermostat by 2°C. They also suggest that 26°C is the neutral temperature for natural ventilated building occupants in a hot-humid climate country (Kwong et al., 2014). This suggestion was supported by other researcher who made their research in the same type of climate countries (lndraganti et al., 2014; Zhang et al., 2010).
Concern about energy efficiency is not a new topic among researchers and scientists in Malaysia. Since 1979, the government had put an action to reduce the carbon dioxide {C02 ) emission that leads to the implementation of Energy Efficiency & Conservation (EE&C) and Renewable Energy (RE) strategies in National Energy Policy 1979 (Khor and Lalchand, 2014). The National Energy Policy 1979 was formulated with three objectives: (1) to supply adequate energy cost-effectively from indigenous non-renewable and renewable resources, yet securely by diversifying the sources; (2) to utilize energy efficiently and productively; and (3) to minimize negative environmental impacts in the energy supply chain (S-Jalal and Badger, 2009). This policy is still ongoing and it acted as a booster to the involvement of private sectors in energy efficiently industry. In early 2004, Malaysians Government published a new energy efficiency standard for air-conditioning appliances as an initiative to reduce the potential of greenhouse gases emissions. This new rule gives a significant effect to air-condition manufacturer in Malaysia to produce high efficiency appliances and show a good effect to better environments (Mahlia et al., 2004).
Jumping into a study about natural ventilated building in hot and humid country is not an awkward thing. By taking previous studies as an examples and references, this study will gain its benefit at the end to save some energy for sustainable environments. Installing mechanical air-conditioning system to a room to create lower temperature is not really a brilliant solution while we can take advantage from natural sources to gain thermal comfort level. In addition to high capital investment, artificial air-conditioning creates more cost for operation and maintenance as well. Environmental issues such as ozone depletion and global warming also need to be considered in comparing these two systems.
2.3
CFO Numerical Simulation
Typically, there are many different types of method that can be used to make assessment to natural ventilation and thermal comfort conditions. Some people prefer assess by experiments and some researcher favour to do public survey while others rely on CFO simulation. Every method of assessment has its own pros and cons. Reliability and accuracy of data become big issues in CFO approaches. Comparing full scale and reduced-scale experimental measurement to CFO analysis will expose more disadvantage of CFO itself because it employed many assumptions and simplifications in its calculations. Of course, the results from this simplification may vary from actual values. However, CFO also has major advantages that are opposed by experimental methods. CFO can provide information on the relevant flow variables in the whole calculation domain, under well-controlled conditions and without similarity constraints (van Hooff and Blacken, 2010). Unlike experiment, lot of CFO simulations can be done in just a single capital investment and minimal running cost. This benefit makes CFO more becomes preferable method from time to time
Since 19th century, fluid dynamic analyses by numerical methods were used to predict and forecasting local weather. At this stage, the physical space was divided to grid cells to allow calculation done using finite difference approximation method. Starting from that effort, numerical methods calculations become popular to solve other type of flow problems in other industries like oil and gas, water supply, aerospace etc. However, computer simulation has a limit because to run such complex calculations, it requires high-speed computer and large memory storage. Therefore, we can see in the past, the advancement of CFO industries expand parallel to the development of computer industries. The advancement in computing processing power and the availability of commercial software since 50 years ago boost CFO to become an important tool to solve many problems in thermal comfort studies, energy efficiency design, environmental control and not forgetting health and safety improvements for buildings (Hajdukiewicz et al., 2013).
Mechanical ventilated and air-conditioned or natural ventilation compound spaces always become subject to those interested in thermal comfort studies. For Chow and Fung, they decide to make research in mechanical ventilated space to find the correlation between airflow and microscopic design parameters. The results obtained from CFO simulation were compared with experimental data. In their conclusion, they admit that CFO is worth to try but not suitable to use in their case (Chow and Fung, 1996). What happen to both researchers at that time was, the computer simulation was not as advance as today. The simulation software also was still in development stage so the results gained may deviated quite a lot from the experiment. However, in 2003 the situation changed. Posner and his team made another simulation using different type of model. Again at the end of their study, comparison with experimental results was made. They found the errors obtain from CFO simulation is not more than 20% compared to the experiment (Posner et al., 2003). The achievement by Posner and his team is just an example of many other achievements using CFO. Better CFO results in more recent years achieved by other researchers come from the improvement of computer capabilities and simulation software as well (Stavrakakis et al., 2008; Stavrakakis et al., 201 O; Prajongsan and Sharples, 2012).
3 CFO METHODOLOGY VALIDATION
3.1
Overview
Solving engineering problems using CFO is a typica1 nowadays. However, reliability and validity of the
イ・セャNNゥセセエセ@
issues of the computer simulation. The process Q
エセ@
<:}Cl research started with verification of simulation methC}エセセセiGセ@
セセセセ@
verification process requires three-dimensional ClャNNゥセセ@
i"V
セ@
reconstructed before generating nodes element f«:)H[セ「Gイゥセ@
t'\ゥZZ|セセセ|L@
comparison can only be made after computerウゥュオャセiGᄋ@
セゥ@
)ャZjャNゥセ@
セ@ セ@
condition setup. The general steps conducted in thisャGエ
Qセイゥセャャャセ@
セエMセQGNjセiセセ@
セ@ セセM
セセセ@
l'llri '1:::iセセセセiZZ[|セセセセ@
1. Developed 30 model and CFO simulation
ッヲセ@
セiGセセセ@
vカセ@
セエイセセエQセ@
セセiG@
2. Verified the simulation results with publishedcャセャセセエ@
BvセエセエゥャGセ@
セ@ セセ@
セゥ@ セ@
3. Created 30 model of selected case・ョカゥイッョイョセ@
セエセ@
セcャ@
IJBセNセ
Q
QZZ[セ@
tセエセセOGG@
4. CFO simulation for control condition used valici t'itiGセ|LM
' Iセ@ セセセ@
,セ@
5. CFO simulation for environment used new ウケセエセエセcャ@ Qセ@ セセ@ ·f-
セG@ 6. Results before and after the implementatioriセセ@
エヲGIセ@
セセ@
セセ@ セ@ セ@
compared C}f
エセ|GNj@
\セBセ@
エセセ@ セ@ セiG@
y
All processes related to CAD 30 modelling,
ョゥセ@
iGIセ@
セ@
conducting using CATIA V5-6R2012, Ansys Meshiriセセゥ@
\Fluent 14.5 respectively. Modelling in CATIA reduc:;
セ@ セ@ エG|セ@
セ@
セセ@
this research adopted a three-dimensional mode1セcャ@ Qセcャャャャ@
l')l:lセエ@
capability and flexibility in 30 modelling process ·
セaL@
t C}fセイ@
セ@
セセ@
software. Ansys Meshing Modular is part of Ansysセセセ@
't1A..QZQセ
Q@ qセセ@
\capable to create meshing in no time without
ァセM
セiG@ ijセiGセ@
セ|GNj@ セゥ@ ᄋセ@ iセ@
,
セiG@
control. With the limited time of completing this
イ・セセエG|セ@
セ「セエG|@
1:1エエエセセゥ@
セセQセ@ セ@
lot of advantages compared to ICEM CFO inエ・イセ@
セャG」Z[セエG|エᆱZス@
セセ@ セ@ セiGセセセ@
\generate multiple types of mesh.
セ@
" •エゥNNNNQZQセ@
セセ@ セエォセ@
lil\t-.
セiG@
"f LGQQセ@ t fi 'l k A|⦅Giセ@ セ@エQセ@
セセゥゥG|@
セセQゥZZ|ᄋQセ@
ケセ@
3.2
CAD Model and Simulation from Literql
セMMセ@
A published journal paper selected as reference to 'v
in this report. The paper titled CFO simulation r・ウセ@ セャゥ」ゥ@
セ@ セエ|セセiGセ@
iZGNAセ@ エセセ@
セ@ セ@ I\_ エセ@ セゥ@ セ@
'
セセャGセᄋLセセセエセNエエ@
セエゥセセ@
セ
Q
エエ
Qセ@
エゥセ|Lセ@
セ@
ttエセ@
Air Quality was published in 2014 in Science of エィセ@ セBセQMゥセエセ@ t
The authors of this paper selected a room of a res1
セエ@
of)セセ@
an example for their simulation. Even though the
アセセエG|セi@
セエG|@ セセセゥャォ@
air quality in the room and the impact on human
エセセ@
QセQ@
b 'virセゥN@
' \temperature were also parts of the concern in their
セセセiセセ@
ヲセ@ ャNNゥゥQセNセセセ@
ャセエᄋ@
why this paper was selected was that the envirori Qセ」Z[@ セN@
tセャNNゥセ@ iセ@ GGセセ[@
'1:::ialmost the same as the case for this research that
ャNNゥセセエG|@
ャNNゥセセゥ@
セセ@ セiZGNAセ@
iセエセG@
/ r for the simulation. Secondly, the room selected an(jセセ」ゥ|セセセセM
セゥイ@ セセ@ セ|jセエMゥエOセエエセ@
12
セセ@
IセエLセGエエ@
セ@
\,セイ@ セゥセBエエ@
C},..セケセャNNゥ@
ャNNゥセセセ@
セiセセ@
セエエセ@ セiN@
t "'
iセセ@
iGセ@ セゥエ@
tf iセセ@
\Jt
ti ty
|セ@エセャZZ[ャゥセエゥ@
iGセセ@ セエエ@ セ@