8 CHAPTER II
THEORITICAL BACKGROUND
2.1 Literature Review
2.1.1 Macroeconomy Indicators
As stated by Coleman and Tettey (2008), generally, the barometers
for measuring the performance of the economy include real GDP growth
rate, rate of inflation and interest rate. These three macroeconomic
indicators actually related to each other. Researcher will analyze these
relations first before discuss each indicators. This relations can be
understood by theory of money demand.
The quantity theory of money holds as the supply of money increases
relative to the demand of money (Hirt and Block, 2006). The demand of
money is the amount of wealth that individuals, households, and businesses
choose to hold in the form of money. Increase in real GDP raise the nominal
volume of transactions and thus demand of money also increase (Frank and
Bernanke, 2001). In the long run, the main influence on aggregate demand
is the growth rate of the quantity of money. At times when the quantity of
money increase rapidly, aggregate demand increases quickly and the
inflation rate is high (Parkin, 2008). When the inflation rate is increase the
interest rate tend to increasing as well. This relationship is called as Fisher
9 This is the direct effect of money on stock prices sometimes referred
to as the liquidity effect. As an increase or decrease in the money supply
influences economic activity, it will eventually impact corporate earnings,
dividends, and returns to investors (Hirt and Block, 2006).
2.1.1.1 Gross Domestic Product
Gross Domestic Product is the value of all final goods and services
produced in the country within a given period (Frank and Bernanke, 2001).
Economic growth is a sustained expansion of production possiblities
measured as the increase in real GDP over a given period (Parkin, 2008).
GDP can be distinguished to nominal GDP and real GDP. When GDP is
calculated using the price from a base year, rather than the current year’s
prices it is called real GDP.
In this research, the economic growth rate expressed by the
percentage change of GDP. To calculate this growth rate, according to
Parkin (2008) the formula is :
��� ℎ � = ��� ��� � � − ��� � � � � ×
The growth rate of GDP tells how rapidly the total economy is
expanding. This measure is useful for telling about potential changes in the
10 2.1.1.2 Inflation
Inflation is a persistent rise in the average of all prices (Parkin, 2008
: 471). Unpredictable inflation brings serious social and personal problems
because it retributes income and wealth, and diverts resources from
production.
Economists have long realized that during periods of high inflation,
interest rate tend to be high as well (Frank and Bernanke, 2001). This
relationship can be explained by Fisher effect which is the tendency for nominal interest rate to be high when inflation is high and low when
inflation is low (Frank and Bernanke, 2001).
This tendency actually hurts stock market performance in two ways.
First, it slows down economic activity, reducing the expected sales and
profit companies whose sahres are traded in stock market. Lower profits, in
turn, reduce dividends those firms are likely to pay their shareholders.
Second, higher real interest rate reduce the value of stocks by increasing the
required return for holding stocks, reducing the demand for stock and reduce
the stock price as well.
2.1.1.3 Interest Rate
The interest rate is the amount of interest paid per unit of time
expressed as a percentage of the amount borrowed (Samuelson and
Nordhaus, 2002). Economists refer to the annual percentage increase in the
11 According to Rose and Marquis (2009), the rate of interest performs
a number of important functions to support the smooth, efficient functioning
of the economy :
1. It facilitates the flow of current savings into investments that promote
economic growth.
2. Interest rates allocate the available supply of credit to those investment
projects with the highest returns.
3. Adjustment in interest rate can bring the supply of money into balance
with demand.
4. Interest rates are an important tool of government policy through their
influence on the volume of saving and investment.
Higher interest rates provide incentives to increase the supply of
funds, but at the same time they reduce the demand for those funds. Lower
interest rates have the opposite effects (Rose and Marquis, 2009 : 119). High
interest rate reduce the present value of future cash flows, thereby reducing
the attractiveness of investment opportunities (Bodie et al, 2003).
As explined in their book, Rose and Marquis (2009) stated that as
with bonds and other debt securities, there tends to be an inverse relationship
between interest rates and corporate stock prices as well. If interest rates
rise, debt instrumets now offering higher yields become more attractive
relative to stocks, resulting in increased stock slaes and declining equity
12 dump their lower-yielding bonds and switch to equities, driving stock price
upward.
2.1.2 Stock Market Performance
Capital markets are the channels through which firms obtain
financial resources to buy physical capital resources (Parkin, 2008: 400).
Stock market is a place where the shares in publicly owned companies, the
titles to business firms, are bought and sold (Samuelson and Nordhaus,
2002: 531). A market can be classified as primary and secondary. Primary
markets are security markets where new issues of securities are initially
sold. A secondary market is a market where securities are resold. In this
research study, secondary markets are discussed.
Stock market performance can be figured out by indexes. Indexes
allow investors to measure the performance of their portfolios againts an
index that approximates their portfolio compostition. Each index is intended
to represent the performance of stock traded in a particular exchange or
market.
2.1.2.1 Market Liquidity
Liquidity is a measure of the speed with which an asset can be
converted into cash at its fair market value. Liquid market exist when
continuous trading occurs, and as the number of participants in the market
13 liquidity feature of financial assets tends to lower their risk, liquid assets
carry lower interest rates than illiquid assets (Rose and Marquis, 2009 : 218).
The liquidity of the market can be measures by trading volume,
frequency of trades, and average trade size. Bongdan et al. (2012) stated that
trading volume measure is trying to capture the quantity of shares per time
measure the depth dimension of liquidity, it is also an increasing function of
liquidity. Stock with a higher volume are ore liquid, they also have lower
spreads. In this research study, the market liquidity measured by volume of
transaction on an average monthly basis.
2.1.2.2 Market Capitalization
Market capitalization can be a tool to know the performance of
capital market. Market capitalization is the total dollar market value of all
of a company’s outstanding shares. Market capitalization is calculated by
multiplying a company’s shares outstanding by the current market price of
one share. The investment community uses this figure to determine a
company’s size, as opposed to sales or total asset figures
(www.investopedia.com).
2.1.2.3 Market Return
According to investopedia.com, a return is the gain or loss of a
security in a particular period. The return consists of the income and the
14 The return on an investor’s portfolio during a given interval is equal
to the change in value of the portfolio plus any distribution received frrom
the portfolio, expressed as a fraction of the initial portfolio value (Fabozzi
and Modigliani, 2009). Based on Hirt and Block’s book (2006), the rate of
return from an investment can be masured as :
�� = Ending value − Beginning valueBeginning value
2.1.3 The Relation Between Economic Condition and Capital Market
As writen by Hirt and Block (2006), the direct effect of money on
stock price sometimes referred to as the liquidity effect. The quantity theory
of money holds that as the supply of money increases relative to the demand
for money, people will make adjustment in their portofolio assets. The
supply of money here is the M2 that includes cash, savings deposit, money
market mutual funds, and other time deposits. According to investopedia,
M2 includes assets that are highly liquid but not cash. A consumer or
business typically won’t use savings deposits and other non-M1
components of M2 when making purchases or paying bills, but it could
convert them to cash in relatively short order. Indirect effect of money on
stock prices would be its impact on gross domestic product and corporate
profits. As an increase or decrease in the money supply influences economic
activity, it will eventually impact corporate earnings, dividends, and returns
15 2.2 Review on Previous Researches
There are some researchers who have studied the impact of
macroeconomy indicators to stock market performance. There are several
researches related to the topic :
Raza et al. (2015) investigated the impact of foreign capital inflows and economic growth on stock market capitalization in Pakistan by using
the annual time series data from the period of 1976 to 2011. They used
autoregressive distributed lag bound testing cointegration approach, the
error corection model and the rolling window estimation procedures to
analyze the long run, short run, and behavior of coefficients. Results
indicate that FDI, workers’ remittances and economic growth have a
significant positive relationship with the stock market capitalization in long
run as well as in short run. It is also suggested that the economic growth is
a better leading indicator for stock market capitalization in Pakistan.
Karam Pal and Ruhee Mittal (2011) examined the long run
relationship between the Indian capital market and key macroeconomic
variables such as interest rates, inflation rate, exchange rates and gross
domestic savings (GDS) of Indian economy. Quarterly time series data
spanning the period from January 1995 to December 2008 has been used.
The unit root test, the co-integration test and error correction mechanism
have been applied to derive the long run and short term statistical dynamics.
16 and Indian stock indices which is indicative of a lng-run relationship. The
capital markets indices are dependent on macroeconomic variables even
though the same may not be statistically significant in all the cases.
Hussainey and Ngoc (2009) investigated the effects of
macroeconomic indicators (the interest rate and the industrial production)
on Vietnamese stock prices. They used monthly time series data from
January 2001 to April 2008. This paper provides the first empirical evidence
taht there are statistically significant assocoations among the domestic
production sector, money markets, and stock prices in Vietnam. It found
that the industrial production has a positive effect on Vietnamese stock
prices. They also found that the long and short term interest rate are not
affectingstock price in the same direction.
Kyereboach-Coleman and Agyire-Tettey (2008) examined how
macroeconomic indicators affect the performance of stock markets by using
the Ghana Stock Exchange as a case study. Quarterly time series data
covering the period 1991 – 2005 were used. Cointegration and the error
correction model techniques are employed to ascertain both sort and long
run relationship. They found that macroeconomic indicators such as lending
rates and the inflation rate affect on stock market performance. They found
that lending rates from deposit money banks have an adverse effect on stock
market performance and particularly serve as major hidrance to business
17 market performance, the results indicate that it takes time for this to take
[image:10.595.88.511.174.752.2]effect due to the presence of a lag period.
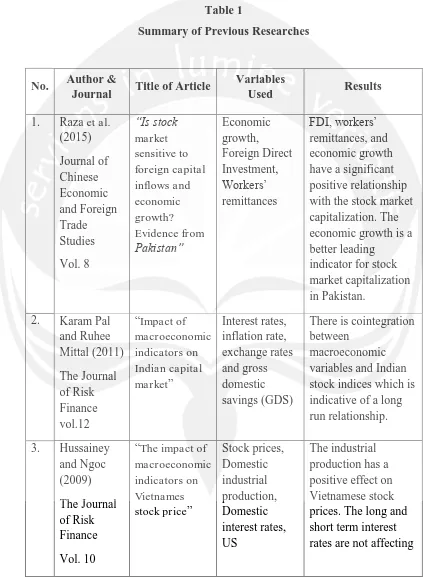
Table 1
Summary of Previous Researches
No. Author &
Journal Title of Article
Variables
Used Results
1. Raza et al. (2015) Journal of Chinese Economic and Foreign Trade Studies Vol. 8 “Is stock market sensitive to foreign capital inflows and economic growth? Evidence from Pakistan” Economic growth, Foreign Direct Investment, Workers’ remittances FDI, workers’ remittances, and economic growth have a significant positive relationship with the stock market capitalization. The economic growth is a better leading
indicator for stock market capitalization in Pakistan.
2. Karam Pal and Ruhee Mittal (2011) The Journal of Risk Finance vol.12
“Impact of macroeconomic indicators on Indian capital market” Interest rates, inflation rate, exchange rates and gross domestic savings (GDS)
There is cointegration between
macroeconomic variables and Indian stock indices which is indicative of a long run relationship.
3. Hussainey and Ngoc (2009) The Journal of Risk Finance Vol. 10
“The impact of macroeconomic indicators on Vietnames stock price”
18 macroeconomic
indicators
stock prices in the same direction.
4. Kyereboach - Coleman and Agyire – Tettey (2008) The Journal of Risk Finance vol. 9
“Impact of macroeconomic indicators on stock market performance. The case of Ghana Stock Exchange”
Lending rates
Inflation rate
Lending rates from deposit money banks have an adverse effect on stock market performance and particularly serve as major hindrance to business growth in Ghana.
2.3 Hypothesis Development
Raza et al. (2015) in their research concluded that economic growth have a significant positive relationship with the stock market capitalization
in long run as well as in short run. It is also suggested that the economic
growth is a better leading indicator for stock market capitalization in
Pakistan. So based that theory and previous research, the researcher can
conclude that real gross domestic product growth rate give positive impact
to stock market performance.
H1 : There is positive impact of real Gross Domestic Product
growth rate to stock market performance.
In their book, Frank and Bernanke (2001), explained that inflation
hurts stock market performance. It slows down economic activity, reducing
19 market. Lower profits, in turn, reduce dividends those firms are likely to pay
their shareholders. Kyereboach-Coleman and Agyire-Tettey (2008)
examined how macroeconomic indicators affect the performance of stock
markets by using the Ghana Stock Exchange as a case study, their result
concluded that Inflation rate is found to have a negative effect on stock
market performance. Based on thaat theory and previous research,
researcher conclude that the inflation rate have negative impact to the stock
market performance.
H2 : There is negative impact of inflation rate to stock market
performance.
According to Rose and Marquis (2009), as with bonds and other debt
securities, there tends to be an inverse relationship between interest rates
and corporate stock prices as well. Kyereboach-Coleman and Agyire-Tettey
(2008) in their research found that lending rates from deposit money banks
have an adverse effect on stock market performance and particularly serve
as major hidrance to business growth in Ghana. Based on that reason, the
researcher conclude that interest rates have negative impact to the stock
market performance.
H3 : There is negative impact of interest rate to stock market