I. Background
This section establishes the context of the study by highlighting the crucial role of the industrial sector in national and regional economic development. It emphasizes the importance of identifying high-growth sectors like manufacturing, particularly the pulp and paper industry, for achieving economic prosperity. The section introduces Riau Province as a major contributor to Sumatra's GDP and a significant player in the pulp and paper industry, with key players operating in Perawang and Kerinci. The high contribution of the manufacturing sector, and the pulp and paper industry within it, to Riau's GRDP in 2010 is underscored. This sets the stage for investigating the industry's role in the regional economy using input-output analysis. The pedagogical value lies in demonstrating the practical application of economic theories in analyzing regional economic development. Students learn to identify key sectors driving growth and understand the broader macroeconomic context of industrial activity.
1.1 Industrial Role in Economic Development
This subsection provides a comprehensive overview of the industrial sector's significance in national economic development. It introduces key concepts like industrialization strategies (Import Substitution Strategy and Export Promotion Strategy), highlighting their role in shaping industrial growth. The categorization of Indonesian industries into large-scale, medium-scale, small-scale, and home industries is explained, emphasizing the importance of the manufacturing sector in contributing to Indonesia's GDP until 2011. The discussion of government policies promoting non-oil commodity exports and their positive impacts on the national economy offers valuable insights into the interplay between government intervention and industrial growth. This content is pedagogically beneficial as it allows students to analyze the strategic role of industries in macroeconomic performance and understand the influence of government policies on industrial development.
1.2 Sumatra and Riau's Economic Significance
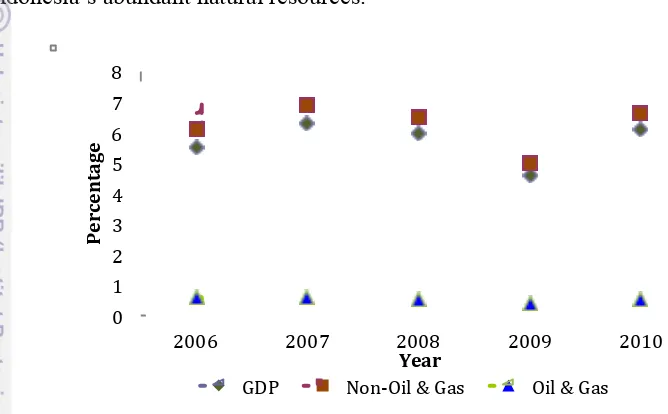
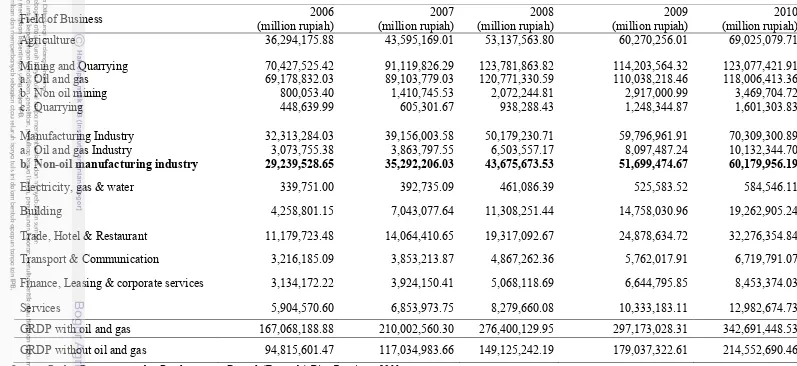
This subsection focuses on the contribution of Sumatra and Riau Province to Indonesia's GDP. Data from 2009-2011 indicates Sumatra's significant contribution (around 23% of Indonesia's GDP). The section pinpoints Riau as one of the top contributors in Sumatra, further emphasizing the importance of understanding its economic structure. The high contribution of the manufacturing sector, including the pulp and paper industry, in Riau's GRDP in 2010 is again stressed. This section's academic relevance lies in showcasing regional economic disparities within a nation and highlighting the need for targeted regional economic development strategies. From a pedagogical standpoint, it helps students analyze regional economic data and understand how regional economies contribute to national aggregates.
1.3 Pulp and Paper Industry: Global and National Context
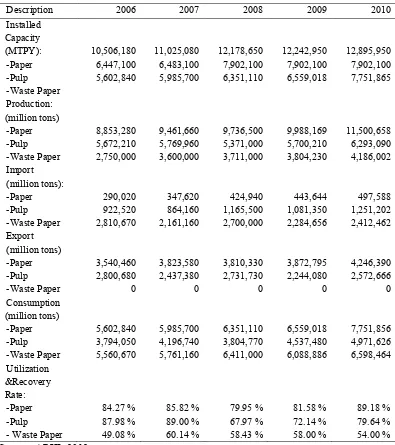
This subsection delves into the global and national significance of the pulp and paper industry. It showcases Indonesia's position as a major producer and exporter of pulp and paper products, emphasizing its contribution to national income through export revenues, value addition, job creation, and tax revenue. The section also analyzes supporting factors like the availability of raw materials (wood), favorable climate, and lower production costs compared to other countries. It provides a comparative analysis of Indonesia’s pulp production costs with those of the USA, Canada, and Brazil, showing Indonesia’s competitive advantage. This section underlines the importance of comparative advantage and the role of resource endowments in industrial development. Pedagogically, this serves to illustrate the international competitiveness of industries and the importance of cost-efficiency and resource management in economic success.
1.4 Pulp and Paper Industry in Riau: Local Context
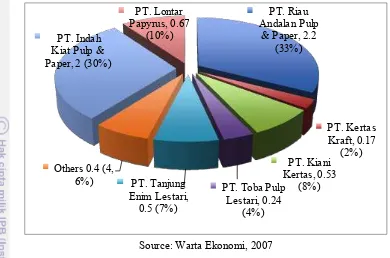
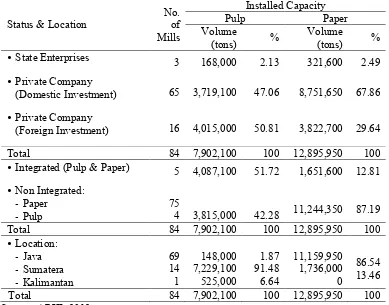
This subsection focuses on the pulp and paper industry within the specific context of Riau Province. It highlights the presence of major players like Sinarmas Group (APP) and Raja Garuda Mas Group (APRIL), with their significant production capacities. The Law No. 25 of 1999 on Regional Autonomy and its relevance to Riau's economic development are also presented. This section provides a concise overview of the industry's structure and its importance to Riau’s economy, setting the context for the subsequent analysis of the industry’s role in Riau’s GRDP growth. The section is relevant because it links regional economic development to national policy frameworks and highlights the contribution of large corporations to regional economic growth. From a pedagogical standpoint, this demonstrates how regional economies function within a broader national policy and industrial landscape.
1.5 Research Problem, Goals and Significance
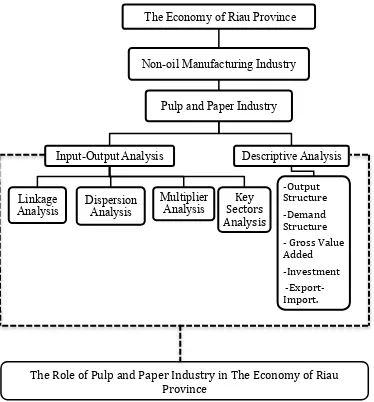
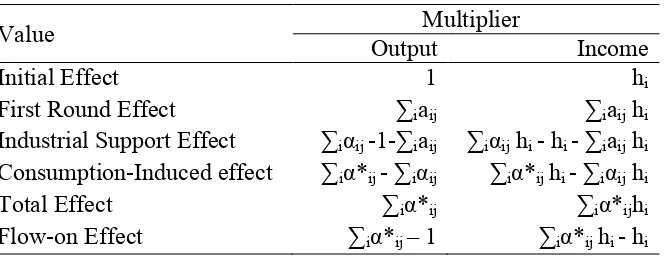
This subsection lays out the research problem, goals, and significance. The research questions center on the contribution of the pulp and paper industry to Riau’s economy, considering various aspects such as its demand and output structures, gross value added, investment, exports/imports, and linkages with other sectors. The research aims to analyze the industry’s contribution to GRDP growth, its forward and backward linkages, its output and income multipliers, and its role in key sectors. The significance of the research lies in providing valuable information for policymakers, industry stakeholders, and future research. Pedagogically, this part provides an example of a well-structured research design, emphasizing the importance of clearly defining research problems, objectives, and expected outcomes. It also models the process of formulating research questions based on a clear understanding of the context and available data.
1.6 Scope and Limitations
This section outlines the scope and limitations of the study. It clarifies which aspects of the pulp and paper industry are included (e.g., pulp and paper production but not downstream sectors like printing), the types of pulp and paper covered, and the data and methods used (Input-Output Table of Riau Province 2010, IOAP software, Excel). The limitations are explicitly stated, such as the aggregation of sectors, the focus on economic aspects only (excluding environmental impacts), the unavailability of employment data preventing an analysis of employment multipliers, and the static nature of the input-output model used which prevents examination of income distribution aspects. This transparent disclosure of limitations is critical for academic rigor and allows for a more realistic interpretation of the findings. Pedagogically, this section demonstrates the importance of clearly defining the boundaries of research, acknowledging limitations, and conducting analyses within the specified parameters. It highlights responsible research practices and helps students learn to critically evaluate the scope and limitations of research.
II. Literature Review
This section provides a review of existing literature on pulp and paper, contextualizing the study’s topic within existing scholarly knowledge. It begins by defining pulp and paper, tracing their historical development, and discussing the broader context of the pulp and paper industry globally. It also delves into the classification of the pulp and paper industry according to different criteria (fiber length, manufacturing process, raw materials, pulp type). This section is crucial for establishing the theoretical and empirical foundation for the study. The pedagogical benefit is in demonstrating how a literature review helps to frame a research problem, and the ability to synthesise information from various scholarly sources to build an argument.
2.1 Pulp and Paper: Definitions and History
This subsection provides a comprehensive definition of pulp and paper, differentiating between the two and tracing their historical development. It explores different types of wood used in pulp production and highlights the versatility of paper. The subsection traces the history of papermaking from its origins in ancient China to its modern industrial production, emphasizing key innovations like mechanical pulping and the shift from fiber crops to wood pulp. The etymological origins of the word "paper" are discussed. This part offers a thorough historical and technical perspective, enriching the understanding of the industry’s evolution. Pedagogically, it provides a rich narrative, illustrating how technological innovations shape industrial practices and demonstrates how historical context is relevant to current economic analysis.
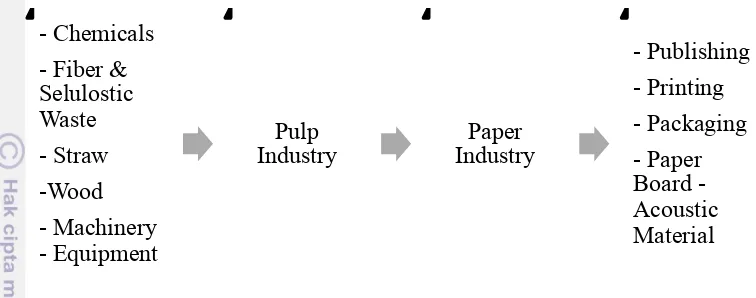
2.2 Pulp and Paper Industry: Structure and Global Landscape
This subsection provides an overview of the pulp and paper industry’s structure, its global distribution, and the capital-intensive nature of the industry. It identifies the major players and regions dominating the industry, including North America, northern Europe, and East Asia, while also noting the expansion to countries like Russia, China, and Indonesia. The classification of the industry into pulp and paper sectors and their sub-categories (based on raw materials, manufacturing process, and fiber length) is detailed, reflecting industry-specific terminology and organizational structure. This section is essential for understanding the industry’s global reach, its structure, and its geographical distribution. Pedagogically, it teaches students about the global value chains and the different types of players that are part of a global industry; in addition, it helps them understand the classification of industries and their respective sub-sectors based on various factors.