IN MALACCA MOSQUE, MALAYSIA: A CASE STUDY ON
THE SAYYIDINA ABU BAKAR MOSQUE
Azma Putra, Dayang H. Kassim, Mohd Y. Yaakob, Y. Abdullah,
Nor S. Muhammad and Ruztamreen Jenal
Faculty of Mechanical Engineering, Universiti Teknikal Malaysia Melaka, Hang Tuah Jaya 76100, Durian Tunggal, Melaka, Malaysia,
e-mail: [email protected]
Mohd Jailani M. Nor
Department of Mechanical and Materials Engineering, Faculty of Engineering & Built Environement
Universiti Kebangsaan Malaysia, 43600 UKM, Bangi Selangor, Malaysia
As a building for worship and one of the important symbols in Islam, a mosque is usually designed with its architectural grandeur. Among of the characteristics is its spacious inte-rior to create a perception so that people will feel ’small’ when entering the house of God. Most mosques therefore have high ceiling and are usually constructed with dome shape. In Malacca, Malaysia however, the architectural of the mosque resembles the traditional Malay house where the ceiling follows a pyramidal shape. This paper discusses the acoustical con-dition of the mosque in Malacca. The Sayyidina Abu Bakar Mosque is presented here for a case study. Measurement of its reverberation time was conducted and the results are validated with simulation data from CATT room acoustics software. Other important acoustical param-eters are evaluated such as the early decay time, clarity, definition, lateral fraction and speech transmission index.
1.
Introduction
Several works have been published which studied of the acoustical parameter of mosques. Ham-mad3 performed acoustics measurement in different mosques in Amman, Jordan including the King
Abdullah mosque where RASTI, Early Decay Time (EDT) and Reverberation Time (RT) were as-sessed. The acoustical performance was found to be poor for most of the mosques, including the central King Abdullah mosque. The later was then treated by changing the wall materials and carpets to improve the articulation index.4
Similar study was also conducted by Abdou2 for mosques in Saudi Arabia employing the
im-pulse response measurement. Out of 21 mosques under study, 20 mosques shows poor RT below 1 kHz. Abdou5then continued with computer simulation to investigate the effect of mosque geome-try on the acoustical performance.
S¨u and Yilmazer6studied the interior acoustics of Kocatepe Mosque in Ankara, Turkey. They
found that the mosque is a good place for reciting the musical version of the Holy Quran, as it creates a ritual and tranquil acoustical atmosphere. However, for the prayer mode, the mosque has inadequate intelligibility of speech.
This paper presents the study of acoustical performance of mosque in Melacca, Malaysia whose ceiling geometry in particular, is different compared to the other mosques across Malaysia. The Sayyidina Abu Bakar mosque is chosen for the case study and where there are also complaints from the worshippers on the difficulty of listening sermons. A simulation model is developed using CATT indoor acoustics software and RT measurement was also conducted.
2.
Modeling and Validation
2.1 Architectural design of mosques in Malacca
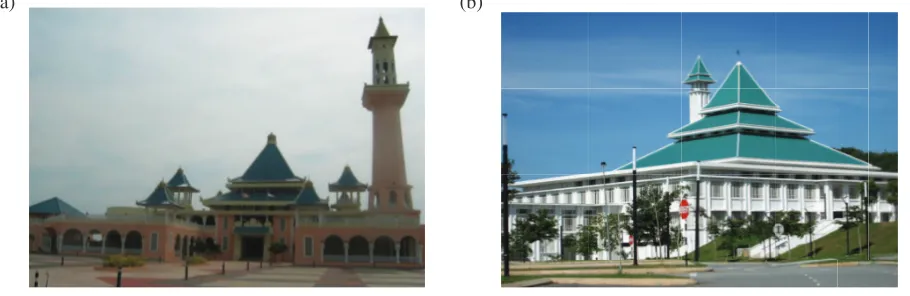
Most of mosques across the globe usually have a standard architectural design with rectangular-like geometry and with ceiling and roof having dome shape to create spatial and sacred perception. This dome is the influence from the mosques in Turkey dated from the Ottoman Empire. However, while the parallel walls enclosing the large prayer hall in its interior are almost similar for most mosques, in some places the design of the ceiling or roof corresponds to the local culture, such as in Malaysia, especially in the state of Malacca where pyramidal roof is used.
The pyramidal roof, even until now, is commonly found in traditional Malay houses. This type of pyramidal roof is often used by the modern government and public buildings to preserve the unique identity of Melaka and so much so, it is also applied in the local mosque. Figure 1 shows examples of mosques in Melaka applying the pyramidal roof design.
(a) (b)
2.2 CATT model of Sayyidina Abu Bakar Mosque
The Sayyidina Abu Bakar mosque in Melaka has a volume of approximately 19,500 m3
with 6,000 m2
surface area. It can accommodate 400 jamaah at one particular time. The roof has small dome as the top part, but supported with sloped wall structure that consists of two tier roofs each with angle of 27 degree and 30 degree from a horizontal plane. Most of the surface area are made of concrete material followed by a thick carpet on the floor and large area of glasses on the side walls and back wall.
These geometry details are then modeled using the CATT indoor acoustic software version 9. The absorption coefficient of the materials is carefully selected which are available from the software library. Ten omni directional sound sources are used in the model and are located at the actual loca-tions, i.e. two on the front wall, two on the side walls, four on the ceiling and two at the back pillars facing the back wall. The receivers are located at 16 locations across the hall with 1.5 m height; as-suming the listeners are in standing position. Fig. 2 shows the complete CATT model of the mosque and examples of sections of the interior model.
Source 1
Figure 2. (a) 3D view of the CATT model of the Sayyidina Abu Bakar mosque and (b) interior view.
2.3 Measurement of reverberation time
Measurement of RT to validate the simulation model was conducted in the unoccupied prayer hall using 01-dB Choralis Solo analyzer with dBBati software for the signal processing. The sound source GDB-S 01dB Metravib was used as the noise generator. Measurements were taken at night to reduce the effects from background noise.
Fig. 3 shows the comparison of RT from the CATT simulation and from experiment at the 16 measurement point which shows good agreement although discrepancy can be seen at several loca-tions. High level of RT above 5 seconds can be seen at 500 Hz which causes poor speech intelligibility in the mosque.
3.
Acoustical parametric analysis
0 2 4 6 8 10 12 14 16
0 500 1000 1500 2000 2500 3000 3500 4000 4500 1
Figure 3. Comparison of the reverberation time (RT) from measurement (—) and simulation (−−) and
average RT for 16 receiver locations (△).
3.1 Reverberation time (RT)
Reverberation time (RT) is the time required for a sound energy to decay by 60 dB after the sound source is switched off. RT is usually the basic parameter in the assessment of room acoustics. For speech, RT of less than 1 second in average is preferred at frequency down to 100 Hz. However this also depends on the size of the room.7 For the Sayyidina Abu Bakar mosque having volume of 19,500 m3
, the required reverberation time should be no more than 1.8 seconds.1
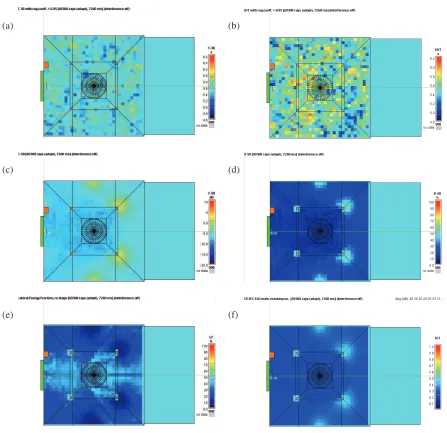
From Fig. 3, high RT above 5 second at 500 Hz has been shown. It is too high for a room categorized as ’house of worship emphasizing speech’.7 The RT mapping in Fig. 4(a) also shows
distributions of RT from 5.3 s to 5.6 s at 500 Hz. Domination of high reflective materials such glass windows and concretes usually results in late sound reflection. The only absorptive materials in the mosque is a thick carpet covering the whole surface of the floor. Long sound decay at low frequencies can reduce the speech intelligibility. Moreover, as the sermon and prayers are led by man, situation becomes more critical as the male voice obviously contains more low-frequency components than the female voice.8
3.2 Early decay time (EDT)
The defined reverberation time as above corresponds to the ’terminal’ reverberation time where we have to ’wait’ for sometimes for the sound energy to decay by 60 dB. However, in real situation where the speech is continuous, we feel only the early portion of the energy, i.e. the first 10 dB decay. This is called the early decay time (EDT) which is a better indicator for the subjective feeling of the reverberation time.6, 8
In a highly diffuse room, the ratio of EDT/RT is almost equal to 1.0 which indicates diffuseness and directness of sound energy. For the Sayyidina Abu Bakar mosque as seen in Fig. 4(b), the EDT at 500 Hz from simulation shows range from 5.3 to 5.7 s throughout the hall. The EDT/RT is therefore around 0.9–1.0 implying good sound distribution throughout the mosque. This could be due to the pyramidal ceiling which is discussed in a different section.
3.3 Clarity (C50)
Clarity (also called early-to-late sound index) is the ratio of direct sound energy arriving before 50 ms over reverberant energy arriving after 50 ms. C50 is applied for speech clarity while C80 is more suitable for music.8 According to Cavanugh et al.,9 good C50 should have clarity above
(a) (b)
(c) (d)
(e) (f)
Figure 4.Distribution maps of acoustical parameters from Sayyidina Abu Bakar mosque: (a) reverberation time (RT), (b) early decay time (EDT), (c) clarity (C50), (d) definition (D50), (e) lateral fraction (LF) and (f) speech transmission index (STI).
reverberation time. For 1 kHz, good C50 is considered to be +5 dB with RT = 0.5 s. Poor C50 is -3 dB with RT = 2 s.10 This is not much different for 500 Hz.
In Fig. 4(c), good clarity of -1 to 3 dB can be seen at the area behind the back pillars and at the side walls; all of these are area close to the sound sources therefore the receivers will have dominant direct sound. However, at the area in front of the mimbar and the mihrab up to the middle of the hall below the dome, poor clarity of -8 to -5 dB can be observed which is due to the dominant late reflections from the ceiling and the walls. Although at the front walls there are two main loudspeakers, the dominant late reflection energy is masking the direct sound energy. The loudspeakers at the ceiling are also suspected to create late reflections rather than contributing direct field of sound energy.
3.4 Definition (D50)
satisfy both music and speech performances.6
Again from Fig. 4(d), at the front wall area in front of the mihrab and mimbar to the middle of the hall, D50 can be seen to only reach 15% in average, while only small area at the back pillars and at the side walls has D50 above 40%.
3.5 Lateral Fraction (LF)
One indicator of good acoustic quality is where the audience will feel enveloped or surrounded by the sound. In a mosque, this is important to add the sacred sense and devotion when listening the recitation of the Holy Quran and the sermon delivered by the Imam. This requires strong lateral reflections with a significant fraction of the energy arriving from the side of the listeners. The magni-tude of this effect is found to be related to the proportion of sound which arrives from the side within the first 80 ms after the direct sound.8 For music, the parameter should be between 0.1–0.35 and
greater than 0.35 for all other purposes including speech.
From Fig. 4(e), in contrary from the previous results, good LF can be seen around the area in front of the mihrab straight up to the back wall with LF is between 0.4–0.5 due to the strong reflections from the side walls. The rest of the area has LF below 0.3.
3.6 Speech Transmission Index (STI)
The final acoustical parameter evaluated for the mosque is the speech transmission index (STI) which is often regarded as the direct measure of the speech intelligibility. STI accommodates both the signal-to-noise and impulse response aspects which affect intelligibility where the calculation involves modulation of the measured signal.8 The category division can be seen in Fig. 4(e).
For the Sayyidina Abu Bakar mosque, again at the back pillars and side walls the STI is around 0.4 which is categorized as ’Fair’. The remaining area with STI less than 0.4, the speech index is considered as ’Poor’ and ’Bad’.
4.
Ray tracing and echogram analysis
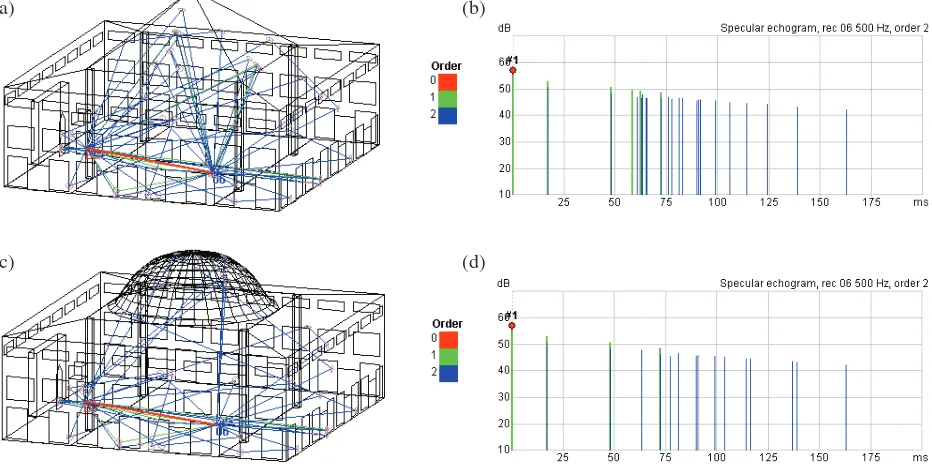
In this analysis, a large number of sound rays are traced from the sound source point up to high order reflections following the optical law of reflection. The main result is the distribution of ray directing to the receiver point. This is analysed in appropriate intervals of the time delay providing a qualitative presentation of the sound distribution in space and time.
Fig. 5(a) shows the ray tracing simulation to observe the ray distribution to the audience around the middle of the hall below the dome (receiver no. 6). The diagram only shows the second order ray which is sound reflected two times on the surface before hitting the receiver.
The sound can be seen to reflect from surfaces especially from the pyramidal ceiling before reaching the receiver. However, the second order ray can be seen in the echogram in Fig 5(b) to arrive mostly at 25 ms. Other higher order rays arrive at above 50 ms, i.e. late reflections which is why the C50 and D50 are poor around this area. This is reasonable proving large volume of the mosque. Absorptive materials and resonators can be installed to reduce these reflected energies.
Roof with pyramidal shape in Melaka mosques may have advantages of distributing the sound better than the dome shape. Fig. 6 shows the ray tracing simulation between mosque having the pyramidal and dome roofs. In order to have fair comparison, the roof is made such that the total volume of each room is almost equal.
(a)
(b)
Figure 5. (a) Ray tracing to receiver no. 6 and (b) its specular echogram.
The echogram in Fig. 6(d) can also be seen to have less component of the second order compared to that in Fig. 6(b). Especially between 50 and 75 ms, components of the first and second orders can be observed in the former and not in the latter. However, these rays come in late reflections due to the large volume of the mosque. In both cases, the sound energy due to these late reflections can be reduced by installing acoustic materials on the room surfaces to increse the acoustic clarity. Further investigation on the effect of the pyramidal surface angle on the sound distribution is also of interest.
(a) (b)
(c) (d)
5.
Conclusion
Assessment of acoustical performance for Sayyidina Abu Bakar mosque has been conducted. Simulation results of several important acoustical parameters show that the mosque has poor acous-tical performance particularly at 500 Hz. The reverberation time at this frequency is more than 5 s. The acoustic clarity is also poor mainly at the middle area of the hall. Sound distribution (diffuseness and directness) is however acceptable which could be due to the help of the pyramidal ceiling. With the large volume of the mosque, acoustical performance can be improved by introducing acoustic materials and resonators to reduce the reflected sound energy especially for the late reflections.
6.
Acknowledgment
This project is funded by the Short Term Research Grant from Universiti Teknikal Malaysia Melaka (UTeM) No. PJP/2012/FKM(50C)/S01069.
REFERENCES
1 Orfali, W.Room Acoustic and Modern Electro-Acoustic Sound System Design during Constructing
and Reconstructing Mosques, Ph.D Thesis, Technischen Universitat Berlin (2007).
2 Abdou, A. A. Measurement of acoustical characteristics of mosques in Saudi Arabia,Journal of
the Acoustical Society of America,113(3), 1505–1517, (2003).
3 Hammad, R. N. S. RASTI measurement in mosques in Amman, Jordan,Applied Acoustics,30(4),
335–345, (1990).
4 Abdelazeez, M. K., Hammad, R. N and Mustafa, A. A. Acoustics of King Abdullah Mosque,
Journal of the Acoustical Society of America,90(3), 1441–1445, (1991).
5 Abdou, A. A. Comparison of the acoustical performance of mosque geometry using computer
model studies.Proceedings of the Eight International IBPSA Conference, Eindhoven, Netherlands, 11–14 August, (2003).
6 S¨u, Z and Yilmazer, S. The acoustical characteristics of the Kocatepe Mosque in Ankara, Turkey,
Architectural Science Review,51(1), 21–30, (2007).
7 Long, M.Architectural Acoustics, Academic Press, California, (2006).
8 Barron, M. Auditorium Acoustics and Architectural Design, 2nd Ed., Spon Press, New York,
(2009).
9 Cavanaugh, W. J., Tocci, G. C. and Wilkes, J. A.,Architectural Acoustics: Principles and Practice,
John Wiley & Sons, New Jersey, (2010).
10 Bradley, J. S., Reich. R. and Norcross, S. G. A just noticeable difference in C50 for speech,Applied
Acoustics,58(2), 99–108, (1999).
11 Setiyowati, E. Strategies to increase the acoustical quality of the mosques without reinforcement