BIODEGRADABILITY OF MONOETHANOLAMINE AFTER
FENTON TREATMENT
SABTANTI HARIMURTI1*, IDZHAM F M ARIFF2, RAIHAN MAHIRAH RAMLI1, PUTRI N FAIZURA MEGAT KHAMARUDDIN1, BINAY K DUTTA1.
1
Department of Chemical Engineering, Universiti Teknologi PETRONAS, 31750 Tronoh, Perak, Malaysia 2
Novel Process & Advanced Engineering, PETRONAS Research Sdn. Bhd., 43000 Kajang, Selangor, Malaysia *Corresponding author : E8mail : [email protected]
ABSTRACT
Alkanolamines such as monoethanolamine (MEA) in aqueous solution are commonly used for scrubbing of acid gases. High concentrations of alkanolamine waste can be generated from natural gas processing plants which may be difficult to treat in a conventional biological treatment unit. In this paper, chemical pretreatment of MEA using Fenton’s reagent prior to biological treatment was investigated. The results showed that COD removal via Fenton’s oxidation was highly dependent on initial MEA concentration with 54.5% COD removal at the highest initial MEA concentration used. Glycine was identified as a degradation by8product in the partially degraded MEA which was observed by HPLC and FTIR techniques. The aerobic biodegradability of partially degraded MEA (after 40% COD degradation by Fenton’s reagent) compared to untreated MEA was investigated using batch mixed8culture experiments to determine the kinetic coefficients for aerobic biological treatment. The results showed that biodegradability of the partially degraded MEA was improved compared to untreated MEA based on the kinetic constants and reduced acclimatization time. Dissolved ammonia was also found to be formed in significant amounts during both Fenton’s oxidation and biological oxidation.
Keywords: Monoethanolamine; MEA, COD; MLSS, biodegradability.
INTRODUCTION
Alkanaolamines have been utilised in both household and industrial applications. In industry, they are extensively employed in natural gas processing plants where CO2and H2S are
removed from natural gas by absorption with an alkanolamine solution such as monoethanolamine (MEA). During shutdown and maintenance of these facilities, high concentrations of residual MEA may be carried over into the wastewater, where they can upset conventional biological treatment systems. In this regard, advanced oxidation processes (AOP’s) have proved to be extremely effective in the degradation of high concentrations of organics which may be difficult to treat in conventional biological treatment. The more common AOP’s use either H2O2 or O3 as the source materials for the generation of strongly oxidizing radicals
such as hydroxyl (HO•) and hydroperoxyl (HO2•) in solution. Ultraviolet radiation or ferrous
sulfate, separately or in combination, is used to initiate the process of generation of the oxidizing radicals. Fenton’s reagent, a mixture of hydrogen peroxide and ferrous sulfate in aqueous solution, has proved to be more effective than UV8H2O2 or UV8O3 for most of the recalcitrant
Fe2+ + H2O2 →Fe3+ + OH8 + •OH (1)
Fe3+ + H2O2 →Fe2+ + H+ + •O2H (2)
The reaction rate is normally controlled by the rate of generation of•OH radicals which in turn depends upon the concentrations of H2O2and FeSO4. A large number of experimental works
on the application of the Fenton’s reagent to treat high8strength waste as a pre8treatment to biological oxidation have been reported in the literature. Alaton and Teksoy [8] studied the effectiveness of Fenton’s reagent to pre8treat acid dye8bath effluent before conventional biological treatment. Gotvajn and Zagorc8Konca [2] combined Fenton’s reagent and biological oxidation for heavily polluted fermentation waste broth. Tekin et. al [4] reported use of Fenton’s reagent to improve the biodegradability of a pharmaceutical wastewater. Solozhenko et al. [7] successfully degraded the contaminants in wastewater from dyeing and finishing industries. Biodegradation of a pharmaceutical wastewater was greatly improved by Fenton’s treatment as reported by Tekin et al. [4] since the breakdown of the organics into smaller fragments makes it amenable to normal biological oxidation.
In a biological treatment system, the biomass growth rate and substrate utilisation rate can be mathematically related to the biomass concentration by the specific growth rate, K and the specific substrate utilisation rate, k, which in turn are dependent on the substrate concentration. In conditions where biomass growth is limited by substrate concentration, the rectangular hyperbolic expression proposed by Monod is widely used to describe the relationship between these specific rates (K and k) to the substrate concentration. Although first developed to describe pure cultures growing on single substrates, it has been shown that the Monod equation can be a reasonable model to describe the growth conditions in a wastewater treatment reactor [10]. Consequently, the Monod equation was chosen in this study to model the biological reaction kinetics.
In this paper, the effectiveness of Fenton’s reagent pretreatment to improve biodegradability of high8strength MEA was investigated and the impact of pretreatment on the biological kinetic constants based on the Monod model were quantified.
MATERIALS AND METHODS
Reagent. Monoethanolamine was obtained from R & M Chemicals, UK; H2O2 and NaOH were
obtained from Systerm, Malaysia; FeSO4,7H2O was obtained from Hamburg Chemicals; H2SO4
was obtained from Malinckrodt and KI from Merck, Germany. COD vials and cuvettes were obtained from Hach. For the mineral medium preparation, potassium dihydrogen orthophosphate, disodium hydrogen orthophosphate dihydrate, ammonium chloride and magnesium sulfate heptahydrate were obtained from Merck. Dipotassium hydrogen orthophosphate and calcium chloride were obtained from Hamburg Chemicals. Iron (III) chloride was obtained from R&M chemicals.
specifications in the Zahn8Wellens/EMPA Test according to the US Environmental Protection Agency (EPA) method OPPTS 835.3200 [12]. Partially degraded MEA and untreated MEA were added in separate reactors to achieve an initial COD of approximately 1000 mg/L and seed bacterial sludge from an activated sludge sewage treatment plant in Universiti Teknologi PETRONAS (Malaysia) was added to the reactors to achieve initial biomass concentration of approximately 100 mg/L MLSS. To ensure sufficient micronutrients and suitable growth conditions, a mineral medium as described in the US EPA Method as mentioned above was added and the pH of the reactor was maintained at 7. Aeration was achieved by bubbling compressed air through the wastewater via perforated plastic tubing. Samples were withdrawn every 6 hours and analysed for COD, NH3, and mixed8liquor suspended solids (MLSS). The
experiment was conducted for a 58day period.
Analysis.The COD of the samples was measured by dichromate digestion method using a block reactor and spectrophotometer (HACH model DR 5000). High8performance liquid chromatography (Agilent) was used to analyse the by8product and unreacted MEA after Fenton’s treatment. YMC8Pack PolymerC18 column was used with 100mM Na2HPO4/100mM NaOH
(60/40, pH 12) as eluent and UV (215 nm and 253nm) as detector. Flow rate of eluent was 1 ml/minute. Infrared spectroscopy (Perkin Elmer Spectrum One FTIR Spectrometer) was used to characterize the by8product functional group after Fenton’s treatment. pH measurement was performed using HACH Sension 1 pH meter. Dissolved ammonia (NH3) was measured using
HACH ammonia ion8selective electrode (ISE). MLSS was measured using a HACH turbidimeter based on this calibration curve prepared using the seed sludge: [MLSS] = 1.0008PTurbidity (NTU) + 14.223, with coefficient of correlation R2= 0.999.
Modeling. The biomass growth rate and substrate utilisation rate are generally described according to equations (3) and (4):
= (3)
= (4)
where X, S, K and k represent the biomass concentration (MLSS, mg/l), substrate concentration (COD, mg/l), specific growth rate (h81) and specific substrate utilisation rate (h81) respectively. The use of dry solids (MLSS) instead of volatile solids (VSS) for biomass estimation can be justified in this case because any increase in solids concentration during the experiment can only be attributed to biomass growth, since inorganic solids precipitation is unlikely and there are no material input after the experiment has begun.
The Monod model describes the relationship between the specific rates and the substrate concentration and is represented by equations (5) and (6) below:
+
= max (5)
+
= max (6)
where Kmaxis the maximum specific growth rate (h81), KS is the half saturation coefficient (mg/l
COD) and kmaxis the maximum substrate utilisation rate (h81). To obtain the kinetic coefficients,
indicated below in equation (7), which adequately describes the lag, acceleration, exponential, declining and stationary phases of biomass growth. A similar form of this equation (with half8 life used instead of the exponential term) has been employed in a previous study to model activated sludge bacterial growth [11]. The best fit was obtained using the Solver tool in Microsoft ® Office Excel 2003 by minimising the residual sum8of8squares.
+ +
= − (7)
From equation (3), the specific growth rate rate could be calculated by dividing the slope of equation (7) with the biomass concentration at each designated time. Then, linear regression was used to fit the linearized form of equation (5) by plotting 1/K vs. 1/S to obtain the values of Kmax
and KS. The biomass yield, YX/S is calculated by dividing the total biomass growth by the
substrate consumed. Finally, the maximum substrate utilisation rate kmax was estimated using
equation (8) [10].
/ max
max = (8)
RESULTS AND DISCUSSION
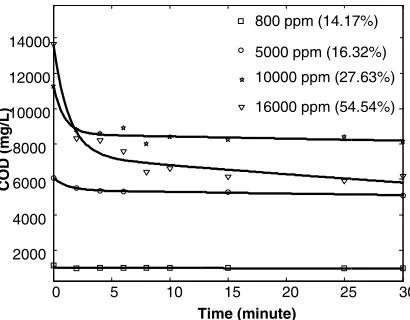
Fenton’s Treatment. The effect of initial MEA concentration on the COD percentage removal by Fenton’s oxidation was studied. Figure 1 shows the results of varying initial MEA concentration, while maintaining constant ratio between MEA, hydrogen peroxide and ferrous sulfate. The pH was maintained at 3 in all experiments. The results indicate that increasing the initial MEA concentration improved the COD percentage removal rate. The highest COD removal (54.5%) was achieved at 16,000 ppm amine concentration with 175 ml of H2O2 at 30%
strength and 8 g FeSO4,7H2O at pH 3. In general, the COD degradation rate is very fast initially
but quickly (in 2810 minutes) reaches a plateau, whereby no further COD reduction occurs. The degradation of MEA by Fenton process shows that, at these conditions, only 54.5% of the COD could be removed even with the theoretical amount of hydrogen peroxide needed.
Figure 1: Degradation of MEA (monoethanolamine) by Fenton’s reagent at different initial MEA concentrations {(800 ppm MEA: 0.4 g FeSO4,7H2O, 9.3ml H2O230%; 5000 ppm
MEA: 2.5 g FeSO4,7H2O, 54.8 ml H2O230%; 10000 ppm MEA: 5 g FeSO4,7H2O, 106.67 ml
H2O230%; and 16000 ppm MEA: 8 g FeSO4,7H2O, 175 ml H2O230%) at pH3.
0 5 10 15 20 25 30
2000 4000 6000 8000 10000 12000 14000
Time (minute)
C
O
D
(
m
g
/L
)
800 ppm (14.17%)
5000 ppm (16.32%)
10000 ppm (27.63%)
Degradation Intermediate. Figure 2 shows the HPLC chromatogram of partially degraded MEA indicating presence of both residual MEA and the degradation intermediate, glycine. The glycine peak appears at approximately 4 minutes, whereas the retention time for MEA is approximately 5.1 minutes.
FTIR spectra (Figure 3) provides information on the functional groups present in the partially degraded MEA. The infrared spectra of glycine and partially degraded amine were found to be similar. In contrast, partially degraded MEA (not shown) exhibited a much simpler mean infrared spectrum. In the partially degraded MEA spectrum, a carbonyl (C = O) peak appears around 1620 cm81[(C = O) as carboxylic acid] and bonding between C and N appears on the center of peak 1080 cm81[(C –N) as aliphatic amine]. The sample was in aqueous solution so that a very broad peak of water (H2O) appears in the region between 3000 – 3700 cm81 and
overlapping many peaks for N – H (amine), O – H (carboxylic acid) and O – H (alcohol) that should appear in that region. In addition, the peak with center 2090 cm81 can be attributed to interaction of COO8 from the carboxylic group and N+from the ammonium group as shown by Silverstein et. al., 2005 [5] and Coates J., 2000 [6]. This would indicate that both the carboxylic group and the ammonium group are present in partially degraded MEA.
Figure 2: HPLC chromatogram of MEA, Glycine and partially degraded MEA
1325
Figure 3: Infrared spectra of partially degraded MEA and glycine.
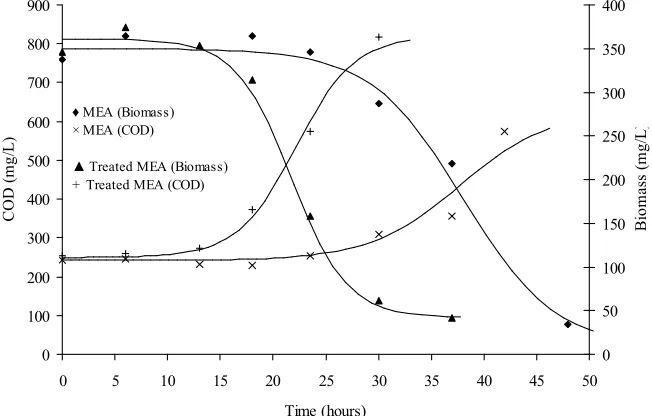
Biodegradation of partially degraded MEA. Partially degraded MEA after about 40% COD removal via Fenton’s oxidation was used to study the biodegradability improvement after
advanced oxidation treatment. The biological oxidation of untreated MEA was done parallelly. The change of biomass and substrate concentration with respect to time for both untreated MEA and partially degraded MEA and their corresponding sigmoid fits are shown in Figure 4. Based on visual inspection of the plots it is clear that biomass acclimatization was much faster in partially degraded compared to untreated MEA as indicated by the duration of the lag phase which was reduced by about 50% from 24 hours to about 12 hours. The duration for maximum COD removal was also reduced from 50 hours in untreated MEA to about 33 hours in partially degraded MEA. However, the ultimate COD removal (substrate utilisation) does not seem to have been affected by Fenton’s oxidation. Nonetheless, the biomass yield appears to be much increased in partially degraded MEA.
0
Figure 4: Biomass and COD evolution for untreated MEA and partially degraded MEA showing both actual data points and fitted curve lines.
The biodegradability improvement is further confirmed by estimation of kinetic constants, which were calculated as described previously. Table 1 shows the estimated kinetic constants for both untreated MEA and partially degraded MEA. The results show improvement in all the kinetic constants i.e. increased maximum specific biomass growth rate, smaller half8 saturation coefficient, larger biomass yield and increased maximum specific substrate utilisation rate for partially degraded MEA compared to untreated MEA.
Table 1
Estimated biological kinetic coefficients for untreated MEA and partially degraded MEA. ?max(h@1) KS(mg/l COD) YX/S kmax(h@1)
Untreated MEA 0.14 691 0.223 0.63
Partially
The result of this study agrees with Tekin H et. al. [4] and Gotvajn Z G and Zogorc8Koncan J [2] who reported that after Fenton’s oxidation, the organic compound would break into smaller fragments resulting in improved biodegradability.
Since MEA contains the elements C, H, O and N, oxidation of MEA by hydroxyl radical
•
OH is expected to transform the organic nitrogen into NH4+, NO28 and NO38. M. Klare et al [3]
presented a possible mechanism of amine degradation by hydroxyl radical which identified NH3
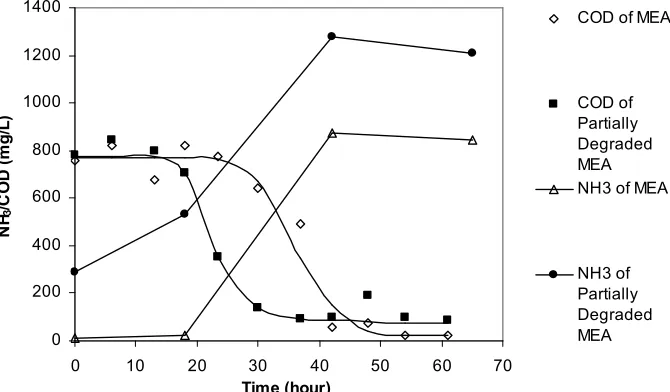
as a product in partially degraded MEA. Figure 4 shows the profile of dissolved ammonia as biodegradation proceeds. About 300 mg/L of NH3 is present in the partially degraded MEA
initially compared to negligible amounts in the untreated MEA. As biological oxidation proceeds, the concentration of ammonia increases in both untreated and pretreated MEA with higher final dissolved ammonia content in the pretreated MEA (1200 mg/l) compared to untreated MEA (800 mg/l). This means that with initial COD of approximately 1300 mg/l, degradation of MEA via Fenton’s and biological oxidation generated at least 1200 mg/l of dissolved ammonia. These results show that dissolved ammonia is produced in substantial amounts both during Fenton’s oxidation and during aerobic biological oxidation.
0 200 400 600 800 1000 1200 1400
0 10 20 30 40 50 60 70
!"
#
$
!%
COD of MEA
COD of Partially Degraded MEA NH3 of MEA
NH3 of Partially Degraded MEA
Figure 4: COD degradation compared with NH3profile for MEA and Partially Degraded
MEA by biological oxidation.
CONCLUSIONS
Fenton’s reagent is able to rapidly reduce the COD of an alkanolamine, MEA, to a certain level after which no further COD reduction occurs. The percentage COD removal increases as the initial MEA concentration increases provided the dosing ratios for Fenton’s reagent are maintained. At the maximum initial MEA concentration used in this study, Fenton’s oxidation was able to reduce the COD by 54.5%.
Glycine was identified as a reaction intermediate in Fenton’s oxidation using HPLC and FTIR. It was also shown in this study that dissolved ammonia was formed in significant quantities both during Fenton’s oxidation as well as biological oxidation.
improved after Fenton’s oxidation. Therefore, it was shown that Fenton’s oxidation was able to not only reduce the COD but also improve the biodegradability of MEA. In conclusion, Fenton’s oxidation has a strong potential to be an effective pre8treatment method before conventional biological treatment for the abatement of wastewater polluted with MEA.
ACKNOWLEDGEMENT
Financial assistance for this study was provided by Universiti Teknologi Petronas, Malaysia in the form of a STIRF project.
REFERENCES
[1] Metcalf and Eddy, 1991. ! " # #, 3rdedition, McGraw8Hill, New York, USA.
[2] Gotvajn Z. G. and Zogorc8Koncan J (2005), $ % #
&' ( ) * + $ ! % ,, Acta Chim. Slov.
2005, 52, 1318137.
[3] Klare M. et al. (2000), - # !, . , . ( & .
* /( & . !! ! 0, ! !, Chemosphere 41 (2000) 3538362.
[4] Tekin H. et al. (2006), 1! $ ' 0 , #
0, + " ! " , J. Hazard. Mater., B136, 2588165.
[5] Silverstein et al. (2005), 0 & # 0 + !, 7th edition ,Jonh Wiley and Sons, Inc, page 72 – 126.
[6] Coates J. (2000), 0 0 2 3 * 300 ,, Encyclopedia of Analytical Chemistry, R.A. Meyers (Ed) pp. 10815 – 10837.
[7] Solozhenko E. G. et al. (1995), - 4 4 ! + ! $ 5! ' , Water Res., 29, No 9, 220682210.
[8] Alanton I. A. and Teksoy S. (2007), 3 , + 0 +! # $ 5!
# 6 0 !! 0 4 2 ! ! + ' 2 Dyes &
Pigments,78, 31839.
[9] Walling, C. (1975),$ # ! , Accounts Che. Res., , No 5, 1258131.
[10] Orhon D. and Artan N. (1994), 9 # 3 + # ! !, Technomic, Basel, Switzerland, 1118122.
[11] Cabrero A. et al. (1998), ! 00 4 , ! + # # " , !2Wat. Res., Vol. 32 (5) 135581362.