Full Length Research Paper
Applying the Taguchi method for optimized fabrication
of bovine serum albumin (BSA) nanoparticles as drug
delivery vehicles
Mohsen Jahanshahi*, Ghasem Najafpour and Mostafa Rahimnejad
Nanobiotechnology Research Lab., School of Chemical Engineering, Babol University of Technology, Po.Box: 484, Babol, Iran.
Accepted 11 January, 2008
The objective of the present study was to optimize the fabrication of bovine serum albumin (BSA) nanoparticle by applying the Taguchi method with characterization of the nanoparticle bioproducts. BSA nanoparticles have been extensively studied in our previous works as suitable carrier for drug delivery, since they are biodegradable, non-toxic and non antigenic. A statistical experimental design method (Taguchi method with L16 orthogonal array robust design) was implemented to optimize experimental conditions of the purpose. Agitation speed, initial BSA concentration, pH and temperature were considered as process parameters to be optimized. As the result of Taguchi analysis in this study, temperature and agitation speed were the most influencing parameters on the particle size. The minimum size of nanoparticles (~74 nm) were obtained at 4°C, pH 7.5, 15 mg ml-1 BSA concentration and agitation speed of 500 rpm. As for characterization of the products, Atomic Force microscopy (AFM), Scanning Electron microscopy (SEM) and Sodium Dodecyl Sulphate- Poly Acrylamide Gel Electrophoresis (SDS-PAGE) as well as Fourier Transform Infra-Red (FTIR) techniques were employed.
Key words: Bovine serum albumin, nanoparticles, optimization, Taguchi method, coacervation, atomic Force microscopy.
INTRODUCTION
Over the past few decades, there has been considerable interest in developing biodegradable nanoparticle (liposome, virus like particle (VLP), protein, etc) as effec-tive drug delivery devices (kumaresh et al., 2001). Nanoparticles of biodegradable polymers can provide a way of sustained, controlled and targeted drug delivery to improve the therapeutic effects and reduce the side effects of the formulated drugs (Couvreur et al., 2006). An important advantage associated with the use of the nanoparticles includes the ease of their preparation from well-understood biodegradable polymers and their high stability in biological fluids and during storage (Mua and Seowc, 2006).
The body distribution of colloidal drug delivery systems is mainly influenced by two physicochemical properties,
*Corresponding author. E-mail: [email protected], [email protected]. Fax: +98(0)1113220342.
particle size and surface characteristics (Langer et al., 2003). Liposomes have been used as potential drug carriers but limited due to inherent problems such as low encapsulation efficiency, rapid leakage of water-soluble and poor storage stability. On the other hand, protein nanoparticles offer some specific advantages over them. For instance, nanoparticles help to increase the stability of drugs and possess useful controlled released proper-ties (kumaresh et al., 2001). Protein nanoparticles gene-rally vary in size from 50-300 nm (Langer et al., 2003) and they hold certain advantages over the other drug delivery systems such as greater stability during storage, stability in vivo, non-toxicity, non-antigen (Lin et al., 1994) and ease to scale up during manufacture (Jahanshahi et al., 2004; Coester et al., 2006). According to the literature, albumin nanoparticles have been selected for many research topics (Muller et al., 1996; Arnedo et al., 2004) due to its properties (Davis and Illum, 1986; Weber et al., 2000; Jahanshahi et al., 2003).
such nanoparticles are carried out namely emulsion for-mation, desolvation and coacervation (Langer et al., 2003). The coacervation method also has been success-fully employed to produce nanoparticles in our previous study as well (Kruif et al., 2004; Rahimnejad et al., 2006). The properties of BSA nanoparticles fabricated by this method are affected by various parameters such as initial protein concentration, temperature, pH, glutaraldehyde concentration (cross linker), agitation speed, molar ratio of BSA/ethanol and organic solvent adding rate. The interrelationships between the mentioned parameters are complex, and therefore the analysis of this system for optimizing the factors is a time and labor consuming work.
The efficient analyses of this complex system using statistical experimental design (Yang et al., 2001) and the Taguchi method (Liu et al., 2001; Park et al., 2002) have been performed recently. The statistical experimental design can determine the effect of the factors on charac-teristic properties and the optimal conditions of the factors. It uses the tables of orthogonal arrays and analysis of variance (ANOVA) which can estimate the effect of a factor on the characteristic properties. Conven-tional statistical experimental design can determine the optimum condition on the basis of the measured values of the characteristic properties; while Taguchi’s experi-mental design (also known as a robust parameter design) does this on the basis of the variability of characteristic properties. In other words, the Taguchi method can determine the experimental condition having the least variability as the optimum condition (Kim et al., 2005).
In this work, simple coacervation method is used for manufacturing of BSA nanoparticles as a colloidal drug delivery system and the essential parameters were considered. The objective of the present study is the optimization for the preparation of BSA-based nanoparti-cles by the Taguchi design method which show a controllable particle diameter under 100 nm and a narrow size distribution (Jahanshahi et al., 2005b). In addition, the purification of nanoparticles bioproducts was evalua-ted by Sodium Dodecyl Sulphate Poly Acrylamide Gel Electrophoresis (SDS-PAGE) and Fourier Transform Infra-Red (FTIR) techniques, while Atomic Force micros-copy (AFM) and Scanning Electron microsmicros-copy (SEM) were used to characterize the shape and morphology of the products. This study is intended to establish a rational basis for the controlled production and application of protein-based nanoparticles as drug carrier systems.
MATERIALS AND METHODS Reagent and chemicals
BSA (fraction V, purity 98%), Tween-20, ethanolamine and glutaral-dehyde, 25% solution, were commercially supplied by Sigma Aldrich. Sodium aside and all other chemicals were purchased from Merck (Darmstadt, Germany); they were of analytical grade and used as received.
Preparation of BSA nanoparticle
BSA nanoparticles were prepared by a simple coacervation process and cross linked with glutaraldehyde as described previously (Mohanty and Bohidar, 2003; Lazko et al., 2004; Jahanshahi et al., 2005a). Briefly, nanoparticles were obtained by the addition of etha-nol drop-wise to aqueous solution of BSA and adjusted to pH 7.5. Coacervates thus obtained were then hardened with glutaradehyde 25%. Ethanolamine and Tween-20 were added at a final concen-tration to block the non-reacted aldehyde functional group and stabilize the preparation, respectively. Large aggregates were eliminated by centrifuge. The supernatant was dialyzed and subsequently micro and ultra-filtrated. The concentration of BSA was determined with Coomassie Blue reagent (Weber et al., 2000).
Nanoparticles physical characterisation
The morphologies of the BSA nanoparticles were observed by AFM (Philips, class 11 Laser productions, Netherland) at 600 - 700 nm wave length. Surface profiles were generated from AFM raw data by the SISCANPro software (vs. 1.3, Surface Imaging Systems).
For taking image with SEM, 50 µl of the nanoparticle preparation were freeze dried (Emithech; model IK750, UK) on a polished aluminium surface. After drying, the sample was sputtered with gold for 30 s by Polaron machine (BAL-TEC, model SCDOOS, Switzer-land). Afterwards, SEM was performed using a Sterescan S 360 Brand SEM-Leica (Cambridge, UK) with the upper detector at 15 kV. The magnification was set to 65,000. The tilt of the sample plate was adjusted to 20º.
The particle size of the resulting nanoparticles was determined by photon correlation spectroscopy (PCS) (Zetasizer 3000, Malvern Instruments, UK) with a He–Ne laser beam at a wavelength of 633 nm (scattering angle of 908). The software data analysis for calcu-lation of the size distribution of the nanoparticle samples was based on the fitting method of non-negative constrained least-squares (NNLS). The measurements were carried out after 1 h of incubation of the BSA. Photon correlation spectroscopy (PCS) determines the average particle size and Polydispersity Index (PI) which is a range of measurement of the particle sizes within measured samples. The accurate measurement of particle size must be blow 0.7 (70%).
Nanoparticle (bio)chemical characterization
SDS-PAGE was used to analyze and compare the protein composi-tion profiles for specific sample. A 20 ml medium was mixed with SDS sample buffer. The samples and rainbow molecular weight markers (7.5 – 199 kDa) were loaded into a 5% stacking gel, set up on a 10% resolving gel. Since the pore size of poly acrylamide is limited, proteins higher than 800 kDa cannot permeate into the gel. An acrylamide concentration of 10% has been selected to enable optimal resolution for the soluble proteins. The molecular weight markers and protein samples were separated by SDS–PAGE using a running buffer. The resulting bands were stained using Coomas-sie blue stain (0.1%) and photographed using a Syngene transilluminator with white light and imaging software (Syngene, Synoptics Group, Cambridge, UK).
The molecular structure of BSA nanoparticles was investigated by FTIR Spectroscopy (Perkin Elemer instruments (LLs), UK). The samples for FTIR analysis were prepared by grinding 99% KBr with 1% nanoparticles and then pressing the mixture into a transparent tablet. Phasmatophotometer was employed and fourier nanoparticle samples were scanned at the IR range (450-5000 cm-1). Detector
Table 1. Parameters and levels used in this experiment.
Data analysis
In our previous work, the one factor at a time was applied (Jahanshahi et al., 2004; Rahimnejad et al., 2006). It has been concluded that four important factor including agitation speed, concentration of initial BSA, pH and temperature affect nanoparticle size. Therefore in order to minimize the number of experiments, Automatic Design and Analysis of Taguchi Experiments were employed through Qualitek software (version IV). Taguchi’s ortho-gonal array table was used by choosing these four parameters that could affect the particle size. Table 1 shows the parameters and levels used in this experiment. The fractional factorial design reduc-ed the number of experiments to sixteen instead of other methods such as factorial experimental method. The orthogonal array of L16
type was used. L and subscript 16 means Latin square and the number of experiment, respectively. Each experiment was carried out in twice.
RESULTS AND DISCUSSION
Physical characteristics of BSA nanoparticles
Simple coacervation process of BSA nanoparticle was evaluated based on the particle size. The particle sizes as well as the light intensity counts of the samples were determined by photon correlation spectroscopy (PCS) for all the experiments. For determining the nanoparticles properties (morphology and purification), the samples were selected randomly and the results were repeatable.
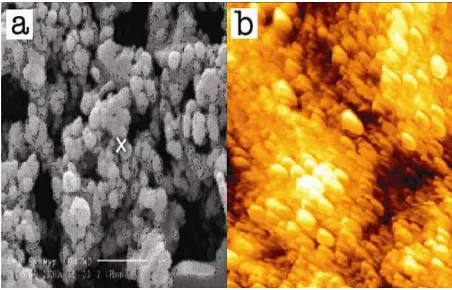
Figure 1a shows the SEM image of the nanoroparticles. It was clear that the most of the morphologies of the resulting protein nanoparticles were semispheres with a diameter between 100 and 200 nm. AFM technique has been widely applied to provide surface and morphological information on nanometer scale. The images of the shape and surface characteristic of the nanoparticles were obtained successfully by AFM (Figure 1b). It was shown that the produced nanoparticles were almost form-ed by a smooth surface. Basform-ed on these characteristics, BSA nanoparticles were good enough to be candidate for loading drugs on/in them.
Analysis of the BSA nanoparticles purification
The gel electrophoresis SDS-PAGE was formed to analyze and compare the purity of the prepared nano-particles with pure BSA. Figure 2 represents the gel electrophoresis of pure BSA and the nanoparticles pre-
Figure 1. a) SEM image of BSA nanoparticle. The scale bar represent 1 m. b) AFM image of BSA nanoparticles. The smooth surface can be understood from the picture.
pared from BSA. The protein bands show that the nano-particles were pure and the strips clearly demonstrate highly purity of the product.
The molecular structure of the resulting BSA nano-particles was also characterized by FTIR. Figure 3 shows the FTIR spectroscopy of nanoparticles comprising pure BSA, BSA nanoparticles without purification in contrast with purified BSA nanoparticles. The analyzed sample was prepared at the general condition (pH 7, 24ºC, 5 mg/ml BSA concentration and 200 rpm agitation). It is clear from the graph that at the specific range of the wavelength (4000 to nearly 1500 cm-1), the purification of BSA nanoparticles was well accomplished. The other ranges of wavelength were not acceptable.
Taguchi array design and analysis of variance
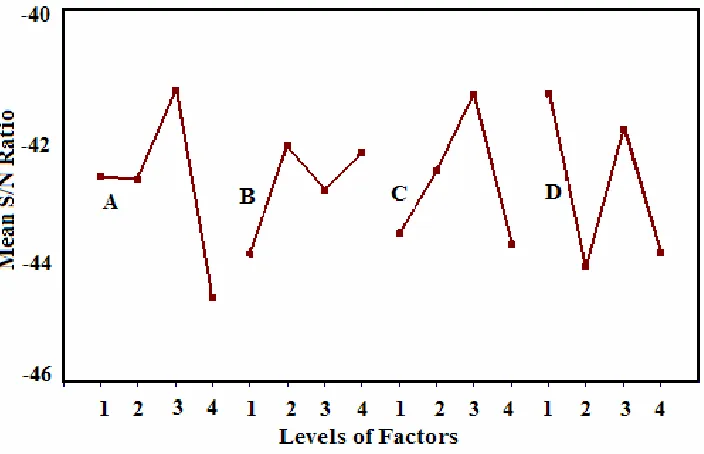
A Taguchi orthogonal array design was used to identify the optimal conditions and to select the parameters hav-ing the most principal influence on the particle size of BSA nanoparticles. Table 2 shows the structure of Taguchi’s orthogonal array design and the results of measurement by PCS. The variance of the particle size in Table 2 (analysis of variance) was calculated, and the results are shown in Table 3. The purpose of the analysis of variance (ANOVA) is to investigate the factors which significantly affect the quality characteristic.
Determination of optimal conditions using Taguchi method
The optimum conditions can be determined through the response table of the ANOVA-TM software. The level average graph of the raw data is illustrated in Figure 4. The average S/N ratio of each control factor at each level and the range of S/N ratio of each factor were deter-mined. Figure 4 shows the response graph of S/N ratio for analysis of nanoparticle size. The greatest variation of
Factor Level
A: Agitation speed (rpm) 200 400 500 600 B: BSA concentration (mg/ml) 5 15 20 30
C: pH 6 7 7.5 8
Figure 2. Gel electrophoresis of the BSA nanoparticles.
Figure 3. FTIR analysis of BSA nanoparticle.
Table 2. Experimental measured values for particle size of BSA nanoparticles and S/N ratio (Taguchi orthogonal array Table of L16).
Particle size (nm) Exp. No. Experimental conditions 1st run 2nd run Average
S/N Ratio (dB)
1 1 1 1 1 162.0 141.8 151.9 -43.65
2 1 2 2 2 150.0 146.3 148.1 -43.41
3 1 3 3 3 94.0 101.0 97.5 -39.78
4 1 4 4 4 144.7 170.0 157.3 -43.96
5 2 1 2 3 136.6 134.0 135.3 -42.62
6 2 2 1 4 143.8 150.0 146.9 -43.34
7 2 3 4 1 148.2 118.0 133.1 -42.54
8 2 4 3 2 130.0 139.0 134.5 -42.58
9 3 1 3 4 126.4 134.0 130.2 -42.29
10 3 2 4 3 116.9 115.0 115.9 -41.28
11 3 3 1 2 148.0 142.0 145.0 -43.23
12 3 4 2 1 85.0 82.0 83.5 -38.43
13 4 1 4 2 217.0 250.0 233.5 -47.38
14 4 2 3 1 112.4 106.9 109.6 -40.80
15 4 3 2 4 206.3 198.4 202.3 -46.12
16 4 4 1 3 168.0 158.0 163.0 -44.24
S/N ratio in the temperature reveals that it has the most important influence on the particle diameter. The agitation
Table 3. The ANOVA table of particle size.
No. Factors
Degree of freedom
Sums of
Squares Variance F-Ratio Percent
1 Agitation speed 3 22.433 7.477 6.845* 26.609
2 BSA Concentration 3 7.665 2.555 2.339 6.095
3 pH 3 14.962 4.987 4.565 16.231
4 Temperature 3 23.654 7.884 7.218* 28.305
Error 3 3.276 1.092 22.76
Total 15 71.993 100.00%
*Main significant parameter.
Figure 4. Response graph of S /N ratio for smaller-the-better analysis of nanoparticle size.
Table 4. Results of the confirmation experiment for particle size.
Method Level Particle size (nm) S/N ratio (dB)
Predicted A3B2C3D1 76.67 -37.70
Experimental A3B2C3D1 74.35 -36.05
From Table 3 and Figure 4, it can be deduced that the temperature and agitation speed are the significant parameters for affecting the size while the pH and initial BSA concentration had insignificant effects on the results. Therefore, based on the S/N and ANOVA analyses, the optimal parameters for nanoparticle size are the tempe-rature at level 1, the agitation speed at level 3, initial BSA concentration at level 2 and the pH at level 3.
Table 4 shows the comparison of the predicted particle size and particle size distribution with the experimental results using the optimal conditions. There is good agree-ment between the predicted and experiagree-mental particle
size being observed. The increase of the S/N ratio from the no. 12 (−38.43) as shown in Table 2 to the optimal actual data (−36.05) is 2.38 dB, which means that the particle size is decreased by about 0.89 times. In general, it can be concluded that the particle size in the fabrication of BSA nanoparticle can be decreased through the Taguchi method approach.
Conclusion
ploiting robust process of coacervation. Physical and (bio)chemical characterization of the nanoparticles were determined by SEM, AFM, SDS-PAGE and FTIR techniques. According to the literature, the results demonstrated that produced nanoparticles have sufficient properties as a carrier for drug delivery systems. Here, Taguchi design method was used to optimize the para-meter values for obtaining desired characteristics.
Various factors affecting the particle size were analyz-ed and optimizanalyz-ed. Agitation speanalyz-ed and temperature have been shown to be highly influential upon the mean size of fabricated nanoparticle. By optimal conditions (at 500 pm agitating, 4°C temperature, pH 7.5 and 15 mg ml-1 BSA concentration) of this method, BSA nanoparticles (~74 nm) with narrow particle size distribution were prepared and these results are in good agreement with data ana-lyzed by Taguchi method. To the best of our knowledge, the current study is one of the first to have demonstrated optimized fabrication of protein nanoparticles. Loading the drug on these nanoparticles will be the next step of the work and subject of further publication.
ACKNOWLEDGEMENTS
The authors would like to gratefully acknowledge members of the Nanobiotechnology Research Laboratory of Babol University of Technology, Iran. Special thanks go to Ms. Solmaz Hajizadeh for productive discussion during the preparation of this manuscript.
REFERENCES
Arnedo A, Espuelas S, Irache JM (2004). Albumin nanoparticle as carriers for a phosphodiester oligonucleotide. Int. J. Pharm, 244: 59-72.
Coester C, Nayyar P, Samuel J (2006). In vitro uptake of gelatin nanoparticles by murine dendritic cells and their intracellular localization.Eur. J. Pharm. Biopharm. 62: 306-314.
Couvreur P, Gref R, Andrieux K, Malvy C, (2006). Nanotechnologies for drug delivery: Application to cancer and autoimmune diseases. Prog. Solid State Chem. 34: 231-235.
Davis SS, Illum L (1986). Colloidal delivery systems, opportunities and challenges. Linson ET, Davis SS (Ed.), Site-specific Drug Delivery: cell Biology, Medical and pharmaceutical Aspects, John Wiley & Sons, Chichester, pp. 931-93.
Jahanshahi M, Pacek AW, Nienow AW, Lyddiatt A (2003). Fabrication by three-phase emulsification of pellicular adsorbent customized for liquid fluidized bed adsorption products. J. Chem. Technol. Biotechnol. 78: 1111-1120.
Jahanshahi M, Williams S, Lyddiatt A, Shojaosadati SA (2004). Preparation and purification of synthetic protein nanoparticulates. J. IEE Proc-Nanobiotechnol., 151 (5): 176-182.
Jahanshahi M, Zhang Z, Lyddiatt A (2005a). Subtractive chroma-tography for purification and recovery of Nano-bioproducts. J. IEE Proc-Nanobiotechnol. 152(3): 121-126.
Jahanshahi M, Aghajani H, Ling TC (2005b). Assembly &purification of nanostructure bioproducts: protein nanoparticle characterization and non-stick exterior coating adsorbents .Int. J. Nanosci. Nanotechnol. 1: 9-20.
Kruif CG, Weinbreck F, Vries R (2004). Complex coacervation of protein and anionic polysaccharides. Curr. Opin. Colloid Interface Sci. 9: 340-349.
kumaresh SS, Tejraj MA, Anandrao RK, Walter ER (2001). Biodegradable polymeric nanoparticles as drug delivery devices. J. Contr. Release 70: 1-20.
Kim KD, Soon HK, Hee TK (2005). Applying the Taguchi method to the optimization for the synthesis of TiO2 nanoparticles by hydrolysis of TEOT in micelles. Colloids and Surf. A: Physicochem. Eng. Aspects, 254: 99-105.
Langer K, Balthasar S, Vogel V, Dinauer N, Von Briesen H, Schubert D (2003). Optimization of the preparation process for human serum albumin (HSA) nanoparticle. Int. J. Pharm. 257: 169-180.
Lazko J, Popineau Y, Legrand J (2004). Soy glycine microcapsules by simple coacervation method”, Colloids Surf. B: Biointerfaces., 37: 1-8. Lin W, Coombes GA, Garnett C, Davies C, Schacht E, Davis S, Illun L (1994). Preparation of sterically stabilized human serum albumin nanosphere using a novel dextranox-MPEG crosslinking agent. Pharm. Res. 11: 1588-1592.
Liu JM, Lu PY, Weng WK (2001). Studies on modifications of ITO surfaces in OLED devices by Taguchi methods. Mater. Sci. Eng. B, 85: 209-221.
Mohanty B, Bohidar HB (2003). Systematic of alcohol-induced simple coacervation in aqueous gelatin solutions. Biomarcromolecules., 4: 1080-1086.
Mua.L, Seowc PH (2006). Application of TPGS in polymeric nanoparticulate drug delivery system. Colloids Surf. B: Biointerfaces. 47: 90-97.
Muller B, Leuenberger H, Kissel T (1996). Albumin nanospheres as carriers for passive drug targeting: an optimized manufacturing technique. Pharm. Res., 13(1): 32-37.
Park SK, Kim KD, Kim HT (2002). Preparation of silica nanoparticles: determination of the optimal synthesis conditions for small and uniform particles. Colloids Surf. A: Physicochem. Eng. Aspects, 197: 7-17.
Rahimnejad M, Jahanshahi M, Najafpour GD (2006). Production of Biological Nanoparticles from Bovine Serum Albumin for Drug Delivery. Afr. J. Biotechnol. 5(20): 1918-1923.
Weber C, Coester C, Kreuter J, Langer K (2000). Desolvation process and surface characterization of protein nanoparticles.Int. J. Pharm., 194: 91-102.
Yang RD, Mather RR, Fortheringham AF (2001). The Application of Factorial Experimental Design to the Processing of Polypropylene Fibres . J. Mater. Sci. 36: 3097-3101.