POTENTIAL
HABITAT AND SPATIAL DISTRIBUTION OF ANOA
(
Bubalus
spp
.
)
IN LORE LINDU NATIONAL PARK
BENI OKARDA
GRADUATE SCHOOL
BOGOR AGRICULTURAL UNIVERSITY BOGOR
STATEMENT
I, Beni Okarda, hereby stated that this thesis entitled:
Potential Habitat and Spatial Distribution of Anoa (Bubalus spp.) in Lore
Lindu National Park
Is a result of my own work research during the period of April 2008 to October
2009 and has not been published before in any form for another diploma,
under-graduate, nor post graduate degree to any University or other institutions. The
content of the thesis has been examined by the advising committee and external
examiner
Bogor, February 2010
ABSTRACT
BENI OKARDA (2010). Potential Habitat and Spatial Distribution of Anoa (Bubalus spp.) in Lore Lindu National Park. Under supervision of TANIA JUNE
and ABDUL HARIS MUSTARI.
Anoa (Bubalus spp.) is endemic to Indonesian islands of Sulawesi and Buton. These mammals are divided into two species: Mountain Anoa (Bubalus quarlesi) and Lowland Anoa (Bubalus depressicornis). Both live in undisturbed rainforest and avoid direct contact with human. This animal has been classified into endangered species by International Union of Conservation for Nature (IUCN), Convention on International Trade in Endangered Species (CITES) and fully protected under Indonesian Law. Threat for Anoa is coming from illegal hunting and habitat degradation. Habitat loss or degradation caused by agriculture wood plantations, infrastructure development, and human settlement reported as serious threat for Anoa population by IUCN. This research aims to
develop Anoa habitat suitability model using logistic regression and analyze ecological factors in Anoa’s habitat preference. Approximately 2,300 hectare research area in Toro village, Lore Lindu National Park has been analyzed in generated Anoa habitat suitability model.
Logistic regression GIS coupled model use to predict Anoa habitat suitability in Lore Lindu National Park. Anoa presence and absence data were obtained from field survey while environmental variable used in model were taken from GIS data layer and remote sensing data. Environmental variable were consists of elevation, slope, distance from river, distance from settlement and distance from forest edge. Vegetation analysis also conducted in place where Anoa found.
result also indicating there are human activities inside national park that force Anoa to move deeply to undisturbed forest area.
From vegetation analysis result, 25 species from 14 families Anoa feed vegetation were found in sampling plot. Pinanga caessia Blume, Alpinia sp.,
Cyathea contamminans, Frecynetia insignis Blume, Syzygium accuminatissima,
and Lythocarpus celebicus were dominated. Dominant feed vegetation indicated
the feed supply still can meet Anoa demand.
From morphological characteristic, two from five samples collected inside and around study area shown the characteristic of Lowland Anoa. The fact that inside and around study area is mountainous area has derive to possibility that Lowland Anoa has moving into mountainous area because pressure from human activities in lowland area around national park.
SUMMARY
Indonesian tropical forest is widely known over the world which having high value in biodiversity. World Resources Institute and Forest Watch Indonesia (2002) assert that tropical forest in Indonesia is a home for 11 percent of the world’s plant species, 10 percent of its mammal species, and 16 percent of its bird species. With this number of biodiversity value, Indonesia is ranked as the third richest in biological diversity after Brazil and the Democratic Republic of Congo. It also states that the forest types of Indonesia are diverse from evergreen lowland dipterocarp forests in Sumatra and Kalimantan to seasonal monsoon forests and also savanna grasslands in Nusa Tenggara and non-dipterocarp lowland forests and alpine areas in Irian Jaya (sometimes referred to as Papua). Many islands have been isolated for millennia, so levels of endemism are high. From 429 locally endemic bird species, for example, 251 are unique to a single island. Most of Indonesia’s insects are also endemic, with many genera confined to individual mountain tops.
Anoa (Bubalus spp.) is endemic to Sulawesi and Buton Island, Indonesia. These mammals are divided into two species: Mountain Anoa (Bubalus quarlesi) and Lowland Anoa (Bubalus depressicornis). Both species live in undisturbed rainforest condition and often avoid the direct contact with human. Lowland Anoa (B. depressicornis) and Mountain Anoa (B. quarlesi) are classified as endangered [C1+2a] by the International Union for Conservation of Nature (2004), and listed on Convention on International Trade in Endangered Species Appendix I (CITES, 2005). Bubalus spp. are fully protected under Indonesian law, although enforcement is difficult. IUCN (2004) explains that the total population of B. quarlesi is unlikely to be more than 3,000–5,000 animals, with the number of mature individuals likely to be less than 2,500.
Anoa is coming from habitat degradation. Habitat loss or degradation caused by agriculture activity, infrastructure development, and human settlement has reported as serious threat for Anoa (IUCN, 2004).
Ministry of Forestry (2008) reported deforestation in Indonesia reach 1.17 million hectare per year between 2003 to 2006. In this report also include deforestation in protected area reach 55.6 thousand hectare per year or 4.75% from total deforestation in Indonesia. Central Sulawesi province classified as high deforestation in protected area with deforestation reach up to 9.2 thousand hectare per year.
There still inadequate research about Anoa species distribution and habitat which might affected in planning national park zone management. Species and habitat distribution will give important information in planning and monitoring the species and habitat condition. This research aims to develop Anoa habitat suitability model using logistic regression and analyze ecological factors in Anoa habitat preference.
The field work was taken place in primary forest around Toro village in Lore Lindu National Park, Indonesia. The study area located in 120o2’53” – 120o7’44”E and 1o27’3” – 1o30’51”S. This area administratively is part of Toro Village, Sub District of Kulawi Central Sulawesi Province. Study area was approximately taken 2,300 Ha of Lore Lindu national park area with 1,151 Ha sampling area and 1,149 Ha accuracy assessment area. From data observation, study area has altitude range from 814 meter above sea level in Toro Village settlement area up to 2173 meter above sea level in top of mountain with various slopes from 0 up to 62 percent. Lore Lindu is tropical rainforest with high humidity with temperatures vary from 26-32 oC. High altitude areas are significantly cooler with temperature drops 6 oC every 1100 m. The annual rainfall in Lore Lindu National Park varies between 2000 – 4000 mm per year with heaviest rain periods between November to April.
This research was funded by BMZ and STORMA program. STORMA (Stability of Rainforest Margin in Indonesia) is an Indonesian-German collaborative Research Centre funded by the German Research Foundation (DFG).
The environmental variables are the predictor in determining habitat suitability based on species occurrence and viability. Sugiharta (1994) explain Anoa inhabit in undisturbed mountainous rainforest with hilly landscape. In behavioral aspect, Anoa tends to avoid direct contact with human or approaching human activity area like village. Observations of tracks indicate that Mountain Anoa travel singly or in pairs, but never associate in larger groups. A pair of Mountain Anoa is most likely to be comprised of a mother and her offspring, or an adult male and female (Sugiharta, 1994). However, Whitten et al. (1987) reported a herd of five animals on Mount Nokilalaki running past his expedition.
Table. 1. Environmental Variables
Abbreviation Description Unit
ALT SLO DTR DTS DTFE Altitude Slope
Distance to River Distance to Settlement Distance to Forest Edge
Meter Above Sea Level Degree
Meter Meter Meter
The variables collected for the model is topographic factor include altitude (ALT) and slope (SLO), proximity of water resources (DTR) and proximity of human activity area (DTS and DTFE) for predicting the suitable habitat of Anoa.(Table. 1).
use 100 meter grid square that considered as observation unit for each parameter variable which use in generate the model in statistical analysis. Image processing and topographical analysis were conducted using ERDAS Imagine (Leica Geosystems, Norcross, GA, USA). Spatial analysis and spatial layer input were performed using ArcGIS (ESRI, Redlands, CA, USA) and Hawth Tools extension (Beyer, 2004)
The analysis of species and environment relationship has always been increased and turning into wide variety of statistical analysis including logistic regression (Pereira and Itami, 1991; Osborne and Tigar, 1992; Walker, 1990; Rodriguez, 1997). Austin (2002) explains there are three major components in any framework for statistical modeling in ecology. There needs to be an ecological model, a data model, and a statistical model. The ecological model consists of the ecological knowledge and theory to be used or tested in the study. The data model consists of the decisions made regarding how the data are collected and how the data will be measured or estimated. The statistical model involves the choice of statistical method, error function and significance tests. Each model interacts in both obvious and subtle ways with the other models to determine the success of any statistical modelling exercise. Robertson et al. in 2000 attempted to determine whether correlative models could perform as well as mechanistic models for predicting species potential distributions, using a case study. The profile technique was based on principal components analysis (PCA) and the group-discrimination technique was based on multiple logistic regressions (LR). The result of that study conclude that, using the scale of agreement proposed by Monserud and Leemans (1992), the Kappa Statistics indicated “very good” agreement for the PCA and “excellent” agreement for the SWB model and “perfect” agreement for the LR model.
derived map. To assess fit and relative strength of the selected model, we used the Hosmer and Lemeshow goodness of fit test and Nagelkerke’s rescaled R2 respectively. The probabilities from the logistic regression were derived a predictive habitat map from the significant habitat characteristics across the landscape at threshold values. The results of the regression produced variable coefficients then applied to the area and the entire study area ranging from 0 to 1, where values greater than 0.5 were considered to be suitable for Anoa.
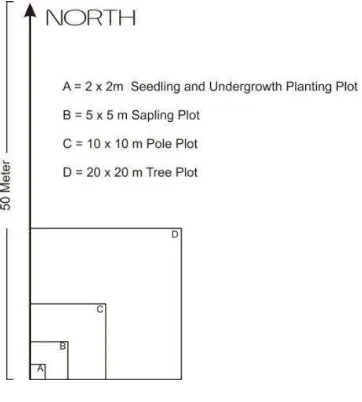
In order to get detailed information about structure and composition of vegetation in Anoa presence location, we conducted Vegetation Analysis method using Purposive Random Sampling. By knowing the structure and composition in each land cover class, it will describe the vegetation condition which might have specific characteristic. In vegetation analysis we use line transect method to distribute nested plots for vegetation analysis. In line transect method the plants are classified into tree (woody plants which has diameter at breast high more than 20 cm), poles (woody plants which has diameter at breast high from 10 to 20 cm), sapling (woody plants which has diameter at breast less than 10 cm and height more than 1.5 meter), seedling (woody plants with height up to 1.5 meter), and undergrowth plant like herbs, ferns, liana, and grasses. The plot sizes in vegetation analysis are 20 x 20 m for trees, 10 x 10 m for poles, 5 x 5 m for sapling and 2 x 2 m for seedling and undergrowth plant.
Table.2. Anoa Presence Sign
SIGN ALT SLO DTR DTS DTFE
Min Max Min Max Min Max Min Max Min Max
Foot Print Feces Shelter Horn 1,478 1,539 1,482 1,981 2,164 2,164 2,164 2,091 0 2 1 12 39 29 34 21 100 100 100 282 700 600 538 316 7,718 8,186 7,722 8,236 10,351 10,143 10,442 8,523 6,862 6,911 6,911 7,749 8,509 8,414 8,414 8,023
around shelter because the ground are covered by manure and moss. Foot print is mostly found in lower hills with less ground vegetation and the grounds are not covered by manure.
A logistic regression analysis generated randomly on 1,151 sample squares from 2,300 grid squares total research area while the other 1,149 sample square was use in accuracy assessment. The model resulted correctly classified 93.64% of presence squares and 93.17% of absence with overall classification accuracy 93.21%. We using five environmental variables in predicting the model of which distance to settlement, distance to forest edge, altitude, and slope had significant coefficient in increasing the suitability factor for Anoa habitats while distance to river variables resulted significance number more than 0.05 which mean those parameter have no significant effect into model. The model explained 76.3% of the variance of the independent variable using Nagelkerke’s R2. This mean there are 23.7% environment variable that not represented in this model. Hosmer and Lemeshow goodness of fit resulted chi-square 2.879 with significance 0.942 which is above that required. The Hosmer and Lemeshow goodness of fit test result indicated this model is fit with the observation data and can be accepted.
Table. 3 Logistic Regression Result
Variables B S.E. Wald df Sig.
ALT -0.003 .001 4.016 1 .045
SLO -0.042 .014 8.915 1 .003
DTR 0.001 .001 0.228 1 .633
DTS 0.002 .000 23.846 1 .000
DTFE 0.006 .001 49.964 1 .000
Constant -54.426 6.570 68.627 1 .000
Significance influence of distance from settlement and distance from forest edge indicated the Anoa effort to avoid direct contact from human activities. River becomes not significant parameter to the model which might because rivers were spread from top of mountain down to settlement area. Though Anoa seem to avoid river in lower altitude since people around national park use the river in lower altitude as access to collecting rattan inside national park.
From 24 sampling plot of vegetation analysis, recorded 81 species from 41 families found in place where Anoa found. Where 25 species from 14 families were identified as Anoa feed. Anoa feed vegetation like Pinanga caessia Blume,
Alpinia sp., Cyathea contamminans, Frecynetia insignis Blume, Syzygium accuminatissima, and Lythocarpus celebicus were dominated in sampling plot from the high importance value result. Beside those dominant vegetation, there also found others Anoa feed vegetation like Elastotema sp., Begonia sp., Pandanus sp., Piper sp., Dinochloa sp., Garcinia sp., Syzygium sp., Drynaria
rigidula, Smilax leuchophylla, and some species from Zingiberaceae and
Arecaceae family in sampling plot.
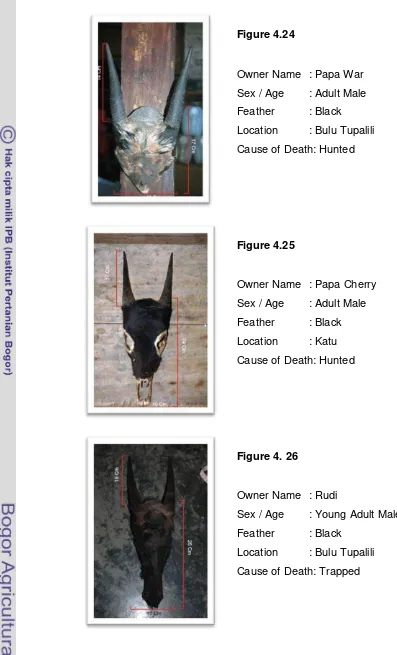
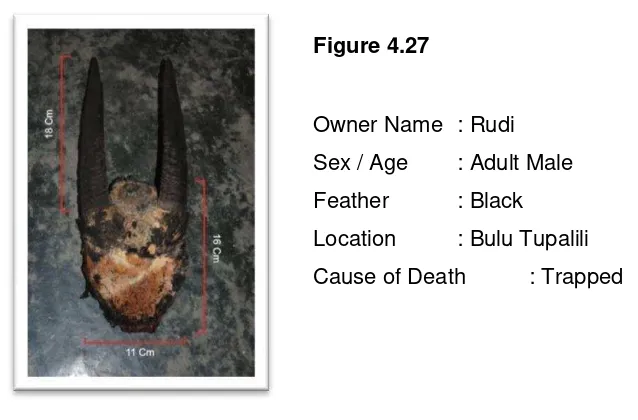
From species morphological characteristic, two from five samples
collected inside and around study area shown the characteristic of
Lowland Anoa. The fact that inside and around study area is mountainous
area has derive to a possibility that Lowland Anoa has moving into
mountainous area because pressure from human activities in lowland area
around national park.
Anoa tend to make a distance from human activity area even in the
lowest human activities area or other area that already disturbed by
human. Local people activities, like collecting Rattan and Gaharu inside
national park, has disturbed habitat of Anoa. A human activity inside
national park forest has force Anoa to move deeply into top of mountain
area. Distances from human activities area become the most influence
Copyright © 2010, Bogor Agricultural University Copyright are protected by law,
1. It is prohibited to cite all or part of this thesis without referring to and mentioning the source
a. Citation only permitted for the sake of education, research, scientific writing, report writing, critical writing or reviewing scientific problem.
b. Citation does not inflict the name and honor of Bogor Agricultural University.
POTENTIAL
HABITAT AND SPATIAL DISTRIBUTION OF ANOA
(
Bubalus
spp
.
)
IN LORE LINDU NATIONAL PARK
BENI OKARDA
A Thesis submitted for the degree of Master of Science of Bogor Agricultural University
MASTER OF SCIENCE IN INFORMATION TECHNOLOGY FOR NATURAL
RESOURCES MANAGEMENT PROGRAM
GRADUATE SCHOOL
BOGOR AGRICULTURAL UNIVERSITY
BOGOR
Research Title : Potential Habitat and Spatial Distribution of Anoa (Bubalus spp.) in Lore Lindu National Park
Name : Beni Okarda
Student ID : G051060031
Study Program : Master of Science in Information Technology for Natural Resources Management
Approved by, Advisory Board
Dr. Ir. Tania June, M.Sc. Supervisor
Dr. Ir. Abdul Haris Mustari, M.Sc.F. Co-Supervisor
Endorsed by,
Program Coordinator Dean of Graduate School
Dr. Ir. Hartrisari Hardjomidjojo, DEA. Prof. Dr. Ir. Khairil A Notodiputro, M.S.
Date of Examination : November 30, 2009
ACKNOWLEDGEMENT
This research was funded by BMZ and STORMA program. STORMA (Stability of Rainforest Margin in Indonesia) is an Indonesian-German collaborative Research Centre funded by the German Research Foundation (DFG).
I would like to express my highest gratefulness to ALLAH SWT for His blessing, His power, and His guidance all the time.
I wish to express my highest respect to my parents S. Budiono and Beng Hamah and all family for their love, support, prayer, and everything.
I wish to show my gratitude to my supervisor Dr. Ir. Tania June, M.Sc. and my co-supervisor Dr. Ir. Abdul Haris Mustari, M.Sc.F. for their advice, guidance, valuable knowledge, patience, encouragement, and time during the supervision of my research. Dr. Ir. Lilik Budi Prasetyo, M.Agr. as external examiner for input, advice and constructive criticism. Prof. Yoshino Kunihiko for his patience, discussion, and constructive criticisms during my study in Japan.
I wish to thank Dr. Wolfram Lorenz and Dr. Adam Malik (STORMA) for their aids and guidances during field work. Research assistant during field work; Amran, Berwin, Yan and UNTAD forester for aid and support me during field work research.
CURRICULUM VITAE
Beni Okarda was born in Jakarta, on October 21, 1982. He spent his childhood in East Jakarta and finished his high school at SMUN 58 Jakarta. He achieved his undergraduate degree in 2005 from Bogor Agricultural University, Faculty of Forestry, majoring in Forest Resources Conservation and Ecotourism.
In 2006, Beni Okarda pursued his master degree at Master of Science in Information Technology for Natural Resources Management Program (MIT), Bogor Agricultural University. Between his studies in MIT, he follows one year Exchange Research Student Program in University of Tsukuba Japan as SATO Scholarship Grantee from 2008 until 2009.
TABLE OF CONTENT
I. INTRODUCTION
1.2. Background. 1
1.3. Objective 4
1.4. Expected Output 4
II. LITERATURE REVIEW
2.2. Lore Lindu National Park 5
2.3. Anoa (Bubalus spp.) 5
2.4. Animal Spatial Distribution 7
2.5. Logistic Regression 8
2.6. Vegetation Analysis 11
III. RESEARCH METHODOLOGY
3.2. Time and Research Area 12
3.3. Data Collection 13
3.4. Habitat Suitability Model 16
3.5. Statistical Test 17
3.6. Vegetation Analysis 18
IV. RESULT AND DISCUSSION
4.2. Anoa Presence Data 20
4.3. Habitat Suitability Model 28
4.4. Statistical Test 34
4.5. Accuracy Assessment 35
4.6. Vegetation Analysis 35
4.7. Morphometric 42
LIST OF FIGURES
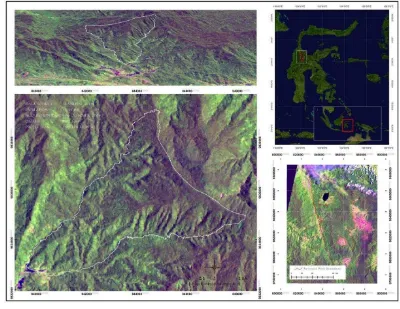
Figure 3.1 Research Study Area 13
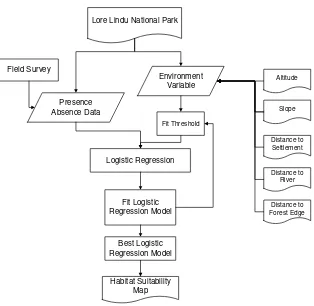
Figure 3.2 Habitat Suitability Model Workflow 17
Figure 3.3 Line Transect Method 18
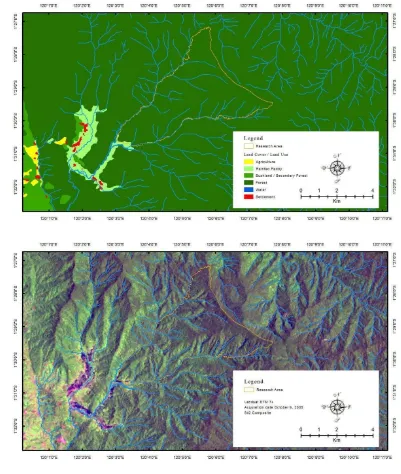
Figure 4.1 Land Use Land Cover and Landsat Imagery 21
Figure 4.2 Anoa Foot Print 24
Figure 4.3 Horn Scouring Tree 24
Figure 4.4 Anoa Foot Print 24
Figure 4.5 Anoa Foot Print 24
Figure 4.6 Anoa Feces 25
Figure 4.7 Anoa Old Feces 25
Figure 4.8 Anoa Shelter 25
Figure 4.9 Anoa Shelter 25
Figure 4.10 Ground Condition Around Shelter 25 Figure 4.11 Anoa Sign Distribution in Altitude Parameter 26 Figure 4.12 Anoa Sign Distribution in Slope Parameter 26 Figure 4.13 Anoa Sign Distribution in Distance to Settlement Parameter 27 Figure 4.14 Anoa Sign Distribution in Distance to River Parameter 27 Figure 4.15 Anoa Sign Distribution in Distance to Forest Edge Parameter 28
Figure 4.16 Altitude Distribution 29
Figure 4.17 Slope Distribution 29
Figure 4.18 Distances to River Distribution 30
Figure 4.19 Distances to Settlement Distribution 30 Figure 4.20 Distances to Forest Edge Distribution 31
Figure 4.21 Habitat Suitability Map 34
Figure 4.22 Palili Fruit 42
Figure 4.24 Anoa Skull 43
Figure 4.25 Anoa Skull 43
Figure 4.26 Anoa Skull 43
LIST OF TABLES
Table 3.1 Environmental Variables 14
Table 4.1 Anoa Presence Sign 20
Table 4.2 Logistic Regression Result 32
Table 4.3 Seedling and Undergrowth Vegetation 36
Table 4.4 Sapling Vegetation 37
Table 4.5 Poles Vegetation 39
I.
INTRODUCTION
1.1.
BackgroundIndonesian tropical forest is widely known over the world which having high value in biodiversity. World Resources Institute and Forest Watch Indonesia (2002) assert that tropical forest in Indonesia is a home for 11 percent of the world’s plant species, 10 percent of its mammal species, and 16 percent of its bird species. With this number of biodiversity value, Indonesia is ranked as the third richest in biological diversity after Brazil and the Democratic Republic of Congo. It also states that the forest types of Indonesia are diverse from evergreen lowland dipterocarp forests in Sumatra and Kalimantan to seasonal monsoon forests and also savanna grasslands in Nusa Tenggara and non-dipterocarp lowland forests and alpine areas in Irian Jaya (sometimes referred to as Papua).
Indonesia also has the most extensive mangrove forests in the world, estimated at 4.25 million hectares in the early 1990’s. It is also stated that Indonesia’s 17,000 islands span the Indo-Malayan and Australasian realms; the archipelago contains seven major bio-geographic realms and an extraordinary diversity of habitat types. In Indonesia, three main centers of species richness are: Irian Jaya (high species richness and endemism), Kalimantan (high species richness, moderate endemism), and Sulawesi (moderate species richness, high endemism). In other hand, many islands have been isolated for millennia, so levels of endemism are high. From 429 locally endemic bird species, for example, 251 are unique to a single island. Most of Indonesia’s insects are also endemic, with many genera confined to individual mountain tops.
habitat. In species taxonomy classification, Anoa is relative to buffalo family but smaller size than other buffalo family. Anoa body size which more similar to deer makes some people called this species as dwarf buffalo. Anoa also has similar behavior like other buffalo families which like to have mud bathing to reduce the body temperature. Humans also benefit from the role Anoa play in keeping the forest understory under control (Massicot, 2004).
Both species of Anoa have been classified into endangered species since 1960 and the population is decreased. Lowland Anoa (B. depressicornis) and Mountain Anoa (B. quarlesi) are classified as endangered [C1+2a] by the International Union for Conservation of Nature (2004), and listed on Convention on International Trade in Endangered Species Appendix I (CITES, 2005). Bubalus spp. are fully protected under Indonesian law, although enforcement is difficult. IUCN (2004) explains that the total population of B. quarlesi is unlikely to be more than 3,000–5,000 animals, with the number of mature individuals likely to be less than 2,500. More, there has been a decrease in the range and abundance of this species since the turn of the century; and there is indication that they have declined over the 1980 – 2000 period (approximately 3 generations). Even there are few data exist to accurately quantify the species current abundance; however, they still appear to be distributed relatively widely within their known historical range on Sulawesi.
Threat for Anoa existence is coming in directly and indirectly way. In direct threat, the major threat is caused by hunting. Natives’ people from Sulawesi get advantage of Anoa for their hides, meat, and horns. Anoa horn is very popular among local people in Sulawesi and become the identity symbol for native Sulawesi. Mustari (2003) reported, despite Anoa being formally protected, the animals are still hunted throughout Sulawesi by people using traditional method such as leg snares, hunting with spears with the assistance of dogs or setting sharp-tipped bamboo stake along the natural paths of the animals. There still no data recorded for Anoa in illegal wildlife trafficking or smuggling.
development, and human settlement has reported as serious threat for Anoa (IUCN, 2004). Forest degradation will cause significant impact into habitat loss of Anoa, which fulfills the food supply for Anoa. And since Anoa was classified into water dependent animal, the hydrological function of tropical forest will give indirect benefit in preserving the suitable habitat for Anoa.
Ministry of Forestry (2008) announced that the deforestation in Indonesia reach 1.17 million hectare per year between 2003 to 2006. In this report also include deforestation in protected area reach 55.6 thousand hectare per year or 4.75% from total deforestation in Indonesia. Central Sulawesi province classified as high deforestation in protected area with deforestation reach up to 9.2 thousand hectare per year. This is become serious threat for species that inhabit forest especially those which live in protected forest area.
Logistic regression have been known as one of approach in determine correlation between species and it habitat. Spatial logistic regressions which combine with Geographic Information System (GIS) have been use in determining spatial correlation and known as the perfect combination in determining suitability habitat. Spatial databases provide information which can be used to develop models useful for predicting the suitability and occurrence of research subject from environmental factor correlation.
a. Objectives
There still inadequate research about Anoa species distribution and habitat which might affected in planning national park zone management. Species and habitat distribution will give important information in planning and monitoring the species and habitat condition. This research aims to develop Anoa habitat suitability model using logistic regression and analyze ecological factors in Anoa habitat preference.
b. Expected Output
The expected outputs from this research are habitat suitability model for Anoa and present condition. Spatial logistic regression model will give explanation in Anoa habitat spatial distribution and correlation between environmental parameter with suitability habitat for Anoa and explain what kind of parameter that affected for Anoa in choosing its habitat. Vegetation analysis will give more specific information about ground condition especially from the side of feed vegetation in research area.
II. LITERATURE REVIEW
2.1. Lore Lindu National Park
Lore Lindu National Park is located in Central Sulawesi Province, covering 217,000 hectares, which consists of 20 % mountainous forest, 70 % hillly and lower mountainous forest and most of lowland forest (± 10 %). This National Park was established in October 1993, which was established from Lore Kalamanta Nature Reserve and Lake Lindu Recreation-Protection Forest. Much earlier before gazette as a national park, the Lore Lindu region has been declared as a “Man and the Biosphere Reserve” (MAB) by UNESCO in 1978 and it has been nominated as a World Heritage site for its astonishing cultural heritage of ancient stone megaliths dating from 1300 AD (Pangau-Adam 2003; TNC 2006).
The park is a major catchments area of Gumbasa and Lariang rivers and the mountainous topography harbors some of the largest unbroken tracts of forest on Sulawesi. This is providing the essential habitat for Babirusa or Pig Deer (Babyrousa babyrussa), Babi Hutan or Wild Boar (Sus scrofa), Tarsier (Tarsius sp.), Tonkean macaque (Macaca tonkeana), Hornbill (Rhyticeros cassidix), Maleo (Macrocephalon maleo) and other 227 birds, 77 of which are endemic to Sulawesi (The Nature Conservancy, 2006).
Lore Lindu National Park is also the habitat for Anoa or Bubalus
spp. which is endemic species to the Indonesian islands of Sulawesi and Buton [Butung] in southeast Sulawesi Province, occupying an area approximately 5,000 km² (IUCN, 2004). In addition, base on IUCN’s observation in 2004, Anoa’s distribute across most of its known historical range, and founded in several protected areas, including Lore Lindu National Park.
2.2. Anoa (Bubalus spp.)
Buchholtz (1990) described Mountain Anoa (B. quarlesi) to be similar in form to the Lowland Anoa (B. depressicornis). Mountain Anoa is the smallest of the extant wild cattle. It is also mentioned that the body is round and barrel-shaped, and the legs are slender. Body length is approximately 150 cm and shoulder height is typically 70 cm. Burton et al.
(2005) also explain the Anoa are two species of dwarf buffalo, the Lowland Anoa (Bubalus depressicornis) and Mountain Anoa (Bubalus quarlesi) that are endemic to the island of Sulawesi, Indonesia. The classification of the subgenus Anoa within Bubalus is upheld by assessment of recent genetic and morphological research. The classification of Anoa into two species is still debated.
The coat of adults, especially females, is often thick and woolly into adulthood - rather than being grown specially, this appears to be merely retention of a juvenile characteristic. This woolly coat may be shed by increasing maturity, but if it is lost, the hair is never as sparse as in B. depressicornis (Groves, 1969). The color of adults varies from dark brown to black, with males approaching black and generally being darker than females (Groves, 1969; Feer, 1994). Compared to B. depressicornis, B. quarlesi has small and inconspicuous markings (Groves, 1969). The slender legs are brownish black along their entire length, and the small white spots which may be present just above the hooves are often difficult to see (Groves, 1969; Buchholtz, 1990). The groin region is lighter in color than the back, but is not white (Groves, 1969). The tail of the B. quarlesi is shorter than B. depressicornis, being 14.6-17.8 % of the total length (Groves, 1969).
The results of Anoa’s tracks study indicate that Mountain Anoa travel singly or in pairs, but never associate in larger groups (Sugiharta, 1994). However, Whitten etal. (1987) reported a herd of five animals on Mount Nokilalaki has been seen during his expedition. A pair of Mountain Anoa is most likely to be comprised of a mother and her offspring, or an adult male and female (Sugiharta, 1994). The National Research Council (1983) reports that B. quarlesi is active primarily in the morning, seeking shelter under shade trees during the afternoon. Sugiharta (1994) found signs of Mountain Anoa under fallen trees with a diameter greater than 60 cm, in areas under the roots of live trees, and under large overhanging rocks along river banks as shelter. One individual was observed bedded in Gleichenia linearis at the border between forest and grassland in Lore Lindu National Park (Sugiharta, 1994). This animal wallows and bathes in pools of water and mud (National Research Council, 1983).
In terms of feed aspect, B. quarlesi feeds on plants in both forest and open areas, including those created by avalanches and characterized by secondary plant succession. The grass is their preference feed in Lore Lindu National Park. In other hand, to fulfill their mineral needs, Anoa visiting the mineral-rich hot springs and salt licks, it is also reports they may drink seawater (Sugiharta, 1994).
2.3. Animal Spatial Distribution
Animals vary widely in their tolerance of environmental conditions. Some can survive in a variety of habitats, whereas others perish when removed from their natural surroundings. No animals other than humans can create sufficient artificial changes to enable them to exist in a totally strange environment without evolving through many generations of adaptation. The specific interactions of animals with their environments are the subject matter of ecology. The factors affecting animal distribution range from global geological events to local weather conditions.
Animals don't live completely free in a wild state because their living space is confined by boundaries that are often invisible to the casual observer. The size of the area used is determined often by individual and species needs and environmental limitation. Distribution or range is the geographic distribution of the species. Within this range only areas of suitable habitat are occupied. Home range is the living area normally occupied and inhabited by an animal. It may belong to a single individual, a mated pair or a social unit, a cohesive group with a single dominant individual. Within the home range there is often a defended area which is identified as a territory. Typical behavior is usually associated with establishing and defending or protecting the animal's territory. This behavior and reproductive behavior associated with the territory is unique for each species, and allows several different animal species to live in the same space without rivalry, using different niches within the habitat. The home ranges of different groups often overlap, and in the overlap areas the groups will tend to avoid each other rather than seeking to expel each other. Within the home range there may be a core area that no other individual group uses, but again this is as a result of avoidance rather than defense.
2.4. Logistic Regression
knowledge about the ecology of the species could reduce the number of the unnecessary independent variables included in analysis.
Logistic Regression model is regression model for binary response variable. Logistic regression equation is shown below
�
=
1
1 +
�
−(�0+ =1�)
Where P is probability value in range 0 to 1 with 0.5 as threshold value for suitable and unsuitable classification, β0, βj represent constant, xi
represent environment variable and exp is natural logarithm
Walker (1990) used logistic regression to map the distribution of three kangaroo species in Australia against climate parameters. The model was built with an inductive approach using a Classification and Regression Tree (CART) function within a GIS that established decision-rules, as well as a probability function (logistic regression model) for mapping the probability distribution of species. A comparison between the two methods revealed that commission error (areas where presence of kangaroos was predicted but not recorded) was higher with logistic regression than with CART.
Miyamoto et al. (2004) investigated the effect of environmental variables on the presence of the Formosan squirrel using logistic regression analysis in the Ofuna area. Logistic regression analysis showed that the area of a wood, the proportion of cultivated fields surrounding the wood, and the proportion of broad-leaved evergreen trees in the wood influenced the presence of the Formosan squirrel. Logistic regression analysis was used to determine the effect of ten environmental variables related to wooded area, distance between woods, vegetation in each wood, and land use surrounding the wood by using a stepwise procedure.
The data model consists of the decisions made regarding how the data are collected and how the data will be measured or estimated. The statistical model involves the choice of statistical method, error function and significance tests. Each model interacts in both obvious and subtle ways with the other models to determine the success of any statistical modelling exercise.
A wide variety of statistical models are currently in use to represent and simulate the spatial distribution of terrestrial animal and plant species as well as biomes and processes, and GIS are being increasingly used to model wildlife-habitat relationships The selection of significant parameters is essential for successfully model any process, thus the identification of causal variables is the most critical step in model development (Guisan and Zimmerman, 2000).
Robertson et al.(2000) attempted to determine whether correlative models could perform as well as mechanistic models for predicting species potential distributions, using a case study. Robertson compared potential distribution predictions made for a coastal dune plant (Scaevola plumieri) along the coast of South Africa, using a mechanistic model based on Summer Water Balance (SWB), and two correlative models (a profile and a group discrimination technique). The profile technique was based on Principal Components Analysis (PCA) and the group-discrimination technique was based on multiple Logistic Regressions (LR). Kappa (κ) statistics were used to objectively assess model performance and model agreement. Model performance was calculated by measuring the levels of agreement (using κ) between a set of testing localities (distribution records not used for model building) and each of the model predictions. The result of the study showed the utilisationof agreement proposed scale by Monserud and Leemans (1992), the Kappa Statistics indicated “very good” agreement for the PCA and “excellent” agreement for the SWB model and “perfect” agreement for the LR model.
2.5. Vegetation Analysis
Vegetation analysis is conducted in order to get detail information about vegetation structure and domination. In this research, this kind of data will support the model that will be developing spatially. The vegetation structure will explain the condition that cannot explain by spatial model. From vegetation analysis result, expectably, will show the type of vegetation that known as Anoa feed and it condition. This data will be complementary data in explaining suitable habitat for Anoa.
Mustari (2001) explain that Anoa is ruminant herbivore type animal. Anoa feed are from many kind of vegetations consisting leaves, shrub, bush and many kind of grass. Grzimek in 1968 explain that Anoa feed consist of leaves, shrub and bush, Pteridophyta, grass, fallen fruit,
Palmae and aquatic vegetation. While Whitten et al. (1987) reported from faecal analysis in South Sulawesi, Anoa is browser type herbivore that consumes woody vegetation, Pteridophyta, grass, moss, and monocots plant. Mustari (1995) also reported about 33 species from 18 families are identified as Anoa feed sources. Part of the plant that being consumed were consist of leaves, sprout, palm-cabbage and root. Anoa was also known temporarily visiting salt-lake-spring, like Anoa that lives in Nantu forest, Gorontalo.
Anoa has large variation of vegetation that well adapted as feed. Pujaningsih (2005) reported eleven type of vegetation was founded and known as delicates feed for Anoa, that vegetation are Areca sp.,
Elastotema sp., Rubus sp., Zingiber sp., Nephrolepis sp., Cyrtandra sp.,
Begonia sp., Erasgrotis sp., Saccharum sp., and two other species from family Palmaceae and Utriceae. From those species, Areca sp.,
III.
RESEARCH METHODOLOGY
3.1. Time and Research Area
The field work was taken place in primary forest around Toro village in Lore Lindu National Park, Indonesia. The study area located in 120o2’53” – 120o7’44”E and 1o27’3” – 1o30’51”S. This area administratively is part of Toro Village, Sub District of Kulawi Central Sulawesi Province. Study area was approximately taken 2,300 Ha of Lore Lindu national park area with 1,151 Ha sampling area and 1,149 Ha accuracy assessment area. From data observation, study area has altitude range from 814 meter above sea level in Toro Village settlement area up to 2173 meter above sea level in top of mountain with various slopes from 0 up to 62 percent. Lore Lindu is tropical rainforest with high humidity with temperatures vary from 26-32 oC. High altitude areas are significantly cooler with temperature drops 6 oC every 1100 m. The annual rainfall in Lore Lindu National Park varies between 2000 – 4000 mm per year with heaviest rain periods between November to April.
The fieldwork data collection was conducted from April to July 2008 including the process of vegetation identification which conducted in Herbarium Celebenses, Tadulako University, Central Sulawesi. While the data processing and thesis writing conducted in Laboratory of Remote Sensing and GIS, MIT-BIOTROP Bogor, from July to August 2008 and University of Tsukuba from August 2008 to August 2009.
Figure 3.1 Research Study Area
3.2. Data Collection
Data collected for this study was taken from many sources with different data acquisition methods, direct and undirect data acquisition. Direct data acquired in collecting presence and absence sign while environmental parameter layer was taken from spatial database.
Anoa presence data was collected from field survey by identifying the sign of Anoa presence. The sign of Anoa presence can be identify from its footprint, feces, horn and other sign that can identify as sign of Anoa presence. This data collection was conducted with assistance from local people who formerly working as Anoa hunter.
All the data were used for generating the model that were derived into spatial format and considered as the input parameter within the grid analysis unit. In this study we generated grid analysis unit that considered as observation unit for each parameter variable. The 100 m grid analysis unit was generated using ArcMap Create Fishnet Feature Class Toolbox. 100 meter grid resolution were chosen base on approximate detail can be obtain from parameter layer.
The parameter grid inputted using Hawth Tools Extension in ArcGIS software. Each parameter will be derived first into 100 meter grid then inputted using polygon to polygon analysis in Hawth Tools using mean weighted area method. Each cell in simulation grid will be consists of value that represent current condition in grid area. The result for each parameter will be joined into one feature using Add Join Table features in ArcMap. The result of this features are continuous value that represent grid area condition.
The absence or presence data conducted using select by location features. The grid that intersected with point of presence Anoa location were considered as suitable habitat for Anoa and will be given value 1 while other grid which not intersected were considered as pseudo absence and were given value 0 or classified as non-suitable area.
Table 3.1. Environmental Variables
Abbreviation Description Unit
ALT SLO DTR DTS DTFE Altitude Slope
Distance to River
Distance to Settlement
Distance to Forest Edge
Meter Above Sea Level
Percent
Meter
Meter
Meter
other sign that considered as sign of Anoa presence. Another information like Anoa shelter location also collected regarding to find core area of Anoa.
The first parameter use in this study is topographic condition. Mountain Anoa inhabits primary rainforest, usually in hilly landscapes, at elevations up to 2,300 meters (National Research Council, 1983; Sugiharta, 1994). In topographic parameter were divided into altitude and slope. These topographic parameters are important factor in determining habitat suitability for Anoa. Mountain Anoa is dwarf buffalo families that live in mountainous area with certain topographical condition for their habitat. In this research we also find the suitable topographical factor for Anoa by considering the distribution of Anoa in topographic parameter.
The topographical data were derived from Digital Elevation Model from Satellite Radar Topographic Mission imagery which has 90 meter spatial resolution. Digital number in SRTM image represents the altitude value in meter unit. This imagery then processed in Topographic Analysis in ERDAS Imagine which resulted altitude and slope raster. This raster then converted into vector features using raster to vector conversion in Arc Toolbox. The slope features consists slope in percent value while the altitude was used meter above sea level unit as representation of area level altitude.
The next parameter is distance from human activity area. Anoa was known as solitaire animal that avoid direct contact with human. This animal tends to keep a distance with human activity area like settlement, road and plantation area and other human activities area. Mustari (2003) explain that Anoa showed a trend towards being seen more than one kilometer from settlement, road, and other human activities point in Tanjung Amalengo. This fact indicating distance from human activities will affect the Anoa presence and suitable habitat.
settlement features are taken from Indonesia National Coordination Agency for Surveys and Mapping with 1: 50.000 of scale. While the forest edge features are taken from land cover map derived from Landsat ETM 7+ acquisition date October 6th, 2005.
Mustari (2003) also explain that like other species in the genus
Bubalus, Anoa is water dependent animal. They need water for drinking everyday and they were frequently observed wallowing. Distribution of Anoa is significantly associated with water source during the dry season. This statement clearly explains that Anoa have high dependencies in hydrological resource. Based on this fact the hydrological condition will be the one of the parameters in estimating Anoa’s habitat suitability and presence.
Hydrological factor was taken from river feature in Peta Rupa Bumi Bakosurtanal with 1: 50.000 of scale. The stream line feature was processed using Euclidian distance to develop distance from river value in each grid observation. Hydrological data were consists of river stream line, both for all year round rivers and seasonal river.
3.3. Habitat Suitability Model
Habitat model is not a definitive attempt to predict presence or absence, but it is more an attempt to identify areas where conservation and forest habitat enhancement could be prioritized. The deductive modeling approach allows the utilization of statistically significant quantitative data to build a habitat model that describes the similar areas to those used by species. The absence of Anoa in predicted suitable area will not indicate unsuitable Anoa habitat. By identifying similarities, in habitat features across the Lore Lindu National Park, the improvement in Anoa’s preservation could be increased suitable habitat patch size and connect neighboring patches.
characterize the habitat of known Anoa locations as well as those areas with no sign of Anoa.
Areas throughout the Lore Lindu National Park exhibiting land cover, vegetation, and biophysics characteristics similar to locations where Anoa was observed in the field are associated with a higher metric in the derived map. Areas exhibiting characteristics similar to locations where field data indicated the absence of Anoa are associated with a lower metric on the map.
Figure 3.2 Habitat Suitability Model Workflow
3.4. Statistical Test
Spatial distribution model will build the model based on ecological parameter and testing it against current Anoa locations. To assess fit and relative strength of the selected model, we used the Hosmer and Lemeshow goodness of fit test and Nagelkerke’s rescaled R2
respectively. Probabilities from the logistic regression are used to derive a predictive habitat map from the significant habitat characteristics across the
Lore Lindu National Park
Presence Absence Data Field Survey
Environment Variable
Fit Threshold
Logistic Regression
Distance to Settlement Altitude
Slope
Distance to River
Fit Logistic Regression Model
Habitat Suitability Map Best Logistic Regression Model
[image:37.595.175.489.249.555.2]landscape at threshold values. The results of the regression produced variable coefficients that were then applied to the area and the entire study area ranging from zero to one, where values greater than 0.5 were considered to be presence of Anoa.
3.5. Vegetation Analysis
[image:38.595.220.401.331.532.2]In order to get detailed information about structure and composition of vegetation in Anoa presence location, we conducted Vegetation Analysis method using Purposive Random Sampling. Vegetation analysis was conducted in place where Anoa sign were found. By knowing the structure and composition, it will describe the vegetation condition which might have specific characteristic.
Figure 3.3 Line Transect Method
The plot sizes in vegetation analysis are 20 x 20 m for trees, 10 x 10 m for poles, 5 x 5 m for sapling and 2 x 2 m for seedling and undergrowth plant. Data collected from the field was calculated to determine information about Density, Frequency, Dominance and Importance Value. The formula used in calculating these values are
a. Density
�� � �� = Individu Plot Sample Area
� � ��� = Species Density
Total Species Density 100%
b. Frequency
�� � � � � � = Plot where species found Total Plot
� � �� � � � = Plot where species found
Total Plot 100%
c. Dominance
� � ��= Species Basal Area Plot Sample Area
� � �� � ��= Species Dominance
Species Dominance 100 %
d. Importance Value
For tree and poles
� � ���� �= � � ��� + � � �� � � � +
� � �� � ��
For sapling and seedling
IV.
RESULT AND DISCUSSION
4.1. Anoa Presence Data
Research area, based on Landsat 7 ETM classification image was dominated by forest cover and surrounded by agricultural and settlement area. Paddy field agriculture becomes the main livelihood for Toro village people. Other plantation like cacao and coffee plantation also becomes local people agricultural activities. Paddy field usually located near to settlement area and cacao plantation mostly located in border area of national park. Based on field survey observation, there is no permanent sign found in national park boundaries.
Location where Anoa found is primary forest, with steep landscape in certain location, and far away from settlement area. Research area that full dominated by forest cover made this research ignoring land use and land cover as parameter in determining suitability habitat for Anoa. Suitability model will considered applicable in forest cover area.
Anoa presence data was collected by observing certain location which known as habitat of Anoa. The sign of Anoa can be traced by following Anoa track which usually can be identified by seeing the location. Sign of Anoa are consist of footprint, horn scouring tree, feces, and shelter. The Anoa sign of presence and its distribution in each parameter are shown in table 4.1.
Table. 4.1. Anoa Presence Sign
SIGN ALT SLO DTR DTS DTFE
Min Max Min Max Min Max Min Max Min Max
Figure 4.1 Land Use Land Cover and Landsat Imagery
was not covered by manure. This sign also find almost in every class of slope from flat area up to steep area from 0% to 39%. Anoa footprint is easily identified because there is no other mammals’ life in study area and will be no doubt in identifying the footprint. From observation, foot print can be found at least 7,718 meter from the nearest settlement and 6,682 meter from the forest edge. Some footprints also found in around river which indicated river as Anoa place to find water. The foot print found at least 100 meter from river, the river features use in this study are taken from Peta Rupa Bumi, Indonesia National Coordination Agency for Surveys and Mapping (Bakosurtanal). The river in this feature is big river that use by local people as access for collecting rattan inside national park. In field survey, there is a lot small river stream that flow from spring in top of mountain down to river mainstream. This stream probably is the main hydrological resources for Anoa beside the water in concave landscape. Tough the stream is not too big but this stream can fulfill the hydrological need for Anoa.
In observation also found some small footprint near other footprint. This is shown that there is juvenile Anoa life in study area. This juvenile Anoa still following his mother until can be independent and life alone. The feces also found in small size and big size near the footprint. This fact strengthens the prediction that there is juvenile Anoa live in study area.
Sign like horn sign that found in tree which usually called horn scouring tree also considered as Anoa sign of presence. This sign indicated Anoa has behavior to sharpening his horn by scrape his horn to tree. Like other mammals that have horn, Anoa also has behavior to sharpening his horn to tree. The horn are use to defend himself from his enemy or people that he considered as enemy. In study area there is no information that Anoa have animal predator. The only threat is coming from people that hunt Anoa for meat and horn. In past, local people around study area are use to hunt Anoa for their meat for occasional local ceremony. They also use the horn for traditional medicine for men’s sexual health. Anoa was hunt using spear or trapped using rope trap near shelter.
nearest horn scouring tree found in 8,236 meter from settlement and 7,749 from the forest edge. In distance to river parameter, these horn scouring trees are found at least 282 meter from the river stream. We only found horn scouring tree in small number base on our observation. There are no other mammals in this area that have horn and have behavior to sharpening it horns make us sure that this sign of Anoa. There also no specific tree that Anoa use for sharpening his horn.
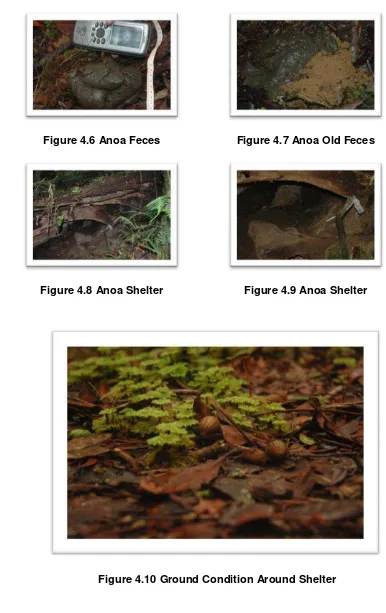
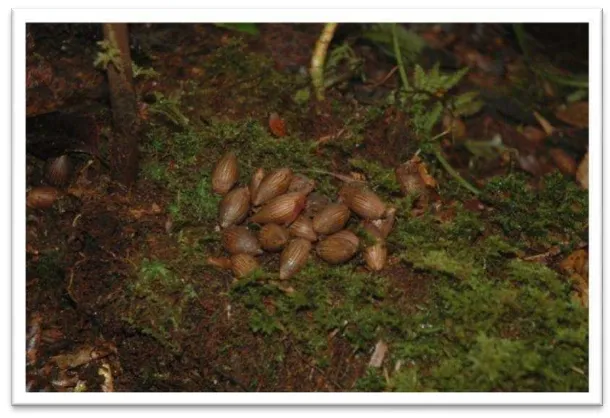
Other sign like Anoa shelter can be identified by seeing the foot print or feces under fall down tree. In some places Anoa take a shelter under concave landscape or hole in mountain side. There is no specific vegetation that identified as shelter place for Anoa. From field observation, Anoa shelter was often found in contiguous place. Though the species probably only one in same place. Anoa use the shelter for protecting from rain and place for sleeping. Anoa find place for shelter in concave landscape or fallen tree and not made a hole or nest for sheltering. Anoa also sometimes uses concave landscape under a rock. The characteristic found in shelter during field survey is there no feces found inside the shelter. The shelter was often found clean with soil ground or rock with no manure or moss inside the shelter. There also no feces inside the shelter. In some shelter, Palili fruit was found inside the shelter. Palili fruit was known as Anoa feed and many Palili tree was found inside the study area.
Figure 4.2 Anoa Foot Print Figure 4.3 Horn Scouring Tree
Figure 4.4 Anoa Foot Print Figure 4.5 Anoa Foot Print
Another sign that use as Anoa sign is feces. Feces mostly found spread around Anoa shelter. From field observation, the new feces found with other old feces around. There are no special characteristic in place where feces found except found near the shelter. Feces never found near the river or other hydrological resources. Some feces also found far away from shelter in steep landscape. Feces never found more than one in new condition it may explain that Anoa defecate only once a day. The location of Anoa feces spread around shelter may explains that Anoa doing activities around that shelter area. This information can be a foundation for determining the core area of Anoa and habitat characteristic.
Figure 4.6 Anoa Feces Figure 4.7 Anoa Old Feces
[image:45.595.108.494.88.701.2]Figure 4.8 Anoa Shelter Figure 4.9 Anoa Shelter
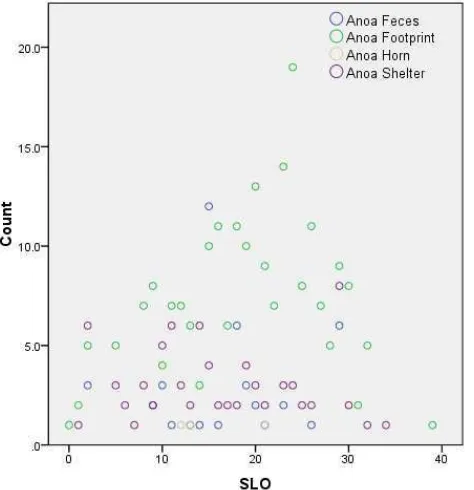
Figure 4.11 Anoa Sign Distribution in Altitude Parameter
[image:46.595.195.432.388.633.2]Figure 4.13 Anoa Sign Distribution in Distance to Settlement Parameter
Figure 4.15 Anoa Sign Distribution in Distance to Forest Edge Parameter
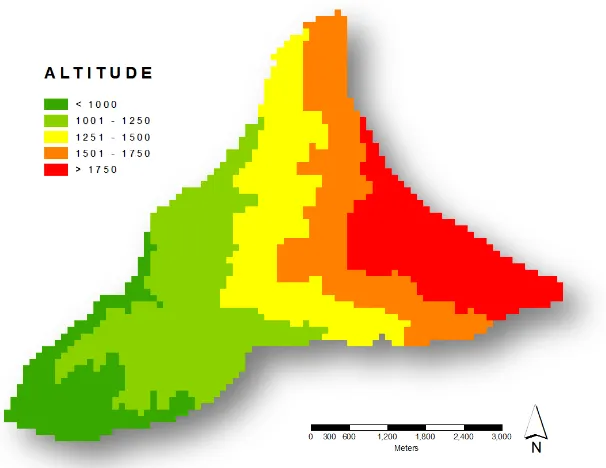
From the result we can see that most of the location of Anoa sign was found in top of mountain and located far away from human activities. The distribution of Anoa sign found in each parameter will be shown on the graphic below. This graphic also showing the distribution and number sign found in each parameter.
4.2. Habitat Suitability Model
Figure 4.16 Altitude Distribution
Figure 4.18 Distances to River Distribution
Figure 4.20 Distances to Forest Edge Distribution
Anoa known as solitaire animal that tends to keep a distance from human activity area like settlement. Distance from forest edge also considered as parameter in determining habitat suitability model because forest edge area is transition zone between forest area and human activity area like plantation and agricultural field. River considered as one of the parameters in function as hydrological resources. Slope and altitude are the factor from special characteristic of Anoa which prefers hilly landscape area in top of mountain.
The logistic regression process resulted habitat suitability model for Anoa in probability equation shown below.
�
=
1
1 +
�
−(−54.426− 0.003∗ALT − 0.042∗SLO +(0.001∗DTR )+(0.002∗DTS )+(0.006∗DTFE ])Where:
Y = Probability DTR = Distance to River
e = Natural Logarithm (2.71828) DTS = Distance to Settlement
ALT = Altitude Parameter DTFE = Distance to Forest Edge
A logistic regression analysis performed on the 1151 sample squares correctly classified 75.7% of presence squares and 98.2% of absence with overall classification accuracy 96.0%. We using five environmental variables in predicting the model where distance to settlement, distance to forest edge, and had significant coefficient in increasing the suitability factor for Anoa habitats while slope variables resulted significance number more than 0.05 which mean those parameter have no significant effect into model
Table 4.2. Logistic Regression Result
Variables B S.E. Wald df Sig.
ALT -0.003 .001 4.016 1 .045
SLO -0.042 .014 8.915 1 .003
DTR 0.001 .001 0.228 1 .633
DTS 0.002 .000 23.846 1 .000
DTFE 0.006 .001 49.964 1 .000
Constant -54.426 6.570 68.627 1 .000
From result, Anoa tends to prefer lower altitude with less significance to the model. This is mean that Anoa were found in various altitude level in sampling area. Other topographical factor, slope, has significance influence to the model shown from significance value less than 0.005. Anoa prefers to live in flat landscape area according to model shown by negative response in slope parameter. This mean Anoa sign mostly found in lower level of slope tough there is probability Anoa can climb in steep landscape in browsing activities because from field observation several Anoa sign were found in steep landscape. Topographical factor which tends to inaccessible is probably the natural protection against human interference.
avoid direct contact from human activities. Anoa was known as solitaire animal that avoid direct contact with human or human activities. From field observation, it also can be seen that Anoa not only keeps distance with human activity area but also avoid place that already disturbed by human activities. In this model we also include the distance from forest edge to know how far human activities from forest edge have influence to Anoa activities. The local people livelihood that still depend on forest resources like collecting Rattan and Gaharu might have some impact to habitat of Anoa. This model shown that this factor have significant influence to habitat suitability. This condition shown that Anoa not only avoids settlement as human area but also other location that people use for their activity. The significance of human activity factor that higher than topographical factor has shown that Anoa have a high consideration to avoid human activities. This is means that human activity factor has more influence to habitat suitability than topographical factor.
In this model, distance to river has no significance influence from the model indicate from significance value which way above 0.05. Anoa sign which found in sampling area were found variously in distance from river factor. This result make this model considered river that use in this model is not having significant to the model. Other water resources found in concave landscape that intercept and retain falling water especially during rainy season can be considered as water resources for Anoa.
Figure 4.21 Habitat Suitability Map
4.3. Statistical Test
The statistical test conducted to assess fit and relative strength of the selected model. We used the Hosmer and Lemeshow goodness of fit test and Nagelkerke’s rescaled R2
respectively. The Hosmer and Lemeshow goodness of fit test is use to test whether the observation data can represent or fit with logistic regression model. If the significant value more than 0.05 than the model will be considered fit with observation data. In this research the result of significant value is 0.942 > 0.05 which mean this model can representing observation data.
4.4. Accuracy Assessment
We use accuracy assessment in order to get information about this model representation in other area. We are selecting 1,149 Ha from 2,300 Ha research areas as accuracy assessment area. Accuracy assessments were conducted by implementing the model into accuracy assessment area and developing the suitability habitat for Anoa. Sampling area and accuracy assessment area were randomly generated from overall research area.
Accuracy assessment classified 968 grid observations from 1,039 absence grid area, or 93.64 % correctly classified, as not suitable habitat for Anoa and classified 103 grids from 110 grids as presence classified or suitable habitat for Anoa or 93.17 % from total presence area in sampling grid. Overall classification accuracy resulted 93.21 % from total accuracy assessment area were correctly classified. Overall accuracy assessment result indicate this model have high accuracy in predicting suitable habitat of Anoa and considered can represent overall parameter in predicting Anoa habitat suitability.
4.5. Vegetation Analysis
Vegetation analysis was conducted in purpose to get detail information about the vegetation structure where Anoa presence. In vegetation analysis we use purposive sampling method to distribute nested plots for vegetation analysis. Purposive sampling was used in selecting the study area since a specific characteristic of the area is required for the study, in this study the specific characteristics is location where Anoa presence.
Table 4.3 Seedling and Undergrowth Vegetation
No. Local Name Scientific Name Family K KR F FR INP
1 Karondowana Alpinia galanga Zingiberaceae 625.00 5.08 0.25 5.26 10.35
2 Karondo Alpinia sp Zingiberaceae 625.00 5.08 0.25 5.26 10.35
3 Kurio Ardisia sp Myrsinaceae 104.17 0.85 0.04 0.88 1.72
4 Asplenium sp1 Aspleniaceae 208.33 1.69 0.08 1.75 3.45
5 Asplenium sp2 Aspleniaceae 104.17 0.85 0.04 0.88 1.72
6 Asplenium sp3 Aspleniaceae 208.33 1.69 0.08 1.75 3.45
7 Begonia sp Begoniaceae 625.00 5.08 0.21 4.39 9.47
8 Unidentified Rubiaceae 312.50 2.54 0.13 2.63 5.17
9 Rotan Kapingei Calamus sp1 Arecaceae 937.50 7.63 0.38 7.89 15.52
10 Rotan Noko Calamus sp2 Arecaceae 104.17 0.85 0.04 0.88 1.72
11 Rotan Wana Calamus sp3 Arecaceae 104.17 0.85 0.04 0.88 1.72
12 Pakis pohon Cyathea
contamminans Cyatheaceae 416.67 3.39 0.17 3.51 6.90
13 Davallia sp1 Davalliaceae 416.67 3.39 0.17 3.51 6.90
14 Davallia sp2 Davalliaceae 208.33 1.69 0.08 1.75 3.45
15 Walopore Dinochloa
barbata Poaceae 104.17 0.85 0.04 0.88 1.72
16 Bambu halus Dinochloa sp Poaceae 416.67 3.39 0.17 3.51 6.90
17 Diplazium
pallidum Athyriaceae 104.17 0.85 0.04 0.88 1.72
18 Ehawana Dipteris
conjugata Polypodiaceae 104.17 0.85 0.04 0.88 1.72
19 Drynaria rigidula
(s.w)bedd Polypodiaceae 208.33 1.69 0.04 0.88 2.57
20 Katatuma Elatostema sp Urticaceae 729.17 5.93 0.29 6.14 12.07
21 Euria sp Theaceae 104.1