ANALYZING AND E STIMATING THE IMPACT OF LANDSLIDE TO ROAD IN SAMIGALUH DISTRICT, KULON PROGO RE GE NCY
Analisis dan Estimasi Dampak Longsorlahan terhadap
Jaringan Jalan di Kecamatan Samigaluh, Kabupaten Kulonprogo
E ko Setya Nugroho1, Danang Sri Hadmoko2, Cees van Westen3, Nanette Kingma3
1 BAPE DA K abupaten Kulonprogo
2 Fakultas Geografi,Universitas Gadjah Mada
3 Faculty of Geo-information Science and E arth Observation, University of Twente,
The Netherlands
E -mail: tsaqifa_xcho@ yahoo.com
ABST RACT
In this study, direct risk assessment was developed for various scenarios on the basis of hazard (e.g. spatial probability, temporal probability and magnitude class), vulnerability and estimating cost of road damage. Indirect risk assessment was derived from traffic interruption. The impact of landslide both direct and indirect impact were analyzed in the road segment 174. The research results show the highest direct impact of debris slide type of magnitude I located in the 20th mapping unit. The lowest direct impact of debris slide type of magnitude I can be founded in the 18th mapping unit. The direct impact of rock fall type of magnitude I which is located in the 6th mapping unit. Meanwhile, indirect impact which was caused by road block age is Rp. 4,593,607.20 and Rp. 4,692,794.40 by using network analysis and community percep-tion methods respectively. A fter class classificapercep-tion, road segment 174 is dominated by very low hazard, very low vulnerability and very low direct impact.
Keywords: road segment, landslide hazard, road vulnerability, direct impact, indirect impact
ABSTRAK
Dalam penelitian ini, penguk uran dampak langsung (direct risk assessment ) di bentuk dari beberapa skenario berdasark an elemen penyusun bahaya (hazard)(antara lain : spatial probability, temporal probability and magnitude class), k erentanan (vulnerability) dan perk iraan biaya k erusak an jalan. Sedangk an dampak tidak langsung (Indirect risk) diperoleh dari lalu lintas yang terganggu ak ibat adanya longsor. Kedua dampak longsor baik langsung maupun dampak tidak langsung diuk ur dan dianalisa di ruas jalan no 174. Hasil penelitian menunjuk k an bahwa dampak langsung dari longsor tipe debris
dengan magnitude I terletak di mapping unit k e 20. Dampak langsung terendah untuk longsor tipe debris dengan magnitude I, terletak di mapping unit k e 18. Untuk dampak langsung dari longsor tipe rockfall
untuk magnitude I berlok asi di mapping unit 6. Sedangk an untuk dampak tidak langsung yang diak ibatk an oleh longsor adalah sebesar Rp. 4,593,607.20 jik a dihitung dengan menggunak an metode network analy-sis dan Rp. 4,692,794.40, bila dihitung dengan metode persepsi masyarak at. Setelah dik elask an, segmen jalan no 174 didominasi oleh tingk at bahaya sangat rendah, tingk at k erentanan sangat rendah dan tingk at dampak langsung sangat rendah.
INTRODUCTION
Actually, Samigaluh District is situated on the Menoreh limestone mountain, which is susceptible to landslide hazards. The event is initially a geomorphology process start-ing with erosion (Priyono, et al., 2011). This is due to several factors such as: steep slopes, humid climate, earthquakes occur-rence and human activity (mining, heavy de-velopment, agriculture) (Hadmoko et.al, 2010). Based on the percentage of cata-strophic events in 2009, it can be understood that landslide of 59.1%, flooding of 4.5% and hurricanes as much as 36.4%, respectively
(Data obtained from the Kesbang L inmas
Office Kulon Progo). Landslide in Samigaluh generated a large amount of damage and even loss of life. Landslides also cause dam-age to the road network. Based on data
re-corded from Kantor Kesbang L inmas Kulon
Progo Regency (Agency for National Unity and Community Protection) in 2010, the most of landslide hit road which are 26 events (54.17%) are located in Samigaluh District.
Road network is as a vital infrastructure to support local development. Road will support transportation, economic development and ease of mobility of people, goods and ser-vices. T he availability of road infrastruc-ture has a very strong relationship with re-gional growth rates among others, marked by economic growth and prosperity.
In this study, the estimation of landslide impact to road considers the comprehen-sive estimation including the direct impact and indirect impact estimation as well. Besides that, the assessment of landslide impact used quantitative method which quantifies landslide probabilities (spatial probabilities & temporal probabilities). The assessment of landslide impact to road using this method is very limited in Indo-nesia, especially in Kulon Progo Regency. By using this method, the comprehensive estimations of landslide impact to road
might be assessed and predicted better. Due to this reason, it was necessary to estimate the impact of landslide risk to road in Samigaluh District, Kulon Progo Regency
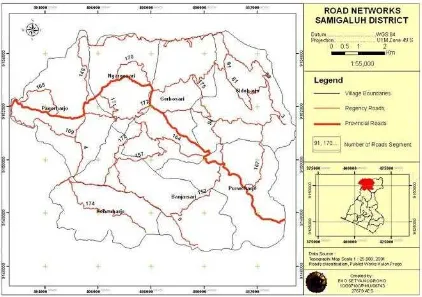
Samigaluh District which lies between 110° 7’ 00"E 110° 13’ 00 E and 7°38’ 40"S -7° 43’ 15" S. Samigaluh District consists of 7 villages which are Kebonharjo, Banjarsari, Pagerharjo, Ngargosari, Gerbosari, Sidoharjo and Purwoharjo village. Total area of Sami-galuh District is 6,736.78 Ha. Meanwhile, road networks consist of provincial roads, district roads and village roads.Adminivtrative map and road networks map of Samigaluh District is presented in (Figure 1).
The Slope class of > 45 % covers 29.76 % from total area. Rainfall value ranging be-tween 248 mm - 277 mm which was catego-rized as almost high class. Breccia rock is the largest percentage covering 55.64 % of the total area of research. Breccia rocks in the study area have a high degree of weathering
which can cause a mass movement.
Mean-while, landuse is dominated by mixed
gar-den which cover 39.54 % from total area.
RE SE ARCH ME THOD
L andslide Inventory and L andslide Density
land-Figure 1. Administrative Map and Road Network Map of Samigaluh District slides hitting road only. Although people
didn’t record landslide events, they still re-member those events, especially people who live in the surrounding events.
Mapping Unit
In this study, author used several factors to create mapping unit, namely; micro slope, and landuse in which those factors will influence landslide event. Rainfall and lithology factors were not considered be-cause these factors have 1 class only (ho-mogeneous). It means that spatially, these factors aren’t significant on segment 174. Mapping unit was created by considering road buffer 30 m right and left along roads. This value (30 m) was used because the furthest of landslide boundary is 30 m from road. After overlying 2 factors above, it can be obtained mapping unit of road segment 174 which are 77 mapping units.
Hazard Zone
Normally, a landslide hazard zonation con-sists of two major aspects e.g. spatial prob-ability of landslide and temporal probabil-ity which is related to the magnitude re-turn period of the triggering event and the occurrence of landslides (Varnes, 1984). To determine hazard, it is used the equa-tion below (Nayak, 2010):
H = P(s) x T(p) x M--- (1)
P (s) = spatial probability
T (p) = temporal probability
M = magnitude
Spatial Probability
Spa-tial probability can be determined by us-ing the followus-ing equation (Nayak, 2010).
P(s) = AL/ AM--- (2)
P(s) = spatial probability of landslide in a mapping unit
AL = area of landslide type and
parti-cular magnitude in a mapping unit AM = area of that particular mapping unit
Temporal Probability
Temporal probability can be approximated by using poisson model. The probability of
occurring n number of slides in a time t is
Here time t is specified, whereas rate λ is
estimated
Magnitude
In this research, author used the magnitude classification based on standard created by Jaiswal to determine magnitude level for different type of landslide.
Vulnerability of road network
Road vulnerability considered the degree of loss of road network which was shown in the degree of road damage. To calculate vulnerability of road network is used the following formula:
V = AD/ TA--- (4)
V = vulnerability of road
AD = road damaged area and or landslide mass covering road area in the road segment
TA = total area of road segment
It was assumed that between road dam-aged due to landslide and landslide mass covering road have the same influence of traffic interruption.
Direct Risk Assessment
The direct risk calculation used equation below. This equation was used by (Nayak, 2010) to calculate landslide direct impact to road in India.
V(d) = vulnerability of different type of element at risk to specific land-slide
A = amount in term of monetary
value of particular element at risk
Indirect Risk Assessment
Indirect risk assessment was derived from traffic interruption. Because of road block-age, driver or commuter will find alterna-tive road which will result in increased costs of fuel purchases. It was used net-work analysis and community perception to determine the optimal road which was chosen by commuter. Indirect impact due to landslide events on the road network can be calculated by using this equation:
IDL = R(d) x N(v) x L(r) x F (c) x F (s)
--- (6)
IDL = indirect loss R(d) = road blockage days
N(v) = number of vehicle of a particular type L(r) = extend distance by using road
F(c) = fuel consumption per km long road F(s) = fuel standard cost per km long road
Data Classification
In this research, author used E qual Inter-vals method. This method sets the value ranges in each category equal in size. This method is the most easily computed and adequate to display data that varies linearly. It was used 5 class criteria which are very low, low, moderate, high, and very high. In order to get the same reference, the class interval used for making hazard and direct impact classification is the class interval for return period 1 yr. Interval class can be calculated by using this equation:
Interval class=(max value–min value)/ 5
--- (7)
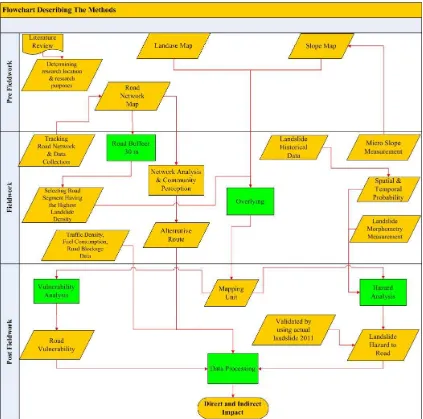
Research F ramework
There are 3 main stages which are : pre field work, field work and post field work. The research framework are represented in (Figure 2). Pre field work deals with the col-lecting of literature reviews including jour-nals, reports, books, related to the data needed and the analysis methods informa-tion. In this phase, data which related with research have been collected. For example: demographic data, rainfall data , slope map, geology map, topographic map, DE M map, road network map and landuse map. In field work, it includes secondary data & primary data collection. Secondary data consists of landslides occurrence data, road network classification data, standard cost deal with road (repairs, construction and mainte-nance), road blockage day data, debris slide volume and so on. Primary data collection was conducted by interviewing and observasing landslide occurrence to road. In order to obtain landslide historical events, author has to observe landslide and discuss with local community deal with past land-slide events. Data was also collected from
discussion with community leaders and key informants. Landslide observation include identify type of landslide and measure land-slide morphometry (length, width, run out and soon) by using lacer ace. In order to ensure and measure the actual road network in the field, author has to do road tracking. Slope data in term of upper and lower road which was used to create micro slope can be measured by using suunto. In this stage, primary data deal with number of vehicle of a particular type was used to calculate indirect impact to road. The primary data of community perception related with the route alternative and fuel consumption can be obtained by using quisionere. In post fieldwork, it related with the finalization of the fieldwork result. Data was analyzed ac-cording to the objective of the research such as; constructing roads hazard zone, con-structing roads vulnerability level, estimat-ing direct risk and indirect risk impact.
RE SULT AND DISCUSSION Landslide Analysis
In this research, landslide density was used to determine which of road segment having highest susceptibility. The impact of land-slide both of direct and indirect impact will be analyzed in this road segment. Among 21 road segments in Samigaluh District, seg-ment 174 is a segseg-ment which has the highest in both value area and number density with
the values are 71.17 m2/Ha and 1.30 event/
Ha respectively. It is caused by the presence of steep slope, high rainfall intensity and fully weathered volcanic breccias rocks.
Only two types of landslides occurred in segment 174 that are dominated by de-bris slides (94.74 %) and 5.26 % of rock falls. The landslide areas ranging from 5.66
m2 to 494.11 m2 with the average is 54.56
m2
seg-Gambar 2. Research Framework ment 174 reached the value of < 1000
m2. It means that based on Jaiswal’s
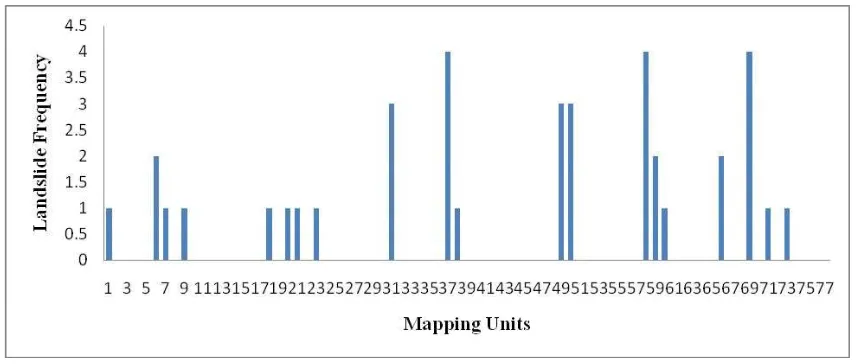
mag-nitude classification, the magmag-nitude of landslide in road segment 174 is I. Tem-porarily, our data indicated that more than 80% of landslide evens have been mostly concentrated on November, December, January, February, and March due to the maximum precipitation down pours dur-ing these periods. Meanwhile, spatially, The most of landslide events can be found in the 31st, 37th, 49th, 50th, 58th, 69th
map-ping units in which are located in steep slope (40°-50°) (Figure 3).
Landslide occurrences can be caused sev-eral factors which give slope failure con-tribution. Several factors which were de-termined as slope failure causing factor are slope, rainfall, lithology and landuse.
Slope
b uilt f rom D igital E levatio n Mo del (DE M), while micro slope can be obtained from direct measurement in the field by using suunto. T he later was also used to build our mapping unit. This data indicates that the macro slope resulted from DE M (size pixel 30 x 30 m) has less detail than the micro slope result obtained from slope measurement. Actually, macro slope can-not be used to analyze the terracing sys-tem in the study area. Based on micro slope classification,. It shows that 86.88 % landslide areas are located on steep slopes (30°-50°). Landslides do not occur on gentle slope < 20°. About 2.27 % of landslides lie on slope class > 50°. which is relatively stable due to the presence of bed rock. Human interaction on this slope class is very limited due to the high de-gree of difficulty to access.
Rainfall
Isohyets in the road segment 174 have a small range of values which has the mini-mum value 257.39 mm and maximini-mum value 261.53 mm. That’s why isohyets class was classified in one of isohyets classes which
can be categorized as “Almost High Classes”. Because of homogeneous of rainfall value, spatially, rainfall factor is less significant than the other factors. However, temporarily, rainfall factor will influence landslide events.
Lithology
Actually, Breccia rock types which have high degree of decomposition can be a potential factor of landslide. However, road segment 174 has one classes of lithology only which is Breccia. Because of the homog-enous of lithology class, spatially, lithol-ogy is less significant in road segment 174.
Landuse
Landslides in the road segment 174 are widely distributed on mixed garden 49.12%, and respectively followed by rain feed paddy field 38.35%, settlements 12.53% and moor 0%. Usually, landslides occurred in mixed garden which has low vegetation density and shallow-fiber root vegetation. B amboo and coconut trees have shallow and fiber roots in which this condition also can be found in rain feed
Source: analisys result
paddy field. Thus these roots have a low ability to withstand landslides.
Landslide Hazard
The highest hazard probability of debris
slide of magnitude I is located in the 20th
mapping unit for return period 1 yr, 3 yr and 5 yr which has 0.0188, 0.0512 and 0.0778 hazard probabilities respectively. This mapping unit experienced the
big-gest landslide which is 494.11 m2 areas.
Based on the information from local com-munity, the biggest landslide lies on the bad irrigation system (situational condi-tion in 2009), the medium vegetacondi-tion den-sity, and the steep slope 40°-50°. Because of steep slope and bad irrigation system on upper location, water flows down to the location and trigger big landslide in rainy season. It was worst by the presence
of a road which is situated above the 20th
mapping unit, so the vibration which is generated by vehicles can trigger landslide event. The lowest hazard probability of
debris slide can be found in the 18th
map-ping unit which has 0.0001, 0.0002, and 0.0003 hazard probabilities respectively. The lowest hazard probability is caused by low probability in term of spatial and
temporal in this mapping unit. The 18th
mapping unit tends to more stable to land-slide, because it is located on moderate slope 30°–40°, high vegetation density and having deep roots system. While, rock
fall type which can be found in the 6th
mapping unit for return period 1 yr, 3 yr and 5 yr has 0.0088, 0.0218 and 0.0305 hazard probability respectively.
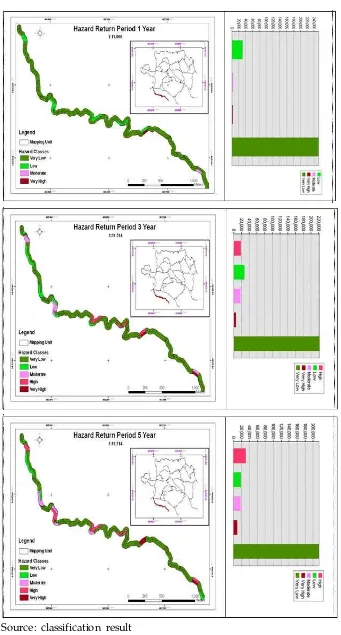
After class classification, landslides hazard return period 1 yr was distributed on the very low class 87.35 %, the low class 10.73 %, the moderate class 1.06% and the very high class 0.86% respectively followed by the high class 0%. Meanwhile, landslide hazard class for return period 3 yr are still dominated very
low class and followed by low class, high class, moderate class, and very high class which has percentage of 76.62%, 9.66%, 6.06%, 5.75%, and 1.92% respectively. The same trends still occurs in hazard return period 5 yr in which the percentage of moderate, high and very high class increase and followed by the decreasing of percentage of very low and low class compare with the hazard return period 1 yr and 3 yr. It means that the higher return period will result the higher hazard classes.It shows that the study area are still dominated by very low class and followed by high class, low class, moderate class, and very high class which have 74.06%, 10.56% , 6.39%, 5.83%, and 3.16% of total area re-spectively for the hazard return period 5 yr. It can be seen in Figure 4.
Based on these figure, although the higher return period will result the higher hazard classes but the most of hazard class for return period 1 yr, 3 yr and 5 yr is still domi-nated by the very low class. This condition compatible with the Jaiswal’s Landslide Magnitude Classification that magnitude I have little landslide area or less spatial probability occurrence. As explained before, segment 174 has landslide magnitude which was categorized magnitude I. That’s why, segment 174 has the very low hazard class.
Source: classification result
in the high (29.16%) and very high class
(51.44%). Based on these data, the most
of landslide events in 2011 are distributed in the high class and the very high class. It means that the hazard model can be used.
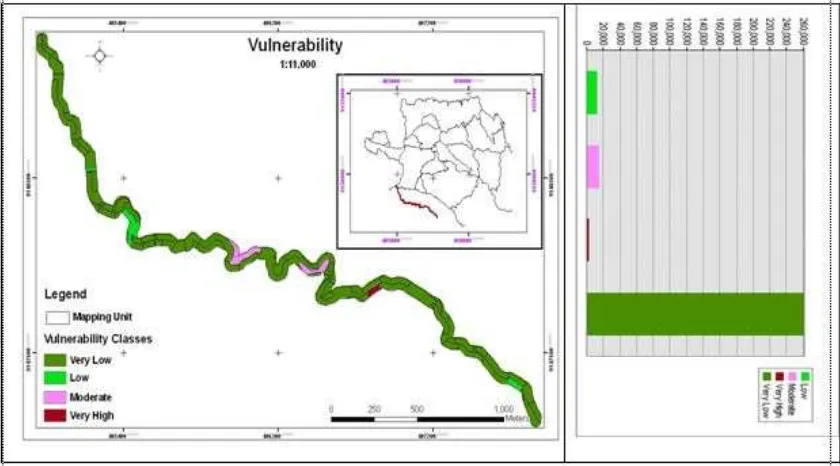
Road Vulnerability
The highest road vulnerability lies on the
20th mapping unit which is 0.7133 road
vulnerability. While, the lowest road
vul-nerability located in the 18th mapping unit
which has 0.0018 road vulnerability. After classifying, road vulnerability segment 174 has 4 vulnerability classes only which are very low, low, moderate, and very high class and followed by the absence of high class. The very low class dominates road vulner-ability class on segment 174 which can be found in almost of mapping unit. The low class can be found 4 times on segment 174 which are the 6th, 50th, 60th and 71th
map-ping units. The very high class located in
the 20th mapping unit which has the
high-est of road vulnerability (Figure 5). Based on the Jaiswal’s Landslide Magnitude
Clas-sification that magnitude I cause minor damage only. That’s why the vulnerability class is dominated by very/low class.
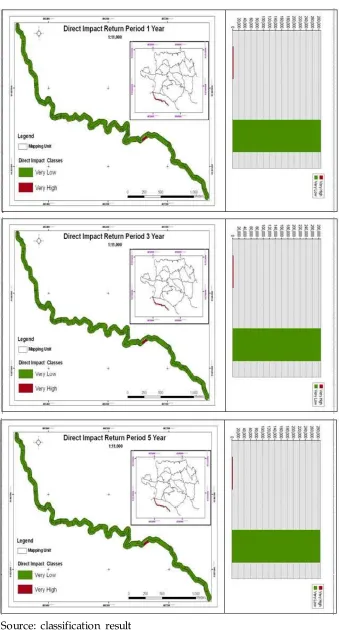
Direct Impact
The highest of direct impact of debris slide
of magnitude I located in the 20th mapping
unit which is Rp. 89,586.69, Rp. 243,995.46 and Rp. 370,414.67 for return period 1 yr, 3 yr and 5 yr respectively. It is caused the
20th mapping unit has the highest of hazard
probability and road vulnerability among the other mapping units. The lowest of debris slide direct impact can be founded in the 18th mapping unit which has Rp. 0.04, Rp.
0.11 and Rp. 0.17 for return period 1 yr, 3 yr and 5 yr respectively. As explained be-fore, the 18th mapping unit has the lowest
hazard probability and road vulnerability among the others. Direct impact which was caused by rock fall type of magnitude I can
be found in the 6th mapping unit only. The
value of rock fall direct impact is Rp. 3,976.34, Rp. 9,897.32 and Rp. 13,866.27 for return period 1 yr, 3 yr and 5 yr respectively.
Source: classification result
After classifying, direct impact has 2 classes only which are very low and very high. Spatialy, after clasification, direct impact class for return period 1 yr, 3 yr and 5 yr and their histogram can be depicted in (Figure 6).
The most of mapping unit for return pe-riod 1 yr, 3 yr and 5 yr were categorized as the very low direct impact class which is 99.14% of total areas and 0.86% can be categorized as the very high direct impact class. It is caused by the low of road vul-nerability and hazard probability for return period 1 yr, 3 yr and 5 yr.
Indirect Impact
In this research, indirect impact was deter-mined by road blockage which was caused by landslide. Because of road blockage, driver or commuter will find alternative road which has longer distance to reach public facility. This condition will cause the in-creasing of fuel purchases cost. Landslide indirect impact can be calculated by using equation 6 in (section 3.1.6.). This formula has several variables which are road block-age days, the number of vehicle of a par-ticular type (traffic density), extend road al-ternative distance and fuel consumption. Road blockage data can be obtained from local community information. Based on community infromation, the biggest land-slide for 10 years (2001-2010) which caused
road blockage for 14 days located in the 20th
mapping unit. Traffic density data were got by measuring at 6 measurement points si-multaneously for 7 days. Alternative routes can be determined by using network analy-sis and community perception. Fuel con-sumption and community perception data can be obtained by community interview-ing (questionnaire).
In this study, author used 2 scenarios of in-direct impact by considering 2 methods which are network analysis and community
perception methods. We can knowthat
in-direct impact based on network analysis is Rp. 4,593,607.20. Meanwhile, total of in-direct impact based on community percep-tion is Rp. 4,692,794.40. Based on network analysis and community perception meth-ods, the contribution of indirect impact is dominated by motor cycle and followed by truck and car which has percentage of 53.66 %, 24.39%, and 21.95% respectively. This is caused by the highest traffic density of motor cycle among the other vehicle types. Because of many load, truck spends much fuel consumption than car. That’s why, truck gives higher contribution than car.
There are the differences of indirect impact calculation which are Rp. 4,593,607.20 and Rp. 4,692,794.40 by using network analysis and community perception methods respec-tively. It is caused by the differences of al-ternative route determination. In the deter-mination of alternative route (optimum route), network analysis considers the short-est of route distance only. While, commu-nity perception consider both of route con-dition and route distance.
CON CL USI ON S AN D RE COM-ME NDATIONS
Conclusions
Source: classification result
and low vegetation density in mixed garden and rain fed paddy field type. Because of low ability to withstand landslides, 49.12% and 38.35% of landslide occurred in mixed garden and rain feed paddy field type, re-spectively. Breccia rocks which have high degree of decomposition can be a potential factor of landslide. Besides that, temporarily, rainfall factor will influence landslide events. Actually, debris slide type of magnitude I has the highest spatial probability of 0.1976 located in the 20th mapping unit and the
highest temporal probability of 0.3297, 0.6988, and 0.8647 for return period 1 yr, 3 yr and 5 yr respectively situated in 3 map-ping unit (i.e. 37th, 58th and 69th). Meanwhile,
the rock fall type of magnitude I can be found
in 6th mapping unit only which has the
spa-tial probability of 0.0483 and the temporal probability of 0.1813, 0.4512 and 0.6321 for return period 1 yr, 3 yr and 5 yr respec-tively. T he highest hazard probability of debris slide of magnitude I is located in the
20th mapping unit for return period 1 yr, 3
yr and 5 yr which has 0.0188, 0.0512 and 0.0778 hazard probabilities respectively. While rock fall type of magnitude I for re-turn period 1 yr, 3 yr and 5 yr has 0.0088, 0.0218 and 0.0305 hazard probability re-spectively. Both debris slide and rock fall type have a tendency that the higher return period the higher hazard probability. After the hazard probabilities were classified, the most of hazard class is the very low hazard class. This condition compatible with the Jaiswal’s Landslide Magnitude Classification that magnitude I have less spatial probabil-ity occurrence. That’s why the hazard class is dominated by very low class. (2) The sec-ond research objective is to assess landslide vulnerability of road. The highest road
vul-nerability lies on the 20th mapping unit which
is 0.7133 road vulnerability. Spatially, road vulnerability has 4 classes which are very low, low, moderate very high classes and followed by the absence of high class. The
very low class dominates road vulnerability class on segment 174 which can be found in almost of mapping unit. The very high
class located in the 20th mapping unit only.
Based on the Jaiswal’s Landslide Magnitude Classification that magnitude I caused mi-nor damage only. That’s why the vulnerabil-ity class is dominated by very/low class. (3) The third research objective is to estimate the landslide direct impact to road. The highest of direct impact of debris slide of
magnitude I located in the 20th mapping unit
Recommendations
(1) Local government must record continu-ously landslide data related with road dam-age and traffic density data. Those data can be used to determine the landslide risk zones and calculate the landslide impact to road. (2) For the next research, the indi-rect impact which relate with the disrup-tion of economic activity, social, educa-tional, delay in travel time can be consid-ered in the indirect impact estimation. (3) In order to reduce landslide susceptibility, authorities have to conduct tree planting with the deep root vegetation.
ACKNOWLE DGE ME NTS
We would like to thank for Prof. D r. Sudibyakto and Prof. Dr. Junun Sartohadi director and co-director Master Programme on G eoinformation Science for Spatial Planning and Risk Management, Universi-tas G adjah Mada as well as Faculty of G eoinformation Science, University of Twente, The Netherlands during our stay for litterature study. We are also greatly indebted to BAPPE NAS for financial sup-port for finalizing this manuscript as well as two anonymous reviewers for their constructive reviews.
RE FE RE NCE S
Budeta, P (2002). Risk assessment from debris flows in pyroclastic deposits along a motorway, Italy.
Journal Springer, E ngineering Geology E nv 61:293–301.
Hadmoko D, Lavigne F, Sartohadi J, Hadi P, Winaryo.(2010) L andslide hazard and risk
assessment and their application in risk management and landuse planning in eastern flank of Menoreh Mountains, Yogyak arta Province, Indonesia, Nat Hazards 54, pp. 623–642.
Priyono, K. D., Sunarto, Sartohadi, J., dan Sudibyakto (2011) Pedogeomorphic Tipology of Landslides in The Menoreh Mountains Kulonprogo District, Yogyakarta Special
Region. Forum Geografi. Vol. 25, No. 1, Juli 2011, pp. 67 - 84.
Nayak J. (2010). L andslide Risk A ssessment A long a Major Road Corridor Based on Historical L andslide Inventory and Traffic A nalysis, Thesis, International Institute for Geo information Science and E arth Observation, E nschede, The Netherlands.91.
Varnes DJ (1984).L andslide hazard zonation: a review of principles and practice, Commission on landslides of the IAE G, UNE SCO, Natural Hazards No. 3, pp 61.
Wahono B F D, (2010). A pplications of Statistical and Heuristic Methods for L andslide Susceptibility