Procedia Engineering 54 ( 2013 ) 176 – 187
1877-7058 © 2013 The Authors. Published by Elsevier Ltd.
Selection and peer-review under responsibility of Department of Civil Engineering, Sebelas Maret University doi: 10.1016/j.proeng.2013.03.017
The 2nd International Conference on Rehabilitation and Maintenance in Civil Engineering
Finite Element Analysis of the Movement of the Tie-Back Wall in
Alluvial-Silty Soils
Agus Setyo Muntohara* and Hung-Jiun Liaob
a
Department of Civil Engineering, Universitas Muhammadiyah Yogyakarta, Indonesia b
Department of Construction Engineering, National Taiwan University of Science and Technology, Taiwan
Abstract
Excavations in urban developed areas were commonly supported by diaphragm walls with internal braces or tieback anchors. There are still required the necessary civil works to serve the demands and also to solve the environmental problems. Wales and cross-lot struts are by far the predominant method for wall support, the large working space inside the excavation provided by a tieback anchor system has a significant construction advantage. This paper aims to evaluate the soil stiffness parameters of the alluvial Taipei soil for tie-back diaphragm wall based on back analysis of case study. The case histories of the Taipei County Administration Centre (TCAC) and NTU Hospital (NTUH) were studied in this paper. The deformation analysis was carried out by available finite element analysis tool using PLAXIS. In the analysis, beam element method together with an elastic perfect plastic soil model was used to design the diaphragm wall and the tieback anchor system. The soil was modelled as Mohr-Coulomb model. According to the basic design, the clay deposits are modelled as undrained behaviour while silty-sand behaves in drained condition. The simulation results show that the maximum horizontal movement occurred at around the bottom of wall. At the final stage of construction, the root mean square deviation (RSMD) between measured and calculated the wall movement was 4% and 7% respectively at TCAC and NTUH sites. It was concluded that tied-back diaphragm wall can be satisfactorily modelled using elasto-plastic Mohr-Coulomb soil model.
from the SPT-N relationship, for clay deposit layer and for silty-sand deposit.
© 2012 Published by Elsevier Ltd. Selection and/or peer-review under responsibility of Department of Civil Engineering, Sebelas Maret University
Keywords: anchors; diaphragm wall; alluvial soils; lateral-movement; finite element method.
* Corresponding author. Tel.: +62 274 387656 (Ext. 239); fax: +62 274 387646.
E-mail address: [email protected]
© 2013 The Authors. Published by Elsevier Ltd.
1. Introduction
Rapid development in urban areas and limited space for construction in cities imposed engineers to apply a suitable and reliable technology and construction method. Wall-supported deep excavation is now the common construction in urban environment. Typically, excavations in those areas are supported by diaphragm walls with internal braces or tieback anchors. There are still required the necessary civil works to serve the demands and also to solve the environmental problems. Wales and cross-lot struts are by far the predominant method for wall support, the large working space inside the excavation provided by a tieback anchor system has a significant construction advantage.
Numerical analyses have been used and are capable of modeling serious phases of excavation such as dewatering, soil removing process, strut installation and preloading. However, the accuracy of the numerical results mainly depends on the choice of an appropriate soil model and the calibration of the soil parameters to the analyses. Unfortunately, the soil parameters from laboratory tests are often not reliable due to sampling disturbance, preparation, and differences in boundary conditions. For this reason, field monitoring is often carried out during construction to observe the performance of the excavation stages. Meanwhile, the measured values can serve as input information of the appropriate optimization analysis to obtain a set of soil parameters such that the calculated deformation closest to the measured values. This process is referred as feedback analysis. Ou and Tang (1994) employed optimization techniques to determine soil parameters for finite element analysis in deep excavation. Chi et al (1999) developed an information construction approach that the optimization algorithm was used to back-analyze soil parameters, and back-analyzed soil parameters were then used to predict the wall deflection of next excavation stage.
The use of field instrumentation results to back-calculate the soil parameters allowing the engineer to account for the global response of a braced excavation system. This paper aims to evaluate the soil stiffness parameters of the alluvial Taipei soil for tie-back diaphragm wall. The selected case history was recorded in Liao and Hsieh (2002). The parameter will be back analyzed by using finite element method (FEM).
2. Projects Description
TCAC building
National Taiwan University Hospital
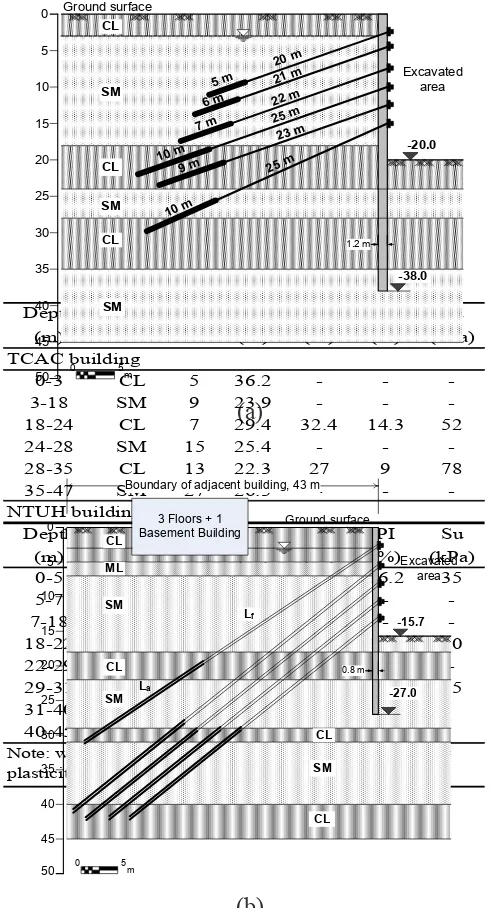
Figure 1. Soil profile and tied-back excavation wall of the TCAC site (a) and NTUH site (b)
The National Taiwan University Hospital (NTUH) was a 15-story high building with four levels of basement. The excavation of the basement of NTUH was about 180 m long, 140 m wide, and 15.7 m deep. The diaphragm wall was 0.8 m thick and 27 m deep; the anchor system had five tieback levels anchors (Figure 1b). The design loads of different tieback levels varied from 400 to 600 kN (Table 1). The groundwater table was
Table 1. Subsoil properties.
(a) plasticity index, Su = undrained shear strength
Soils
Boundary of adjacent building, 43 m
Wall construction sequence and wall deformation
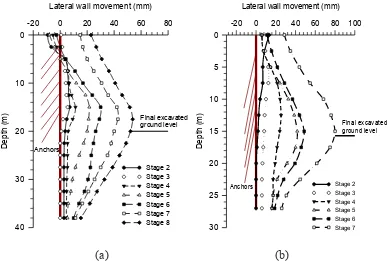
Diaphragm wall and multilevel tieback anchors were used to support the cut and tied-back excavation. The depth of each excavation stage is usually 50 80 cm deeper than the tieback level. The total of construction stage has been done in 8 and 7 stages respective for TCAC and NTUH excavation project. The groundwater table inside the excavation wall became lower with the depth of the excavation, but the groundwater table outside did not lower during excavation of the basement or anchor installation by means dewatering in the excavation area after each excavation stage. The lateral wall movement (Figure 2) was measured after installation of the tieback anchors at each excavation stage and corrected for bottom movement of the inclinometer casing (Liao and Hsieh 2002).
(a) (b)
Figure 2. Profiles of lateral wall movement of tied-back excavation sites (a) TCAC, (b) NTUH
3. Numerical Simulation
3.1.Model and Soil Parameters Used
To simulate the case study, a finite element based computer program PLAXIS 8.x
was used in this study. The soil was modeled as Mohr-Coulomb model while the elastic
perfectly-plastic was chosen to model for design the diaphragm wall and the anchor
(Liao and Hsieh 2002; Vermer and Brinkgreeve 2002). According to the basic design, the clay deposits are modeled as undrained behavior while silty-sand behaves in a drained condition. The diaphragm wall was modeled as beam element. The thickness of the wall was 1.2 m. The free length of tie-back anchors were simulated as "node to node" spring while the fixed underreamed length was simulated as slender object with axial stiffness (EA) that only sustained tensile strength. The axial stiffness of the
anchors were set to 1.1 x 10⁸ kN/m and 1.63 x 10⁸ kN/m for free length and undereamed
respectively. Since the diaphragm wall is assumed as impermeable materials, so, in
PLAXIS, the soil interface is modeled as impermeable. A beam element method
together with an elastic perfect plastic soil model was used to design the diaphragm wall and the tieback anchor system. Some of the soil parameter and anchor parameter are provided in Table 1.
The strength parameter such as Modulus of Elasticity, cohesion and friction angle of soil are back-analysed based on the filed monitoring of the wall movement as Figure 2. For this purpose, the modulus of elasticity can be predicted from the relationship as written in Equation (1) to (4). For saturated clay, the modulus of elasticity can be estimated from the undrained shear strength as follow:
Lateral wall movement (mm) -20 0 20 40 60 80
500 ~ 800 u
u
E
S (1)
where, Eu is undrained modulus of elasticity and Su is undrained shear strength.
For silty sandy, the soil stiffness is estimated based on the shear wave velocity and SPT N correlation.
0.502
65.58 s
V N (2)
2
s
G V (3)
2 1
s
E G (4)
where,
Es = Youn
Vs = shear wave velocity (m/s),
N = SPT-N value,
G = bulk modulus,
= soil density (kg/m3),
= coefficient = 0.3 ~ 0.5.
The friction angle for silty sand is given in Equation (5) as proposed by Ohsaki which were quoted by McGregor and Duncan (1998).
= (20N)0.5 + 15 (5)
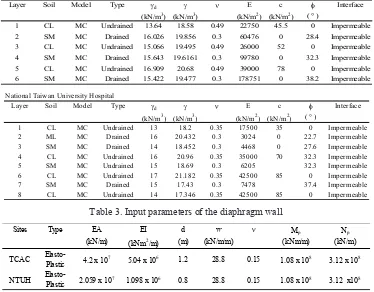
Table 2 and 3 presents input parameters of soil properties and diaphragm wall for back-analysis.
4. Results and Discussion
4.1.Lateral wall movement
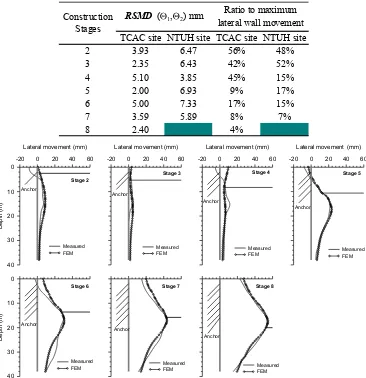
The back-analysed results presented in this paper was relative lateral displacement of the walls due to excavation. In the back analysis, the soil stiffness which has considerable effect on the wall movement has been change by several iteration until the results closed to the measurement in the field. The parameter used in Tabel 2 to 3 were the final iteration which the simulation results was closer to the measured wall movement. The lateral movement of wall from finite element method PLAXIS analysis is shown in Figure 3 and 4 respectively for TCAC and NTUH sites.
It is observed that the maximum horizontal movement occurred at around the bottom of each excavation stage. General speaking, the FEM results match the measured profile well for all stages of excavation except for slight over-estimated of the wall top displacement. In view of good match between the measured and back-analyses wall relative lateral displacement profile, it is evident that the alluvial Taipei soils can be properly modeled using the Mohr-Coulomb model for the tie-back deep excavation
Table 2. Input parameters of soil properties for back-analysis
Table 3. Input parameters of the diaphragm wall
Taipei County Administration Center
Layer Soil Model Type d E c Interface
(kN/m3) (kN/m3) (kN/m2) (kN/m2) ( ° )
1 CL MC Undrained 13.64 18.58 0.49 22750 45.5 0 Impermeable
2 SM MC Drained 16.026 19.856 0.3 60476 0 28.4 Impermeable
3 CL MC Undrained 15.066 19.495 0.49 26000 52 0 Impermeable
4 SM MC Drained 15.643 19.6161 0.3 99780 0 32.3 Impermeable
5 CL MC Undrained 16.909 20.68 0.49 39000 78 0 Impermeable
6 SM MC Drained 15.422 19.477 0.3 178751 0 38.2 Impermeable
National Taiwan University Hospital
Layer Soil Model Type d E c Interface
(kN/m3) (kN/m3) (kN/m2) (kN/m2) ( ° )
1 CL MC Undrained 13 18.2 0.35 17500 35 0 Impermeable
2 ML MC Drained 16 20.432 0.3 3024 0 22.7 Impermeable
3 SM MC Drained 14 18.452 0.3 4468 0 27.6 Impermeable
4 CL MC Undrained 16 20.96 0.35 35000 70 32.3 Impermeable
5 SM MC Undrained 15 18.69 0.3 6205 32.3 Impermeable
6 CL MC Undrained 17 21.182 0.35 42500 85 0 Impermeable
7 SM MC Drained 15 17.43 0.3 7478 37.4 Impermeable
8 CL MC Undrained 14 17.346 0.35 42500 85 0 Impermeable
Sites Type EA EI d w Mp Np
(kN/m) (kNm2
/m) (m) (kN/m/m) (kNm/m) (kN/m)
TCAC
Elasto-Plastic 4.2 x 10
7
5.04 x 10⁶ 1.2 28.8 0.15 1.08 x 10⁸ 3.12 x 10⁸
NTUH
Elasto-Plastic 2.059 x 10 7
problem. The mismatch results can be explained that in the finite element analysis, the deformation of each nodal (nodal displacement at a point, [q]) is formulated as Equation (6).
[q] = [K] [P]
(6)
where the stiffness matrix, [K], is a function of Es and . Therefore, determination of both parameters will affect in the deformation analysis (Das 1997). Larger Es used will
result in smaller deformation the [K] matrix is higher; the soil tends to have higher
stiffness. Mair (1993) stated that the most important soil parameter is the stiffness of
Es). The Es value is very important especially for the soft clay layer that led to induce the lateral wall movement and ground settlement during excavation works. Secondly, the deviation of result may be generated from lack of information of the soil parameter involved properties of the diaphragm wall, and tied-back anchor. Some of assumption of data used as input parameters are not representative of the real behavior. However, some soil parameter suppose to be closer to the real properties e.g. unit weight, since those are derived from the relevance data such as in situ water content.
In the problem analyzed, the lateral movement at the top and the bottom of the wall is closer to the measured movement at the final stage as shown in Figure 3 and 4. However, the movement at the top of excavation is not closer to the measurement. It is probably caused by the stiffness of the diaphragm wall and the properties of the anchors. Since the wall and anchor are modeled as elastic perfectly plastic, it need a yield stress data and maximum force (for anchor) data. It was observed from the figures that diffulties were faced to model the diaphragm wall behavior at the initial stage of excavation and tied-back installation. Vaziri (1996) studied that behavior was arised due to the soil behave linearly elastically, as long as the pressures correspond to stress levels lying between the limits. Where the lateral movement of the wall correspond to a pressure outside of the allowable limits.
To evaluate the numerical model, root mean square deviation (RSMD) was
calcluated between the maximum measured and calculated lateral movement of the wall at each stages. The RSMD is calculted using Equation (7), as following:
2
1 1, 2,
1, 2
N
i i i
RSMD
N
(7)
where, 1 and 2 are measured and calculated wall movement at particular depth ( 1 =
Table 4 presents the RSMD of the lateral movement for both TCAC and NTUH sites.
The calculation of RSMD in Table 4 indicates that the deviation between the measured
and numerical simulation is smaller for final stage of excavation. The deviation of lateral wall movement for TCAC site varies from 2.4 mm to 5.10 mm, whilst the
deviation is 5.89 mm to 7.33 mm for NTUH site. If the RSMD of the lateral movement
is compared to the maximum wall movement at each stages, it is observed that the deviation is larger at initial stages for both studied sites. This behavior was also observed by Phienwej and Gan (2003). Burland (1989) stated this condition due to unloading-stress effect and non-linear stress-strain behavior of soils. A small strain modulus value of soils should be adopted in the linear elasto-plastic continuum finite element analysis.
Figure 3. Comparison of the lateral movement of tied-back wall between field measurement and FEM for TCAC building
Stage 3 Stage 4
Lateral movement (mm) -20 0 20 40 60
Table 4. The RSMD of the lateral wall movement
TCAC site NTUH site TCAC site NTUH site
Figure 4. Comparison of the lateral movement of tied-back wall between field measurement and FEM for NTUH building
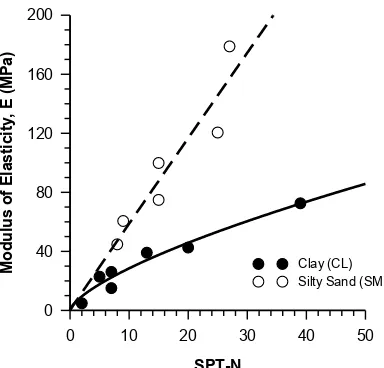
Figure 5. Correlation between Es and SPT-N for alluvial soil in Taipei
4.2. Correlations between Es and SPT-N
The standard penetration tests (SPT) commonly carried out at site were correlated to obtain strength and stiffness parameters of the alluvial soils for design because it is economic and easily available. Usually the correlation was based on the contention that the SPT-N values, which were obtained extensively at site. From the FEM back-analysis, the estimated Young's modulus of elasticity (Es) varied with the SPT-N value.
Lateral movement (mm)
Stage 2 Stage 3 Stage 4
Hence, the correllation is shown in Figure 5. For practical pruposes, the suggested
correlations between SPT- Es) used in
-For clay layer:
0.685
5.878 s
E N (8a)
For silty sand layer:
0.993
5.959 s
E N (8b)
where, N is SPT value, and the unit of Young's modulus of elasticity (Es) is in MPa.
5. Conclusions
In conclusion, the displacement patterns of the walls and ground surface settlement profile obtained from the FEM back-analyses agree reasonably well with the measured values. Therefore, it is evident that alluvial soils in Taipei can be properly modeled
-purposes, the Young's modulus of elasticity (Es) of the alluvial soil in Taipei can be
predicted from SPT-N values, which is 5.878 0.685
s
E N for clay and 5.959 0.993
s
E N for
silty-sand deposit. The simulation results show that the maximum horizontal movement occurred at around the bottom of wall. At the final stage of construction, the root mean
square deviation (RSMD) between measured and calculated the wall movement was 4%
and 7% respectively at TCAC and NTUH sites
Acknowledgement
The first author thanks to the Dean Office of Research, National Taiwan University of Science and Technology (Taiwan Tech) for the financial support during the postdoctoral fellowship in 2008 at Taiwan Tech.
References
Burland JB (1989). Small is beautiful-the stiffness of soils at small strains. Canadian Geotechnical Journal, Vol. 26, pp. 499-516.
Chi SY, Chern JC, and Wang CC (1999). Information construction Approach for deep excavation. International Symposium Geotechnical Aspects of Underground in Soft Groun 9).Tokyo, Japan, 19-21 July 1999.pp. 471-476.
Das BM (1997). Advanced Soil Mechanics, 2nd Edtition, Taylor & Francis, Ch. 1.
Liao HJ, and Hsieh PG (2002). Tied-Back Excavations in Alluvial Soil of Taipei, Journal of Geotechnical and Geoenvironmental Engineering.Vol. 128.No. 5.pp. 435 441.
McGregor JA, and Duncan JM (1998). Performance and Use of the Standard Penetration Test in Geotechnical Engineering Practice, Report of a study performed by the Virginia Tech Center for Geotechnical Practice and Research, Virginia Polytechnic Institute and State University, VA, USA.
Ou CY, and Tang YG (1994). Soil parameter determination for deep excavation analysis by optimization. Journal of the Chinese Institute of Engineers.Vol. 17(5).pp. 671-688.
Phienwej N, and Gan CH (2003). Characteristics of ground movement in deep excavations with concrete diaphragm walls in Bangkok sois and their prediction. Geotechnical Engineering Journal, SEAGS.Vol. 34(4). pp. 167-175.
Vaziri HH (1996). Numerical study of parameters influencing the response of flexible retaining walls. Canadian Geotechnical Journal. Vol. 33 (2). pp. 290-308.
