QUANTIFICATION OF TUNA FISH TARGET STRENGTH USING QUANTITATIVE ECHO SOUNDER
Henry M. Manik
Department of Marine Science and Technology, Faculty of Fisheries and Marine Science, Bogor Agricultural University, Kampus IPB Darmaga Bogor 16680,
INDONESIA; [email protected]
Abstract
A preliminary research programme was carried out in order to study the acoustic wave reflection or target strength (TS) of tuna fish using a quantitative echo sounder (QES). The relationships between TS to fork length (FL) and swimbladder volume, for bigeye tuna (Thunnus obesus) and yellowfin tuna (T. albacares) are investigated. The TS of bigeye tuna was about 3 dB higher than yellowfin tuna when comparing species at the same size. The result can be correlated to the swimbladder volume difference between species. The relationship between TS and swimbladder volume was quantified for both species.
Keywords: tuna fish, target strength, quantitative echo sounder
1. INTRODUCTION
Information of target-strength (TS) is of prime importance for hydroacoustic work such as stock assessment and behavior studies. The target strength is defined by the intensities of the incident and the backscattered waves. In principle it is possible to compute the target strength of fish body which contribute to the echo, notably the swimblader. The scattering of sound by fish is too complicated for useful target strength values to be derived from theoretical model. For practical purposes, it is necessary to measure the target strength by experiment. Target strength value depends on internal physiology of fish, swimbladder, fish behaviour and orientation of the body with respect to the transmitted beam (Foote, 1987, Furusawa, 1988). Recent investigations have conducted a tuna fish TS measurement at 38 kHz. The split beam hydroacoustic method was applied
to tuna which were vertically distributed over a large range of depths. The results of this method can be compiled to obtain a first range of TS for bigeye tuna (Thunnus obesus) and yellowfin tuna (T.albacares) of juvenile and adult sizes (Table 1).
The swimbladder is responsible for 90–95% of the acoustic backscattering energy (Foote, 1980). Therefore, the study of the relationships between TS and the swimbladder volume can improve our knowledge of tuna physiology and swimbladder volume compensation. Here, we reported preliminary relationships between TS and both fish length and swimbladder volume.
2. METHOD
2.1. Measurement of Target-strength
Hydroacoustic data were collected by using a quantitative echo sounder (QES) with operating frequency of 38 kHz, beam angle of 6.9o and pulse duration of 0.6 ms employed in seawater column up to 500 m in depth. The QES acoustic transmission on-axis and off-axis calibration was done by using the standard procedure (Manik, 2006). The Matlab program was constructed to extract single targets selected by the echo sounder. The target strength (TS) used in this paper are logarithmic expression of the result of backscattering cross section (σbs) measured in situ, by using formula
TS = 10 log (σbs). . Target-strength
values were quantified on single fish.
3. RESULT AND DISCUSSION
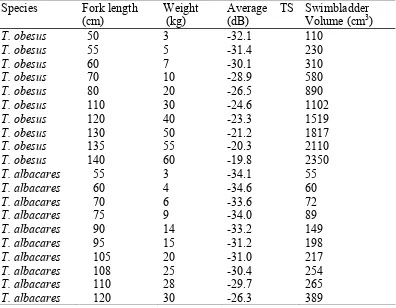
The fish fork length and weight were measured for tuna fish which were hauled aboard deck vessel without causing injury, and the obtained TS values were presented in Table 1.
3.1. Estimation of Swimblader
Volume of Tuna
[image:2.595.102.498.445.753.2]Tuna specimens were used to determine the relationships between swimbladder volume (SBV) versus fork length (FL) for tuna fish which were caught by longline fishing gears in seawater off Pelabuhan Ratu. Freshly caught fishes fork length were measured to the nearest centimetre unit. The swimbladder volume was measured for 10 yellowfin tuna and 10 bigeye tuna
Table 1. Measurement of Target-strength value for bigeye tuna (Thunnus obesus) and yellowfin (Thunnus albacares)
Species Fork length (cm) Weight (kg) Average TS (dB) Swimbladder Volume (cm3)
fishes. The inflated swimbladder were excised carefully from the abdominal cavity and then it was frozen. A small incision was made on the anterior part of the frozen swimbladder, then it was filled with seawater until it burst. The volume of water was measured to the nearest 10 ml unit. The results of measured swimbladder volume are shown in Table 1.
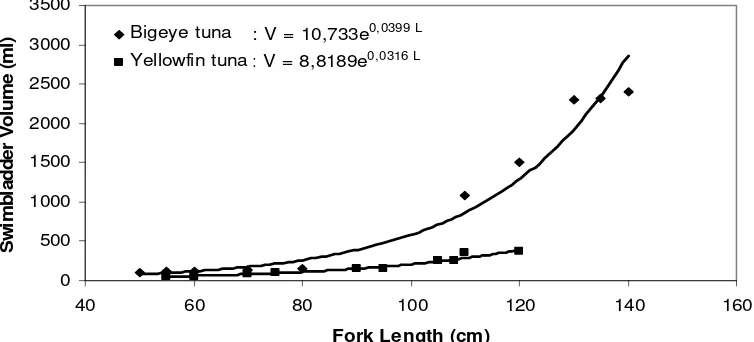
The relationships between fork length and swimbladder volume for bigeye and yellowfin tuna are shown in Figure 1. It is clearly indicated that the swimbladder volume is significantly greater for bigeye than for yellowfin tuna. The variation of target strength with tuna fork length (cm) for bigeye and yellowfin tuna are shown in Figure 2 and indicates its best fit regression function.
: V = 10,733e0,0399 L : V = 8,8189e0,0316 L
0 500 1000 1500 2000 2500 3000 3500
40 60 80 100 120 140 160
Fork Length (cm)
S
w
im
b
la
d
d
e
r V
o
lu
m
e
(
m
l) Bigeye tuna
[image:3.595.100.477.265.436.2]Yellowfin tuna
[image:3.595.98.480.489.688.2]Figure 1. Relationships between fork length and swimbladder volume for bigeye and yellowfin tuna. The fitted lines are the regression function.
3.2. Relationships of Target-strength and Fish Length
The proposed relationships of tuna fish TS versus fish fork length are only preliminary, because of the small number of observations (Table 1). There are also influence of the stochastic nature of target-strength and the possible error in estimating the fish length which were not hauled abroad. It is commonly assumed that TS depends on fish size according to the relationship: TS = a log FL+ b, where a and b are constants for a species and (in) a given frequency and FL is fork length (cm). Therefore, in this experiment the following relationships were obtained (Fig. 2.) which were applied for 60–120 cm yellowfin and 50– 140 cm bigeye tuna fishes:
Bigeye tuna: TS = 21,02 Log (FL) - 77,67
Yellowfin tuna: TS = 19,80 Log (FL) - 68,82
In case of in situ target strength measurements, the constant value of a is generally close to 20 (MacLennan and Simmonds (1992). Indeed, the acoustic
cross section ( is
proportional to the horizontal section of the organs which contributes to the echo. This area should be proportional to the square of fish length (FL2) and that the TS is defined by 20 log FL + b. However, in case of tuna fish, the TS values increase more faster as the size increase.
) 10 .
4π (TS/10)
σ =
In this experiment, bigeye tuna has TS higher by 3 dB approximately than that of yellowfin tuna of the same size. This difference is very significant given the similarity of the two species both in terms of their fish shape and the
density of their flesh.
3.3. Relationships of Target-strength to Swimbladder Volume
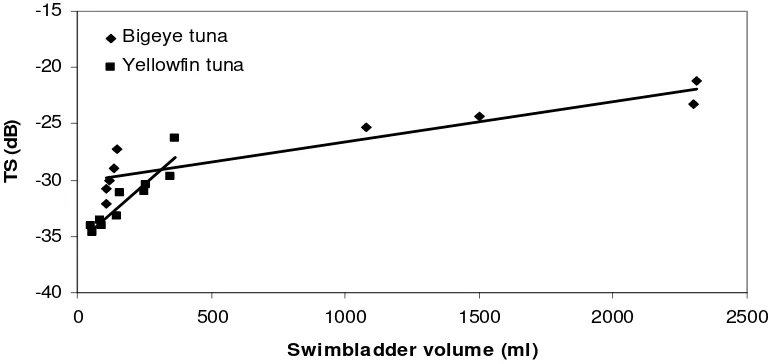
For a given length bigeye tuna has a swimbladder that is longer than that of yellowfin tuna (Freeze and Vanselous, 1985). The difference of swimbladder length can explain the observed difference in the relationship of TS and fish length for the species. However, if we represent TS according to the volume of swimbladder, we observe instead a single trajectory for each species (Figure 3), since TS increases logarithmically with the swimbladder volume (SBV, in ml).
Thus the difference between species is not observed if the swimbladder volume is taken into account. This following equations are based on our experimental observations, they are:
Bigeye: TS = 0,0036 (SBV) - 30,16
Yellowfin: TS = 0,0209 (SBV) - 35,59
-40
0 500 1000 1500 2000
Swimbladder volume (ml) -35
-30 -25 -20 -15
2500
TS
(dB
)
[image:5.595.99.484.97.279.2]Bigeye tuna Yellowfin tuna
Figure 3. Variation of target strength with tuna swimbladder volume (ml) for bigeye and yellowfin tuna.
with depth are weak, which suggests that there must be some compensation of gas volume with changing depth. More than the volume itself, though, it is the cross-section which contributes to TS (MacLennan and Simmonds, 1992). The swimbladder is able to to compress uniformly in volume because the muscle and bone will maintain the shape of the upper surface area. Therefore, the swimbladder may never be adapted precisely to depth at a given time. The future research should take more account of the surface area of the swimbladder normal to the insonification of acoustic wave.
Even the small number of fish measured in situ condition, it is still proved empirically the validation of TS measurements for the estimation of fish size. Figure 3 also confirms our assumption that tuna fish are very effective in controlling the volume of their swimbladders. This is due to the swimbladder which is always containing gas to maintain fish swimming depth, and the surface area of swimbladder determined the insonification for sound reflectivity. The swimbladder played the
dominant role for backscattered energy by fish. However, it was difficult to measure the rate of gas secretion into the swimbladder at the time of measurements.
4. CONCLUSION
The conclusion of this research were: (1) Quantification of tuna fish target strength is depends on fish length and swimbladder volume; (2) A bigeye tuna has target strength higher by approximately 3 dB than that of a yellow fin tuna of the same size; and (3) These results also confirm tuna fish are very effective in controlling the volume of their swimbladders.
Acknowledgements
References
Furusawa, M. 1998. Prolate spheroidal models for predicting general trends of fish target strength. J. Acoust. Soc. Japan (E), 9, 13-24.
Freeze, D. S., and Vanselous, T. M. 1985. Evaluation of hydro-acoustics as a means to assess spawning stocks of bluefin tuna in Gulf of Mexico. SCRS/85/34: 203–208.
Foote, K. G. 1980. Importance of the swimbladder in acoustic scattering by fish: A comparison of gadoid and mackerel.
Foote, K.G. 1987. Fish target strength for use in echo integrator surveys. J. Acoust. Soc. Am, 82, 981-987.
MacLennan, D. N., and Simmonds, E. J. 1992. Fisheries acoustics. Chapman and Hall, London. 325 pp.
Manik, H.M. 2006. Study on Acoustic Quantification of Sea Bottom using Quantitative Echo Sounder. Ph.D Dissertation. Tokyo University of Marine Science and Technology, Japan. 187 p.