CHAPTER II LITERATURE REVIEW
2.1 Market Efficiency
Market efficiency is one of the most important topics in finance and the subject of numerous studies. An efficient market is the term used to describe a market where investors cannot outperform their rivals by generating abnormal risk-adjusted returns in a consistent manner. Ideally, a perfectly efficient capital market is “a market in which firms can make production-investment decisions and
investors can choose among the securities that represent ownership of firms’
activities under the assumption that security prices at any time fully reflect all avaiable information” (Fama, 1970: 383).
Fama (1965, 1970, and 1991) reviews the empirical work on the random walk of assets prices and introduces different forms of market efficiency under the efficient market hypothesis (EMH) based on the manner in which different types of information are reflected in asset prices. According to Fama (1965), the level of market efficiency can be divided into three forms: the weak form, semi-strong form, and strong form. Each form of the EMH has the ability to rule out the possibilities of consistent outperformance by a certain group of investors who use certain type of information as the tool in trading activities.
1. Weak Form Efficient Market Hypothesis
The weak-form assumes that current stock prices fully reflect all security market information, including the historical sequence of prices, rates of return, trading volume data, and other market-generated information. This implies that the past rates of return and other market data should have no relationship with future rates of return.
2. Semi-Strong Form Efficient Market Hypothesis
The semi-strong form efficient market hypothesis asserts that security prices adjust rapidly to the release of all public information; that is, current security prices fully reflect all public information. This implies that decision made on new information after it is public should not lead to above-average risk-adjusted profits from those transaction.
3. Strong Form Efficient Market Hypothesis
In the weak-form version of the EMH, assets prices fully reflect historical price patterns, in the semi-strong form of EMH assets prices reflect all publicly avaiable information such as corporate earnings, share splits, etc. On the other hand, when a market is categorized as being strong form efficient, company insiders do not have monopolistic access to information relevant for price information, and hence inside information does not exist in such a market.
Pant and Bishnoi (2002) tested RWH using Nifty, NSE-50, Sensex, BSE-100 and BSE-200 during April 1996-June 2001. The Unit root test strongly accepted the null hypothesis of random walk for all indices, whereas it was rejected using variance ratio test. Hasan (2004) tested RWH for Dhaka stock exchange using daily data over period of 11 years. Various econometric techniques were used for analysis and it was concluded that indices on Dhaka stock exchange were not weak form efficient (WFE). Ahmad et al. (2006) attempted to seek evidence for weak form market hypothesis using daily data of
NSE’s Nifty and BSE’s Sensex for the period of 1999-2004. They rejected RWH
(2010) tried to examine the impact of recent financial crisis on efficiency of Chinese stock market for period of six years, divided into two sub-periods by applying Runs test, Variance ratio test, Durbin-Watson test and Unit root test and concluded that the Chinese stock market was WFE and global financial crisis has no significant impact on efficiency of Chinese stock market. Dixit et al. (2010) examined the informational efficiency of S&P CNX Nifty Index options for Indian securities market for the period of six years starting from June 2001 to June 2007 using GARCH models and found the violation of efficient market hypothesis for Indian market. Jain et al. (2013) studied Indian capital market during the period of global crisis for random walk. They have used daily closing data from S&P CNX Nifty, BSE, CNX 100, S&P CNX 500 from April 2005 to March 2010 and analyzed it using various parametric and non-parametric tests. The results obtained indicated that Indian market was efficient in weak form.
2.2 Market Integration
period (1925-1929), whereas no stationary relationship was found during post-crash period. Masih and Masih (1997) assessed linkages among six major world stock markets for pre and post-1987 crash. The results indicated that the crash does not affect leading role played by US stock market over other markets and German and British markets seemed to have become more dependent on other markets over post-crash period as compared to pre-crash era.
Masih and Masih (1999) again examined dynamic causal linkages among four developed and four South Asian emerging stock markets for the period of five years. The results confirmed the existence of significant short and long-term relationship between developed and emerging markets. Yang et al. (2003) verified the relationship among the five largest emerging African stock markets and the US market. The evidences of both long-run and short-run causal linkages were found among these Jeon and Jang (2004) examined the inter-relationship between stock prices in USA and Korea by applying Vector Autoregression model to daily stock prices. They found that US stock market plays leading role over Korean market at every level of aggregation, while the reverse direction of influence was not found in the study. Ahmad et al. (2005) examined the co-movements of Indian market with US and Japanese stock market and found that there was no long-term relationship of Indian equity market with US and Japanese equity market.
US stock market due to a growing proportion of bilateral trade between Malaysia and Japan during this period. After analyzing the stock markets of 23 different countries, Mukherjee and Mishra (2007) identified increasing tendency of integration among the markets and discovered that countries of same region are found to be more integrated than others. Jawadi and Arouri (2008) verified the integration for American and French stock markets for short and long-term and their results provide strong evidence of integration between American and French stock markets.
2.3Link between Market Efficiency and Market Integration
Lence and Falk (2005) state in their study that the co-integration test is not informative toward market efficiency and market integration and vice versa. It is stated that market efficiency, market integration, and co-integrated prices are independent restriction in condition of the equilibrium prices, which are unit root. Previously, a similiar finding was proposed by Dwyer and Wallace, they showed that there is no link between efficiency and co-integration when random walk is replaced with no-arbitrage condition. A contradictory result was reported in Chan et al. (1997), which examined 18 national equity markets. They showed that all markets are efficient individually and few of the showed evidence of co-integration with others, which means that an absence of linkage between market efficiency and market integration is not categorical. Conto and Navaro (2011) studied the market integration and financial efficiency of the Colombian stock market. their subsequent regression analysis reports a similiar trend between those measures as well as a significant indicator of Colombian stock market to explain 13.36% of variability in the financial efficiency.
Another study by Hooy and Lim’s (2013) doing the direct empirical study
between market integration and informational efficiency. They consider data from 49 national stock markets, and empirical results show robust evidence supporting the hypothesis that the level of market integration is significantly and positively related to the degree of informational efficiency.
policies in further integrating emerging markets. This is consistent with the findings of Morck et al. (2000) and Lim and Brooks (2010) which suggest on the importance of institutional reforms for the efficient functioning of stock markets.
Through market efficiency is closely related with the integration literature, it is worth highlighting that market integration and informational efficiency have remained separate subjects in finance, only few studies that including two different subject in their studies.
2.4 Economic Condition of The Top Ten Most Competitive Asia-Pacific Countries
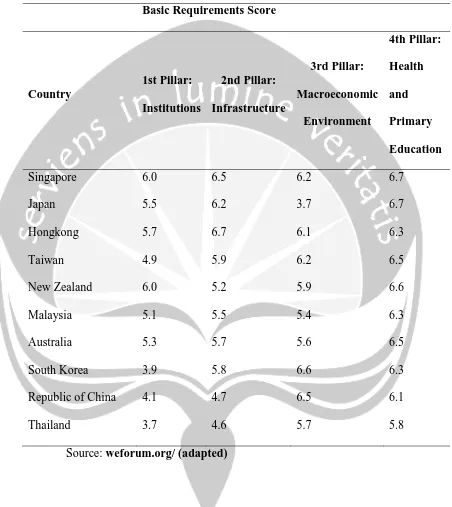
As mentioned in the first chapter, the World Economic Forum has determine ten competitive Asia-Pacific countries is chosen by the performance of the economics, the development of the markets, the condition of the competitiveness including governance, infrastructure, education, innovation, and the market condition. The countries also chosen by the stability of the market in each countries. The World Economic Forum use twelve pillars for measuring the competitiveness index. The twelve pillars divided into three group: basic requirements, efficiency enhancers, and innovation and sophistication factors.
the pillar is innovation and sophistication that including business innovation and sophistication.
The first pillar, institutions, is determined by the legal and administrative framework within which individuals, firms, and governments to interact to generate wealth. The importance of a sound and fair institutional environment has become all the more apparent during the recent economic and financial crisis. The quality of institutions has a strong bearing on competitiveness and growth. The quality of institutions may influences investment decisions and the organization of production and plays a key role in the ways which the societies distribute the benefits and bear the costs of development strategies and policies.
The second pillar, infrastructure, should be efficient because the efficient infrastructure is critical for ensuring the effective functioning of the economy, as it is and important factor in determining the location of economic activity and the kinds of activities or sectors that can develop within a country. A well-developed infrastructure, such as transport and communications may reduces effect of distance between regions, integrating the national market and connecting it at low cost to markets in other countries and regions. The quality and extensiveness of infrastructure may significantly impact economic growth and reduce some inequalities and poverty.
the overall competitiveness of a country. It is very important that this pillar evaluates the stability of the macroeconomic environment so it does not directly take into account the way in which public accounts are managed by the government.
The last pillar in basic requirements group is health and primary education. The World Economic Forum stated that a healthy workforce is vital to a country’s competitiveness and productivity. Poor health leads to significant
costs to business, as sick workers are often absent or operate at lower levels of efficiency. This pillar also take account of the quantity and quality of the basic education received by the population, which is increasingly important in today’s
economy. Basic education may increases the efficiency of each individual worker.
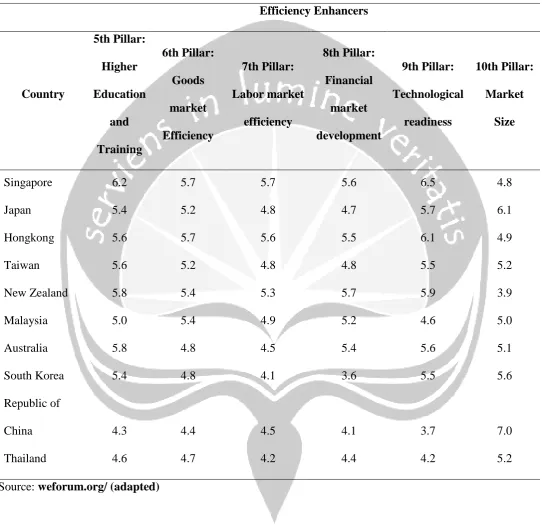
Now move to the second group, efficiency enhancers. The fifth pillar or the first pillar on efficiency enhancers is higher education and training. The quality of higher education and training is very crucial for economies that want to move up the value chain beyond simple production processes and products. Today’s globalizing economy requires countries to nurture pools of well-educated
workers who are able to perform complex tasks and adapt rapidly to their changing environment and the evolving needs of the production system. This pillar measures secondary and tertiary enrollment rates as well as the quality of education as evaluated by business leaders.
services given their particular supply and demand conditions, as well as to ensure that these goods can be most effectively traded in the economy. Healthy market competition, both domestic and foreign, is important in driving market efficiency, and thus business productivity, by ensuring that the most efficient firms, producing goods demanded by the market, are those that thrive.
The next pillar is labor market efficiency. The efficiency and flexibility of the labor market are critical for ensuring that workers are allocated to their most effective use in the economy, and provided with incentives to give their best effort in their jobs. Labor markets must therefore have the flexibility to shift workers from one economic activity to another rapidly and at low cost, and to allow for wage fluctuations without much social disruption.
The eighth pillar is financial market development. An efficient financial sector allocates the resources saved by a nation’s citizens, as well as those
entering the economy from abroad, to their most productive uses. Business investment is also critical to productivity, therefore, economies require sophisticated financial markets that can make capital avaialbe for private sector investment from such sources as loans from a sound banking sector, well-regulated securities exchanges, venture capital, and other financial products—
financial markets need appropriate regulation to protect investors and other actors in the economy at large.
technological readiness pillar measures the agility with which and economy adopts existing technologies to enhance the productivity of its industries, with specific emphasis on its capacity to fully leverage information and communication technologies in daily activities and production processes for increased efficiency.
The tenth pillar, is market size which may affect productivity since large markets allow firms to exploit economies of scale. Traditionally, the markets avaiable to firms have been constrained by national borders. In this globalization era, international markets have become a substitute for domestic markets, especially for a small countries.
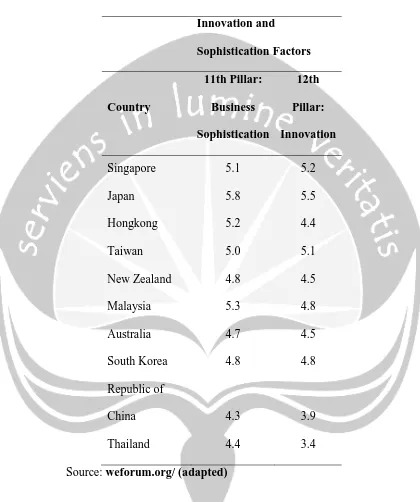
The next group is innovation and sophistication factors, that consist of the eleveth pillar, business sophistication and the twelfth pillar, innovation. The WEF stated that there is no doubt that sophisticated business practices are conducive to higher efficiency in the production of goods and services. Business sophistication concerns two elements that are intricately linked: the quality of a country’s overall business networks and the quality of individual firms’ operation
and strategies. For the final pillar of competitiveness focuses on technological innovation. Technological breakthroughs have been at the basis of many of the productivity gains that our economies have historically experienced, and it helps a country to develop their economy.
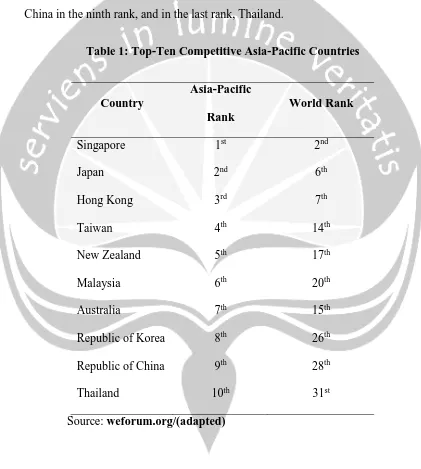
[image:13.595.87.515.206.566.2]of Asia-Pacific, because Singapore got the highest score almost in all the twelve pillars. Followed by Japan in the second rank, Hongkong in the third rank, Taiwan in the fourth rank, New Zealand in the fifth rank, Malaysia in the sixth rank, Australia in the seventh rank, Republic of Korea in the eighth rank, Republic of China in the ninth rank, and in the last rank, Thailand.
Table 1: Top-Ten Competitive Asia-Pacific Countries
Country
Asia-Pacific Rank
World Rank
Singapore 1st 2nd
Japan 2nd 6th
Hong Kong 3rd 7th
Taiwan 4th 14th
New Zealand 5th 17th
Malaysia 6th 20th
Australia 7th 15th
Republic of Korea 8th 26th
Republic of China 9th 28th
Thailand 10th 31st
Table 2: Basic Requirements Score
Basic Requirements Score
Country
1st Pillar: Institutions
2nd Pillar: Infrastructure
3rd Pillar: Macroeconomic
Environment
4th Pillar: Health and Primary Education
Singapore 6.0 6.5 6.2 6.7
Japan 5.5 6.2 3.7 6.7
Hongkong 5.7 6.7 6.1 6.3
Taiwan 4.9 5.9 6.2 6.5
New Zealand 6.0 5.2 5.9 6.6
Malaysia 5.1 5.5 5.4 6.3
Australia 5.3 5.7 5.6 6.5
South Korea 3.9 5.8 6.6 6.3
Republic of China 4.1 4.7 6.5 6.1
Thailand 3.7 4.6 5.7 5.8
Table 3: Efficiency Enhancers Efficiency Enhancers Country 5th Pillar: Higher Education and Training 6th Pillar: Goods market Efficiency 7th Pillar: Labor market efficiency 8th Pillar: Financial market development 9th Pillar: Technological readiness 10th Pillar: Market Size
Singapore 6.2 5.7 5.7 5.6 6.5 4.8
Japan 5.4 5.2 4.8 4.7 5.7 6.1
Hongkong 5.6 5.7 5.6 5.5 6.1 4.9
Taiwan 5.6 5.2 4.8 4.8 5.5 5.2
New Zealand 5.8 5.4 5.3 5.7 5.9 3.9
Malaysia 5.0 5.4 4.9 5.2 4.6 5.0
Australia 5.8 4.8 4.5 5.4 5.6 5.1
South Korea 5.4 4.8 4.1 3.6 5.5 5.6
Republic of
China 4.3 4.4 4.5 4.1 3.7 7.0
Thailand 4.6 4.7 4.2 4.4 4.2 5.2
Table 4: Innovation and Sophistication
Innovation and
Sophistication Factors
Country
11th Pillar: Business Sophistication
12th Pillar: Innovation
Singapore 5.1 5.2
Japan 5.8 5.5
Hongkong 5.2 4.4
Taiwan 5.0 5.1
New Zealand 4.8 4.5
Malaysia 5.3 4.8
Australia 4.7 4.5
South Korea 4.8 4.8
Republic of
China 4.3 3.9
Thailand 4.4 3.4
Source: weforum.org/ (adapted)
market efficiency and financial market development pillars. Its economy can also rely on a sound macroeconomic environment and fiscal management, and this country also has a strong focus on education and becoming more innovative.
In the second rank, Japan post the largest improvement of the top ten economies. Japan continues a major competitive edge in business sophistication, but severe macroeconomic challenges drag down its overall performance, because for the past five years, its budget deficit has been hovering around 10% of GDP, one of the highest ratios in the world, and public debt remains high.
Hong Kong, in the third ranks, tops in the infrastructure pillar, reflecting the outstanding quality of its transport systems. Hong Kong has an efficient, trustworthy and stable financial market, and its dynamic and efficient goods and labour markets further contribute to its excellent overall positioning. It also one of the most open economies in the world, and has a high degree of technological readiness. According to the score of each pillars, Hong Kong must improve on higher education and innovation.
The third of the Asian Tigers, Taiwan, placed the fourth ranks, for having a stable performance oveer the past six years, noted in its capacity to innovate, highly efficiency goods markets, world-class infrastructure and strong higher education. Based on the scores, Taiwan will need to strengthen its institutional framework, which is undermined by inefficiency and corruption.
financial market development pillar. New Zealand boasts and excellent education system, while the efficiency of its goods and labour markets is among the highest in the world.
In the sixth place, Malaysia makes its way by increasing strong performance in financial markets pillar reflect its efforts to position itself as the leading centre of Islamic finance. Plagued by corruption and red tape, Malaysia stands out as one of the very few countries that have been relatively successful at tackling these two issues.
Australia ranks well and got the seventh place and already achieve its best performance in the financial market development pillar, with its sound banking sector. It also has a strong higher education and training sector. The macroeconomic situation has slightly deteriorated, due to an increase in its budget deficit. Overall, the quality of Australia’s public institutions is excellent, through
there are many a problem especially the rigidity of its hiring and firing practices and wage setting.
The Asian Tigers, Republic of China, has placed in the ninth ranks, made small gains on most measures of the GCI, creating a more conducive ecosystem for entrepreneurship and innovation. Problem endures in the critically important financial sector, and while the functioning of the market is improving, barriers to entry and investment rules greatly limit competition. The challenge may face is the need to create high-value jobs that will sustain rising standars of living.
The last position, Thailand, despite its prolonged political crisis, performing well on macroeconomics and the environment pillars. In 2013 Thailand almost balanced its budget, financial development, as did market efficiency. Considerable challenges remain in some areas, like market competition, governance, political and policy instability, excessive red tape, pervasive corruption, security concerns and high uncertainty around property rights seriously undermine the institutional framework. The level of trust in politicians and the level education is the lowest in the world.
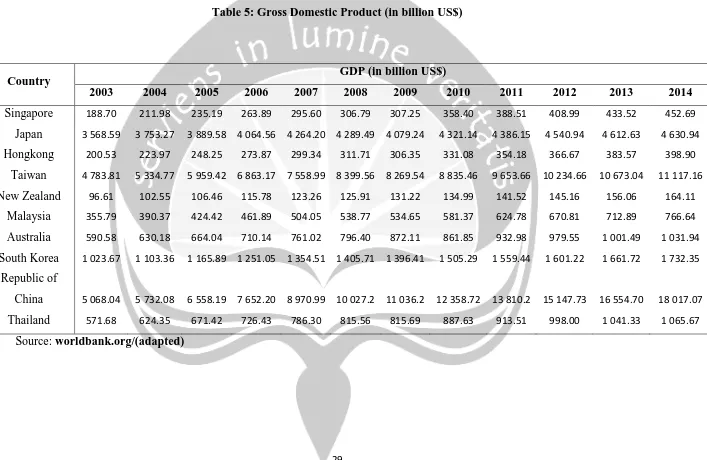
increased year by year. The other countries that has the highest GDP are Japan, Taiwan, and Republic of Korea (South Korea). Japan reached the highest GDP at 4,630.94 US Dollar on 2014. Taiwan reached the highest GDP also in 2014 by 11,117.16 US Dollar while Republic of Korea reached the highest GDP by 1,732.35 US Dollar. The lowest GDP growth reached by New Zealand, by 2003 they only got 96.61 US Dollar, and the highest amount only 164.11 US Dollar.
Table 5: Gross Domestic Product (in billion US$)
Source: worldbank.org/(adapted)
Country GDP (in billion US$)
2003 2004 2005 2006 2007 2008 2009 2010 2011 2012 2013 2014
Singapore 188.70 211.98 235.19 263.89 295.60 306.79 307.25 358.40 388.51 408.99 433.52 452.69 Japan 3 568.59 3 753.27 3 889.58 4 064.56 4 264.20 4 289.49 4 079.24 4 321.14 4 386.15 4 540.94 4 612.63 4 630.94 Hongkong 200.53 223.97 248.25 273.87 299.34 311.71 306.35 331.08 354.18 366.67 383.57 398.90
Taiwan 4 783.81 5 334.77 5 959.42 6 863.17 7 558.99 8 399.56 8 269.54 8 835.46 9 653.66 10 234.66 10 673.04 11 117.16 New Zealand 96.61 102.55 106.46 115.78 123.26 125.91 131.22 134.99 141.52 145.16 156.06 164.11
Malaysia 355.79 390.37 424.42 461.89 504.05 538.77 534.65 581.37 624.78 670.81 712.89 766.64 Australia 590.58 630.18 664.04 710.14 761.02 796.40 872.11 861.85 932.98 979.55 1 001.49 1 031.94 South Korea 1 023.67 1 103.36 1 165.89 1 251.05 1 354.51 1 405.71 1 396.41 1 505.29 1 559.44 1 601.22 1 661.72 1 732.35
Republic of
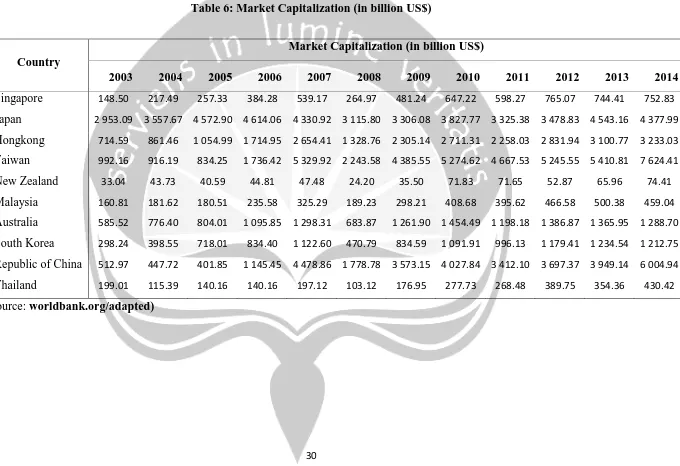
Table 6: Market Capitalization (in billion US$)
Country
Market Capitalization (in billion US$)
2.5Hypotheses Development
As the research and the objective study reflects the existence of stock market efficiency and market integration, the hypotheses enhance the approaches. Based on the background of this research, and the literature the hypotheses are formulated as the following:
• H1: There is a short-term relationship between the stock market of the top
ten competitive Asia-Pacific countries
• H2: There is a long-term relationship between the stock market of the top
ten competitive Asia-Pacific countries
• H3: There is a weak-form efficient market between the stock market of the