BEHAVIOUR AMONG YOUTH’S GENERATION IN MALACCA
FATIN NUR IZZATI BINTI AB.RAHMAN
FACTORS THAT INFLUENCING CONSUMER PURCHASING BEHAVIOUR AMONG YOUTH’S GENERATION IN MALACA
By
FATIN NUR IZZATI BINTI AB.RAHMAN
I hereby acknowledge that this project paper has been accepted as part of fulfillment for the degree of Bachelor of Technology Management (Hons) in
Technopreneurship
Signature : ...
Supervisor : ...
Date : ...
Signature : ...
Evaluator : ...
FACTORS THAT INFLUENCING CONSUMER PURCHASING BEHAVIOUR AMONG YOUTH’S GENERATION IN MALACCA
FATIN NUR IZZATI BINTI AB. RAHMAN
Report submitted in fulfilment of the requirement for the degree of Bachelor of Technology Management (Hons) in High Technology Marketing.
Faculty of Technology Management and Technopreneurship Universiti Teknikal Malaysia Melaka
DECLARATION
“I declare that this project is the result of my own research except as cited in the references. The research project has not been published for any degree and is not
concurrently submitted in candidature of any other degree.”
Signature : ...
Name : ...
ACKNOWLEDGEMENT
ABSTRACT
ABSTRAK
TABLE OF CONTENT
CHAPTER CONTENT PAGE
Tittle page 1.1 Problem Statement
1.2 Research Question 1.3 Research Objective
1.4 Scope of study
CHAPTER 2 Literature Review 2.0 Introduction
2.1 Online Shopping or Online Stores
2.2 Youth generation towards online shopping 2.3 Online Purchase Behaviour
2.4.4 Price
2.5 Theoretical Framework 2.6 Summary
19-21 21-22 22
CHAPTER 3 Research Method 3.0 Introduction 3.1 Research Design 3.2 Methodological Choice 3.3 Research Strategy 3.3.1 Hypothesis Testing 3.3.2 Questionnaire design 3.4 Primary data sources 3.5 Secondary data sources 3.6 Data analysis method 3.7 Location of research 3.8 Population and sample 3.9 Validity and Reliability 3.9.1 Validity
CHAPTER 4 Data Analysis and Discussion 4.0 Introduction
4.3 Validity and reliability test for research
4.4 Inferential analysis
4.4.1 Pearson correlation coefficient 4.5 Multiple regression analysis
4.6 Hypothesis testing 4.7 Summary
53 53-55 56-57 57-61 61 CHAPTER 5 Conclusion and Recommendations
5.0 Introduction
5.1 Limitations of Research 5.2 Conclusion of Research
5.3 Recommendation or future study
62 62 64 65
LIST OF TABLE Validity of 30 respondents for pilot test
Interpretation of reliability based on Cronbach’s alpha for Gender analysis
Age
Occupation Education
Income Distribution among respondents Online shopping experience
Kind of products you purchased through online store Times shop online
Spent online shopping product Experience online shopping Reason online shopping
Visit to retail store first before final purchase independent Descriptive statistics
Validity of 150 respondents for the research
Interpretation of reliability based on Cronbach’s alpha for150 respondents
Rules of Thumbs for interpreting correlation Result of Pearson Correlation Coefficient Summary result Pearson correlation coefficient Model summary multiple regression Analysis
4.5.2 4.6.1 4.6.2
Coefficients Multiple Regression Analysis Guidelines for interpreting hypothesis testing The overall result hypothesis testing
LIST OF FIGURE
Income Distribution among respondents Online shopping experience
Kind of products you purchased through online store Times shop online
Spent online shopping product Experience online shopping Reason online shopping
Visit to retail store first before final purchase independent
LIST OF APPENDIX
APPENDIXNUM. TITTLE PAGE
I II
CHAPTER 1
INTRODUCTION
1.0 Background Study
The internet has opened a window of opportunity to almost anyone because of its ability to make viable the conduct of business in cyberspace, or by connecting people worldwide without geographical limitations. Consumer can order goods and services virtually anywhere, 24 hours, 7 days a week without worrying about store hours, time zones, or traffic jams (Li & Gery 2000; Waldo 2000). The internet has also provides new opportunities for marketers by offering the innovative way to promote, communicate and distribute product and information to their target consumer.
According to Forouzan (2003), the “internet” can define as a collaboration of more than hundreds of thousands of interconnect network. More specifically, the internet is a collection of local, regional and national computer network that are linked together to exchange data and distributed processing task through common language and protocols (Jordan et al, 2004).
satisfaction to modern consumers seeking convenience and speed (Yu and Wu, 2007).
A mid-2005 survey by the Malaysian Communication and Multimedia Corporation (MCMC), only 9.3% of Internet users had purchased products or services through the Internet during the preceding three months. Among those who did so, airline tickets were the most popular items (43.8%) followed by books (15.6%) and music (6.8%). Amounts spent on these items were small, however, with 57.7% of transactions worth less than M$500. Moreover, it is expected Malaysian online sales will increase every year at a high growth.
According to Forrester Research (2003) the users that regularly buys the product and services online is more than 50 percent. Online shopping in Malaysia is still in the stage of infancy. Research by Gupta (1996), Klein (1998), Westland and Clark (1999), Shim et. al. (2001) found that there are 81 percent of the internet users that browse through the websites do not make a purchase of goods and services through online.
Online shopping in Malaysia is still in the stage of infancy. Research by Gupta (1996), Klein (1998), Westland and Clark (1999), and Shim et. al. (2001) found that there are 81 percent of the internet users that browse through the websites do not make a purchase of goods and services through online. According The Star Online, More Malaysians Shopping Online, the number of Malaysian people shopping online has grown by 12% in year 2011 compared to the year before (55% in 2012). E-shopping increases the number of internet users in Malaysia as it has created awareness in e-commerce as well as making consumer attracted in purchasing goods and services through the internet.
cohort it is valuable to research Generation Y market behaviour as related to the internet (Lester and Lloyd, 2005
1.1 Problem Statement
Based on Liao and Cheung (2000) “An increasing number and variety of firms and organizations are exploiting and creating business opportunities on the Internet”. Above mention statistics indicate the rapid growth in the field of virtual shopping. With this emerging field of shopping the interest of marketers is also increasing in studying what actually motivates consumers to shop online. Fierce competitions among online sellers have forced them to gain the competitive edge in the field of virtual shopping.
The popularity of online shopping is best vouched by statistics from Pos Malaysia that delivers the bulk of the purchases. Datuk Rohaiza Hashim, Pos Malaysia‟s head of Corporate Communications and Customer Care, describes the growth of e-shopping as phenomenal. Online products delivered to customers in Malacca has grown by 12% in year 2011 compared to the year before (55% in 2012). Significant increases were seen between 25-30% during Ramadan especially during the last two weeks before Hari Raya. In this study, researcher has listed a few major factors influencing purchasing behaviour online among youth‟s in Malacca.
In important to competitive edge in the market, marketers need to know the consumer behaviour in the field of online shopping. So it is important to analyse and identify the factors which influence consumers to shop online in order to capture the demands of consumers Umar et al., (2011).
channel and the factors which influence this behaviour (Haque, Sadeghzadeh & Khatibi, 2006)
Also, based on observation and according the previous journal about factors influencing purchasing behaviour online business in Malaysia especially Malacca is still green when compare to other states such as Selangor, Johor and Wilayah Persekutuan Kuala Lumpur or other develop State. There is lack of research especially in publish report or journal about e-business development in Malacca. Recent studies by Ainin Sulaiman et.al (2005) focus about the factors affecting online purchasing in urban area. However, for other states, some of the report saying that there is a few factors facing by the online business company in using World Wide Web (WWW) in their e-business.
1.2 Research Question
Research questions are posed to obtain the relevant information required to fulfil the objectives. The purpose of this research was to identify factors influencing the purchase behaviour of youth‟s when buying product online in Malacca. The proposed questions to be answered in this research are as follow:
RQ1: What are the factors influencing youth‟s to purchase online?
1.3 Research Objective
This study aims at addressing the factors affecting online shopping behaviour of youth generation. Three objectives were set up for achieving the goal and to better define the focus of this study. They are:
1. To investigate the factors influencing online shopping among youth‟s?
2. To find out to extent the factor influencing youth‟s to purchase online?
1.4 Scope of study
In this study, researcher focus to at youth‟s age in Malacca who had online shopping experience were chosen as study subjects in order to provide a broader scope for the project. Consumers at youth age were selected as the target group since online shopping is becoming common among youth ages of people. Experienced online shoppers can provide useful information during the study of factors affecting their online purchasing behaviour.
In Malaysia, as reported by Haque and Khatib (2003), most internet users are youths (15-20 years old; 50 per cent) and young adults (20 - 29 years old; 39 per cent). These groups of users consist of those between 15 – 29 years of age, in which most of them are students in secondary schools and universities. Thus, students in tertiary education, especially those who have knowledge in ICT and e-business, have significant influences to online market.
Based on previous journal even though Malacca states are one of the small states in Malaysia, but the development in information structure is massive compare to other state. The pattern of people in Malaysia is now following the trend slowly in buying product or service by online. The study shows that young generation living in small states such as Malacca have fully accommodated with internet access can give high to shop an online shopping. It cause by factors such as convenience, website based, trust and price.
1.5 Limitation of the study
In this study, the researchers found some limitations that need to be faced in conducting this study. Based on the previous journal, researcher has some limitations when conduct the research.
The first limitation maybe researcher encountered some problems in the process of collecting information and data for this research work that is to get respond from respondent. This is because the respondents cannot give full cooperation when the researchers distribute the questionnaire. One of the reasons the respondents does not give full cooperation because the respondents get rushing.
Second, maybe in this research when analysis data got some respondent not fulfil the questionnaire and that makes the questionnaire was not valid. Also because of researcher using questionnaire as data gathering tools, the respondents may not answer the questions exactly according to what they think and behave.
Next, as researcher discussed before, there are many factors affecting on online shopping behaviour. But in this study because of time and cost constraints researcher didn't examined all factors influencing on online shopping behaviour of youth generation in Malacca. It is obvious that is other state people have different characteristics and behaviours. Then result of this study may have lack of generalizability to other states in Malaysian and more focus at Malacca only.
Lastly, maybe the methodology of this study for analysing the data may not be able to fully assess the online shopping behaviour of consumers based on discussed variables.
1.6 Significance of the study
This study is to determine the relations between variables that affect the buying behavior of youth generation on online shopping in Malacca. Understanding of variables such as convenience and save time, price, and trust and website based will be able to help further understand on how these variables affect the consumer purchasing behaviors of youth generation.
Today, the success of any firm depends upon the satisfaction of consumers and group segmentation such as youth generation. To satisfy the youth, the firm should know about the behavior of the youth. In these circumstances, understanding consumer such as youth is a very difficult task because of the changing technology, innovation, and changes in life style.
CHAPTER 2
LITERATURE REVIEW
2.0 Introduction
2.1 Online Shopping or Online Stores
Shopping is an activity, a part of consumer‟s everyday life. Consumer may also want to experience shopping, to know about the products and services as well as which channel that best suited the group of customers by Rowley and Slack (1998) Grain (1996), MacMillan (1997), Cheeseborough and Teece (1996). In online shopping, consumer purchases are based on product information, product offering, images and pictures of the product in comparison with traditional shopping which the consumer is able to taste, touch and smell the products.
Online shopping has become so popular that consumers spent millions purchasing online products. Online Shopping is defined as the process a customer takes to purchase a service or product over the internet. In other words, a customer may at his or her leisure buy from the comfort of their own home product from an online store.
Compared to physical stores, online stores have many advantages. They are convenient and time saving and no more traveling and waiting in lines is needed. They are open in all time and they are accessible anytime and anywhere. These stores provide consumers with free and rich information about products and services. They also have some online tools to help consumers compare and make purchase decisions among various products and services. Hoffman and Novak (1996) indicated that interactivity is the key distinguishing feature between marketing communication on the Internet and traditional mass media.
pressured by salespeople. Online stores reduce transaction costs and have advantage for both consumers and vendors.
However, online stores also have disadvantages compare to brick-and-mortar stores. In online stores customers can‟t have any sense about the product they see in the internet (seeing, touching, tasting, smelling, and hearing) as they search for and purchase products. In online stores, consumers may develop low trust and perceive elevated risk highly because of the lack of face-to-face communication. Although, this is difficulty can be reduced by using certain software tools such as the online recommendation agent (Häubl and Murray, 2003, Xiao and Benbasat, 2007) and the online negotiation agent (Huang and Sycara, 2002, Huang and Lin, 2007).
A study by Forrester Research Inc. investigated the top reasons why young consumers do not shop online found that credit card security concern was the most important deterrent to online shopping. Other reasons included inability to see and touch the product, not trusting that online ordering will go smoothly, having concerns about giving out personal information, and the added expense of shipping by George (2004), Swinyard and Smith (2003), Zhou et al., (2007).
2.2 Youth generation towards online shopping
Youth generation has been the focus of a great deal of research related to their marketplace activity. Generally, online shoppers tend to be younger than online non-shoppers. Although larger percentages of older generations are online now than in the past, young people still dominate the online population, according to Pew Research Center‟s Internet and American Life Project surveys taken from 2006-2008 (Jones and Fox, 2009). Not only is the younger generation more familiar with e-commerce, they also process website information five times faster than older generations by Kim and Ammeter (2008) and O‟Donnell (2006). Still, there are some members of the younger generation who do not like to shop online, primarily because they do not feel secure when purchasing online (Sullivan, 2004).
Online shopping holds a great potential for youth marketers. According to Vrechopoulos et al (2001) young are the main buyers who used to buy products through online. Dholakia and Uusitalo (2002) study examined the relationship between age and Internet shopping; found that younger consumers reported more linen to the online shopping.
2.3 Online Purchase Behaviour
Also according Haubl and Trifts (2000) online shopping behaviour is defined as a shopping activity performed by a consumer by means of computer based interface, where the consumer‟s computer is connected to and can interact with a retailer‟s digital storefront.
The rapid development of internet and e-commerce has influenced the objective for browsing and surfing the internet of consumers by Soopramanien and Robertson (2007) and collecting product information (Moe and Fader 2004). The purchase behaviour of online consumers is different from those in traditional shopping environment (Alba, 1997). The online shopping environments persuade consumers to look for products that enhance the utilitarian and hedonic aspects of shopping (Ha and Stoel 2009).
2.4 The factors of consumer purchasing behaviour online shopping
There are many factors influences and affect customers in related to how consumers make purchasing behaviour. The purchasing behaviour process starts long before actual purchase and continues long after. Usually in more routine purchases, consumers often reserve or skip some of purchase decision process (Kotler & Armstrong, 2004). But as mentioned above, researchers have selected four factors after reading literature in the field on consumer buying behaviour towards online shopping.
2.4.1 Conveniences and save time
making an online purchases decision Loshe & Spiller, (1999). Another study by Sorce et al. (2005) found that younger consumers searched for more products online and they were more likely to agree that online shopping was more convenient.
Also according Eastlick and Feinberg, (1994) the key behind online shopping is due to the convenience. The tool that measures convenience is by effort savings such as easy to find products and location for example easy to find locate store and finding parking space by Lindquist, (1974). In virtual shopping, the characteristic of conveniences in the sense that product is delivered on time, easy to make order, and product is displayed accordingly (Lohse and Spiller, 1998). Another reason that influence e-shoppers buying decision is due to the ease of ordering (Eastlick, 1989; McDonald, 1993).
Based on the study conducted by A.C.Nielsen Research, the reasons why consumers shop online over the Internet (McGann, 2004) convenience is the most prominent factor that motivates consumers to shop online. The timing, location and purchasing process through the Internet are much more superior to other traditional methods of purchasing goods and services (Hanson, 1999). The 24-hour availability of online storefront and accessibility from almost any location makes online shopping more convenient to consumers and provides consumers with a powerful alternative channel for making purchases.
On the plus side, according MasterCard Worldwide Insights (2008) online stores are available 24/7, unlike traditional retailers, and can be accessed from the convenience of one‟s own home, second searching and browsing for product online is often quicker than in a physical store, although consumers with dial-up internet access may have trouble accessing content rich website quickly.
percent of the respondents selected to shop online because they want to avoid crowds and wailing lines, especially in holiday shopping. Consumers not only look for products, but also for online services. Some companies have online customer services available 24 hours. Therefore, even after business hours, customers can ask questions; get necessary support or assistance, which has provided convenience to consumers (Hermes, 2000). Some customers use online channels just to escape from face-to-face interaction with salesperson because they pressure or uncomfortable when dealing with salespeople and do not want to be manipulated and controlled in the marketplace (Goldsmith and Flynn, 2005 and Parks, 2008).
Next, according Darian (1987) mention that online shoppers carry multiple benefits in terms of convenience, such as less time consuming, flexibility, very less physical effort and Bhatnagar and Ghose (2004) claims for convenience as one of the most important advantage for online shopping. According to the Robinson, and Riley (2007) the major motivation for online purchasing is convince in terms of shop at any time and having bundles of items delivered at door step. Rohm and Swaminathan‟s (2004) findings about ‟convenience and variety seeking‟ are major motivating factors of online shopping and this study is consistent with Morganosky and Cude‟s (2000) research findings. Webcheck‟s (1999) study shows that convenience factor is one of the biggest advantages of online shopping.
2.4.2 Trust towards online shopping
In the virtual market environment, buyers usually see pictures of their goods to be purchased, not the goods themselves. Many promises about the quality of goods and services are made. In the e-commerce like online shop environment, since it is very hard to take legal actions against sellers or customers in case of any fraud or dispute, therefore, trust is highly important in conducting e-business transactions. When the consumer placing an order in the internet which customer needs to provide financial information and other personal data, enough trust is needed to exist for the transactions to carry on (Eggert, 2006)
According Gefen, Rose, Warkentin & Pavlou, (2005) therefore, trust can be regarded as the foundation of trade and it is crucial in many economic exchanges, especially in the online environment. The success of e-commerce needs consumers to trust the virtual environment. In short, online retailers need to show that they can cater to customers' individual concerns. Clearly communicated return policies and trustworthy customer testimonials are one way to do this. They help to build trust, in the absence of face-to-face assurances
Studies by Mayer et al., (1995) and Hoffman et al., (1999) reveal that trust and consumer motivation have significant relationships. Other studies found that a high level of trust by buyers stimulate favourable attitudes and behaviour (Anderson and Narus, 1990). A consumer‟s trust in an Internet store can be thought as the consumer‟s trust directly in the store. Nevertheless, Hoffman et al (1999) argued that the effectiveness of third-party trust, certification bodies and the public key encryption infrastructure for ensuring financial security, are the central success factors for building consumer trust in Internet shopping. Kini and Choobineh (1998) suggested that trust in the Internet business is necessary, but not sufficient, for an Internet buying behaviour to take place. The consumer must also trust the transaction medium for online shopping.
process of continuing and maintaining a valued and important relationship that has been created by trust (Chaudhuri and Holbrook 2001). Cyr (2008) found website trust is strongly related to loyalty in Germany and China, but weakly related in the case of Canada. In addition, Kim et al. (2009) conducted a longitudinal study in the U.S and found that online customer trust is strongly related to loyalty.
Also according to Prabhaker (2000) the bond of trust, especially in the depersonalised setting of the internet is very fragile. If that trust is broken, no matter how or who is responsible for that break, the sale will not be realized and no online purchase will be made. Thus, as long as customers are uncomfortable about business knowing too much about them, it will be difficult for the internet to reach its full potential in term of online shopping.
2.4.3 Website based
Based on Syed et al (2008) Web-based factors influence online purchasing behaviour either positively or negatively. According Ranganathan and Ganapathy (2000) found four key dimensions of online shops web sites such as information content, web design and other. On the other hand, Zeithaml et al. (2002) suggest that entertainment criteria identified in the studies of more general websites are not relevant in the online purchase context. Shergill and Chen (2005) found that website design quality was an important issue in customer satisfaction. When the customers satisfied with the website quality, this will increase their involvement in online purchasing.
behaviours of online consumers, skills in information and communication technology (ICT) and age has been found to be strongly related to adoption and use of information systems, including online retailing web-based systems.
Based on website quality, Ruchi et al (2010) suggested that navigation and content are the most sought after factors consumers are looking for when dealing with a web-site. Categorization of information, colour usage, layout or space usage, graphics usage, establishing website‟s identity and presentation of information are also the important factors.
Website design one of the important factor motivating consumers for online shopping. Almost 100,000 on-line shoppers‟s surveyed by Reibstein, (2000) shows that web site design was rated as important factor for online shopping. Another study conducted by Zhang, Dran, Small, and Barcellos (1999, 2000), and Zhang and Dran (2000) indicated that website design features of the website are important and influencing factors that leads consumer‟s satisfaction and dissatisfaction with a specific website.
The web site design describes the appeal of the user interface design that will increase the willingness of customers to visit a website more often and to stay longer with the site. Content on the web includes text, pictures, graphics, layout, sound, motion and, someday, even smell, making the right web content decisions are critical to effective web design. While studies start to explore marketing strategies that attract visitors to websites, how to convert web surfers to repeat visitors is a not well-understood study by Rosen & Purinton, (2004). In their study they identified underlying dimensions of effective website design and provide insight into site design characteristics that lead to a higher likelihood of revisit. Website features such as hyperlinks, navigation bars and sitemaps provide flexible feature by allowing user to browse in a non-linear fashion and the ability to jump to different parts of the website without backtracking.
attract the attention of the potential customer through a myriad of product and services that offer value (Smith, 2004). Website presentation will ensure potential customer to be initially drawn in, but the website content is still the critical issue in online purchase. Fancy design and presentation will only draw at the initial stage but without good valuable content, consumers might likely to venture elsewhere.
The internet has made the data accessing easier according Wang et al., (2005). Given customers rarely have a chance to touch and feel product and service online before they make decision, online sellers normally provide more product information that customers can use when making a purchase (Lim and Dubinsky, 2004). Customers put the weight on the information that meets their information needs (Keency‟s, 1999). In addition to get information from its website, consumers can also benefit from products‟ reviews by other customers. They can read those reviews before they make a decision.
Information quality is defined as the customer perception of the quality of information about the product or service that is provided by a website by Park and Kim (2003). Website content quality has been argued to be an antecedent of online customer trust (Mcknight et al. 2002). In addition, Park and Kim (2003) found that the information quality affects customer satisfaction directly. The study by Cyr (2008) found different results for different cultures. Cyr found that while information design significantly influences trust in Canada, but not in Germany and China, it significantly influences website satisfaction in all three cultures.
2.4.4 Price
cheaper prices are offered to online shoppers is because of competitive pressure, especially from new online retailers. New online retailers use price as a main competitive weapon to attract customers (Hanson, 1999).
Consumers‟ price sensitivity refers to the importance of price in making purchase decision (Hansen & Sorenses, 1993). Price, one of the major factors to consider before consumer making purchase decision earlier research showed that consumers are sensitive with product‟s price when they buy green products (Mandese, 1991). However, study conducted by Jacoby and Olson (1977) showed opposite findings, customers were first interested with brand then price was next. Also, research done by Grunet and Kristensen (1992) shown that 60% of consumers are willing to pay a premium for ecological products. In addition, recent findings by Roos and Nyrud (2008) showed green consumers are less price sensitivity compared to non-green consumers.
The degree that consumers distinguish and react to price levels and price changes is price sensitivity (Goldsmith et al, 2005). Price sensitivity can works as an indicator of how much a consumer willing to pay. Therefore, price has an important effect on consumers' purchase behaviour and as a result on sales and profits of the business (Han et al, 2001).
Price was a critical factor for customer on online shopping (Heim and Sinha, 2001). However, Li et al. (1999) argued that often online shoppers were not price-sensitive, cause of these consumers‟ price comparisons among different e-retailers on each product was time consuming and the price difference was very small.
2.5 Theoretical Framework
In this study also introduces the theoretical framework used for the research. According Henning et al., (2004) a theoretical framework is important as it positions you‟re in the discipline or subject in which you are working and enables you to theorise about your research. Furthermore, it reflects the stance the researcher adopts in this research. The theoretical framework in this study contains constructs that have demonstrated literature support, based on a number of research done in this area, particularly online shopping on end-user perspective (refer to Figure 2.5). The research framework examines the factors that affect online. The research model is shown at Figure 2.5.
INDEPENDENT VARIABLE DEPENDENT VARIABLE
Online Consumer Purchase Behaviour Convenience and save
time
Website Based
Trust
Figure 2.5.A Conceptual Framework of factors influencing youth‟s generation in Malacca to purchase online shopping.
The theoretical framework above shows the relationship between the dependent and independent variables. Essentially, the theoretical framework shows above is the foundation on which the entire research is based upon. Online shopping is the dependent variable in this research. The dependent variable is analysed in this research in order to find out the answers or solution to the problem. Meanwhile, the independent variables in this research are convenience and save time, website based, price and trust. The independent variables are believed to be the variables that influence the dependent variable (online shopping purchasing behaviour) in either a positive or a negative way.
2.6 Summary
CHAPTER 3
RESEARCH METHODOLOGY
3.0 Introduction
This chapter covers an overview of methodology used in the study. The discussion in the chapter is structured around the research design, qualitative or quantitative research, and location of the research and research strategy. Population sampling, data collection and data analysis also discussed.
According to Polit and Hungler (2004), methodology refers to ways of obtaining, organising and analysing data. Methodology decisions depend on the nature of the research question. Methodology in research can be considered to be the theory of correct scientific decisions (Karfman as cited in Mouton & Marais 1996).
Mouton (1996) describes methodology as the means or methods of doing something. According to Burns and Grove (2003), methodology includes the design, setting, sample, methodological limitations, and the data collection and analysis techniques in a study. Henning (2004) describes methodology as coherent group of methods that complement one another and that have the ability to fit to deliver data and findings that will reflect the research question and suit the researcher purpose. According to Holloway (2005), methodology means a framework of theories and principles on which methods and procedures are based.
3. 1 Research Design
“A research design is the arrangement of conditions for collection and analysis of data in a manner that aims to combine relevance to the research purpose with economy in procedure. In fact, the research design is the conceptual structure within which research is conduct. According Selltiz, et.al 1962 it is constitutes the blueprint for the collection, measurement and analysis of data. Thus research design provides an outlines of what the researcher is going to do in terms of framing the hypothesis and the final data analysis.
The research design in this study is survey research by descriptive method or explanatory studies. Explanatory studies that the causal relationship between variables. Researcher has taken explanatory because researcher‟s includes the knowing of the relationship between the consideration factors and purchasing behaviours toward online shopping.
3.2 Methodological choices
In general two types of research methods are being used quantitative and qualitative. Researcher would like to go for quantitative method in this research as it is a precise way. According to Creswell (1994) time is vital attribute for decision making while selecting research method. Saunders, Lewis, and Thornhil (2000) suggests that quantitative research can be faster as compare to qualitative as it is possible to forecast the time schedule, whereas qualitative can be relatively long in duration.
Use a quantitative methods may use either a deductive approach or all about theory testing. It also because this research is want to study the relationship of purchasing behaviour between variable as convenience and save time, website based, trust, and price and will use statistical analysis that will testing the hypothesis of the research. Data in questionnaire produce use numerical and numeric stage that represents each scale of number.
According Bogdan & Biklen, (1998) based on quantitative aspect, the goal of research is “collecting facts of human behaviour, which when accumulated will provide verification and elaboration on a theory that will allow scientists to state causes and predict human behaviour” and qualitative research is to “better understand human behaviour and experience grasp the processes by which people construct meaning and to describe what those meaning are”. In more succinct terms, the goal of quantitative research can be to show relationships between variables, statistical description, establishing facts (Bogdan & Biklen, 1998), validation (Krathwohl, 1998), prediction and control (Gage, 1989), and testing hypotheses (Gall, et al., 1996).
3.3 Research Strategy
3.3.1 Hypothesis test
Both factors affect consumers‟ purchasing behaviour when shopping online. These factors also affect the repeat purchasing behaviour of online consumers. In this study, the demographic background of consumers also be considered in the analysis, and they include age, monthly income and online shopping frequency and expenses.
The following figure explains the relationship between the factors and the online consumer purchase behaviour. Therefore, there were totally four hypotheses drawn:
1. Price
Hi: Price has an influence on online consumer purchase behaviour Ho: Price has no influence on online consumer purchase behaviour
2. Trust
Hi: Trust has an influence on online consumer purchase behaviour. Ho: Trust has influence on online consumer purchase behaviour.
1. Convenience and save time
Hi: Convenience and save time has an influence on online consumer purchase behaviour.
1. Website based
Hi: Website based has an influence on online consumer purchase behaviour Ho: Website based has no influence on online consumer purchase behaviour
3.3.2 Questionnaire design
Questionnaires are an efficient method of data collection when the researcher knows exactly what should be asked and how to measure the variables of interest in order to achieve relevance and accuracy (Sekaran 2000; Zikmund 1997). The questionnaire development process in this study is divided into a number of steps and guided by the objectives of the study (Aaker, Kumar & Day 1998; Dilman 1978).In order to create questionnaire, the basis were built by deciding on the main variables that needed to be investigated.
The first part of the questionnaire included questions about the demographic characteristics of the respondents such as age, gender, occupation, education, and monthly income. Second part is pattern of customer purchasing behaviour online of the respondents such as level of online shopping experience, kind of product purchased through online and main reason for online shopping
The third part consisted of questions measuring all the dependent and independent variable to measure the online shopping. All the questions were utilizing on a Likert scale ranging from 1= strongly disagree to 5 = strongly agree.
Questionnaire layout
questionnaire was designed in such a way that it motivated respondents to participate and complete the survey by using simple and easy to follow layout design (Malhotra et al. 1996; Salant and Dillman 1994). The longest time required for any respondent to complete this survey should be under 10 minutes. The University of Southern Queensland was named as the sponsor of this study and the names of the researcher‟s academic supervisors were added to help increase both the credibility and the legitimacy of the survey.
According to WaiChingleung, questionnaire should fulfil two main objectives: to maximize the response rate and to obtain accurate relevant information for our research (Leung, 2001). Personalized cover letter was included in which it was explained why are asking these questions and the importance of the respondents' participation, who is responsible for the survey and was guaranteed of confidentiality. Questionnaire was designed in such a way that all questions are arranged in general to particular, easy to difficult, start with closed format questions, only relevant question are asked to maximize the response rate.
To make more ease to our respondent, closed format style questionnaire include checklist questions which included maximum extend asking respondents to tick one or multiple choice depending on the type of question. Ambiguous question are avoided such as many, few, good, bad, frequently etc. these kinds of answer make two problems; introduce response bias and make the statistical analysis of the data difficult. The following will represent and discuss the results of the survey based on the 150 active internet users among youth who actually participated and filled the questionnaire.
3.4 Primary data sources
There are two ways to collect data, when collecting data to approach the purpose of a research. Primary data is gathered for a particular research (Gilbert A Churchill, 2009, p. 142). Primary data can be collected through interviews, observations, experiments and questionnaire.
In research, the main concern is to collect primary data and analyse questionnaire and respondents in order to analyse factors involved in online shopping purchasing behaviour and how these are related to respondents. According to Sekaran (1992) questionnaire is a simple data collection tool because a lot of data can be gathered in a short period of time. The primary data is conducted in a way that it will be able to approach the research and conclude answers to research questions. It is the most popular method used when the population and sample size are large. In Chapter 4, Questionnaire will be explained in more detail.
3.5 Secondary data sources
3.6 Data analysis method
After collected the data from the respondents, SPSS2.0 for windows was used for data analysis, primary data analysis and descriptive statistics, Primary data analysis and descriptive statistics show the sample sizes, frequencies and percent variables. They are used for describing the demographic data, the profile of respondents are described.
The tool that researcher will use for data analysis is a 5 Point Likert Scale (1=Strongly Disagree, 2=Disagree, 3=Neutral, 4=Agree, 5=Strongly Agree). The Likert scale is a scale that is commonly used for questionnaires, and is mostly used in survey research. This research is also survey based research so it would be easy for us to interpret the analysis. The advantage of using likert scale can be to create interest among respondents as according to Robson (1993) as likert scale can be interesting for users and they often enjoy completing a scale like this. Another advantage can be simplicity as Neuman (2000) suggests the real strength of Likert scale is the simplicity and ease of use
3.7 Location of research
Scope of the study report is limited to survey area in Malacca. Respondents in selected area to distribute the questionnaire are shopping centre and university.
3.8 Population and sample
This research study shall focus mainly on the factors influencing youth generation in Malacca to purchase online shop. Hence, the questionnaire will be designed targeting on youth in Malacca. The population in Melaka is 842,500 as of at year 2012. The population consists of Malay 65.7%, Chinese 26.2% and Indian 6.2% (Portal Kerajaan Negeri Melaka, 2012).
The total of the sample size would be 300 respondents. A self-administered questionnaire will be distributed to 150 respondents. Hair et al. as cited by Raoprasert and M.N.Islam. (2010) recommended minimum samples size of 100-150 to ensure the stable Maximum Likelihood Estimation (MLE) solution. Respondents will be randomly identified based on their online purchasing behaviour
3.9 Validity and reliability
3.9.1 Validity
Validity and reliability were considered carefully in this study. Validity refers to the accuracy of measurement, whether the conceptual and operational definitions are truly a reflection of the underlying concept to be measured (Burns & Bush 1995; Neuman 1994).
3.9.2 Reliability
connected to the inter-relatedness of the items within the test. Internal consistency should be determined before a test can be employed for research or examination purposes to ensure validity. In addition, reliability estimates show the amount of measurement error in a test.
Cronbach‟s Alpha reliability co-efficient normally ranges between 0 and 1 however; there are actually no lower limit to the co-efficient. The closer Cronbach‟s Alpha co-efficient is to 1.00 the greater the internal consistency of the items in the scale. Cronbach‟s Alpha is calculated by following formula:
Cronbcah’s Alpha = rk / [1 + (k – 1) r] Where k = number of items considered
r = the mean of the inter-item correlations.
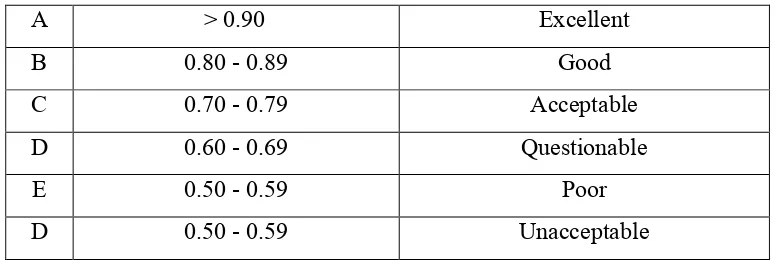
Table 3.9.2.1: Cronbach‟s Alpha reliability co-efficient Sources: George & Mallory (2003)
A > 0.90 Excellent
B 0.80 - 0.89 Good
C 0.70 - 0.79 Acceptable
D 0.60 - 0.69 Questionable
E 0.50 - 0.59 Poor
3.10 Pilot Test
Pilot test was done prior to the actual research. This is involved 30 respondents in order to ensure that the questions are understandable by the actual respondents. It was also aimed to determine the reliability alpha for each instruments used beside to achieve research precise research objectives. Moreover, pilot test allow researcher to improve the scarifying that existed in questionnaire form and to make sure that the items was suit with the study‟s requirement. Below are the results of each question:
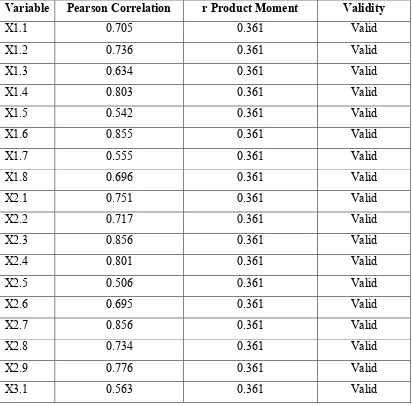
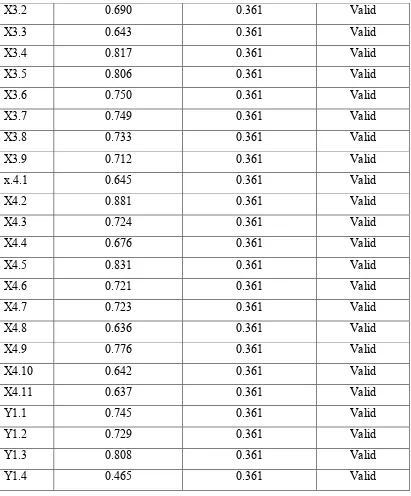
Table 3.10 : Validity of 30 respondents for pilot test
Variable Pearson Correlation r Product Moment Validity
X1.1 0.705 0.361 Valid
X1.2 0.736 0.361 Valid
X1.3 0.634 0.361 Valid
X1.4 0.803 0.361 Valid
X1.5 0.542 0.361 Valid
X1.6 0.855 0.361 Valid
X1.7 0.555 0.361 Valid
X1.8 0.696 0.361 Valid
X2.1 0.751 0.361 Valid
X2.2 0.717 0.361 Valid
X2.3 0.856 0.361 Valid
X2.4 0.801 0.361 Valid
X2.5 0.506 0.361 Valid
X2.6 0.695 0.361 Valid
X2.7 0.856 0.361 Valid
X2.8 0.734 0.361 Valid
X2.9 0.776 0.361 Valid
X3.2 0.690 0.361 Valid
X3.3 0.643 0.361 Valid
X3.4 0.817 0.361 Valid
X3.5 0.806 0.361 Valid
X3.6 0.750 0.361 Valid
X3.7 0.749 0.361 Valid
X3.8 0.733 0.361 Valid
X3.9 0.712 0.361 Valid
x.4.1 0.645 0.361 Valid
X4.2 0.881 0.361 Valid
X4.3 0.724 0.361 Valid
X4.4 0.676 0.361 Valid
X4.5 0.831 0.361 Valid
X4.6 0.721 0.361 Valid
X4.7 0.723 0.361 Valid
X4.8 0.636 0.361 Valid
X4.9 0.776 0.361 Valid
X4.10 0.642 0.361 Valid
X4.11 0.637 0.361 Valid
Y1.1 0.745 0.361 Valid
Y1.2 0.729 0.361 Valid
Y1.3 0.808 0.361 Valid
Y1.4 0.465 0.361 Valid
Table 3.11: Interpretation of reliability based on Cronbach‟s alpha for 30 respondents
Variable Cronbach‟s alpha N of Items Result
Price 0.836 8 Good
Convenience and save
time 0.897 9 Good
Trust 0.881 9 Good
Website based 0.904 11 Excellent
Online purchase 0.635 4 Questionable
Table 3.11 shows the Interpretation of reliability based on Cronbach‟s alpha for 30 respondents. Based on table the Cronbach‟s alpha value of price, convenience and save time and trust is 0.836, 0.897 and 0.881 respectively which are good. Besides that, Cronbach‟s alpha for the online consumer purchase behaviour are 0.635 and it is questionable because Cronbach‟s alpha value is 0.60-0.69.
It should be noted that while a high value for Cronbach‟s Alpha indicates a good internal consistency of the items in the scale. The Cronbach‟s Alpha of websites based is 0.904 which are excellent and most reliable to internal items consistency.
3.11 Summary
CHAPTER 4
DATA ANALYSIS AND DISCUSSION
4.0 Introductions
4.1 Frequency analysis
Frequency analysis is used for the study of the frequency of letter or groups of letters in a cipher text. The method is used as an aid to breaking classical ciphers. Frequency analysis is based on the fact that, in any given stretch of written language, certain letters and combinations of letter occur with varying frequencies.
4.1.1 Demography profile
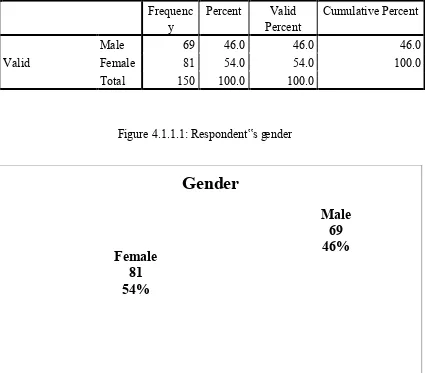
Table: 4.1.1.1 Gender analysis (Source: Primary data from output SPSS)
Gender Frequenc
y Percent Percent Valid Cumulative Percent
Valid
Male 69 46.0 46.0 46.0
Female 81 54.0 54.0 100.0
Total 150 100.0 100.0
Figure 4.1.1.1: Respondent‟s gender
Male
69
46%
Female
81
54%
Analysis of data indicated that of the 150 respondents that participated in this research,69 of them or 46.% were male and the reminder 81 or 54% were females as shown in Table 4.1.1.1. While, Figure 4.1.1.1 shows the percentage of distribution of respondents by gender. What can be concluded from this research finding implied that females dominated in this research.
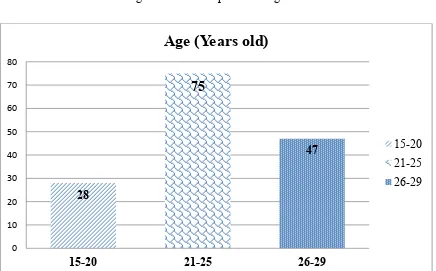
Table 4.1.1.2: Age
(Source: Primary data from output SPSS Age
Frequenc
y Percent Percent Valid Cumulative Percent
From the table and figure named as age analysis, it is clear that in this survey we have 75 frequencies in the age of 21-25 with percentage 50% which is the highest percentage among other age distribution. In age distribution of 26-29 we have 31.3% and 18.7% fall in15-20 age year‟s old respondents. The questionnaire responses mainly show the young generation around 21-25which is actively part of the research.
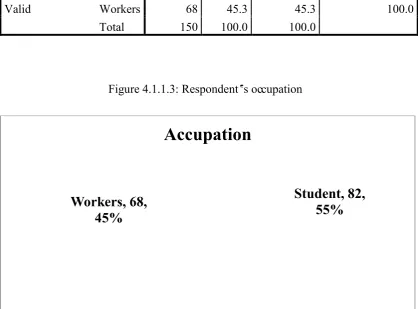
Table 4.1.1.3: Occupation (Sources: Primary data from SPSS)
Occupation Frequenc
y Percent Percent Valid Cumulative Percent
Valid
student 82 54.7 54.7 54.7
Workers 68 45.3 45.3 100.0
Total 150 100.0 100.0
Figure 4.1.1.3: Respondent‟s occupation
The table 4.1.1.3 shows the frequency of respondent‟s occupation. For this research 150 respondents participated in the survey. 82 of them or 54.7% were the students while the other 55 persons or 45.3% are work
Student, 82,
55%
Workers, 68,
45%
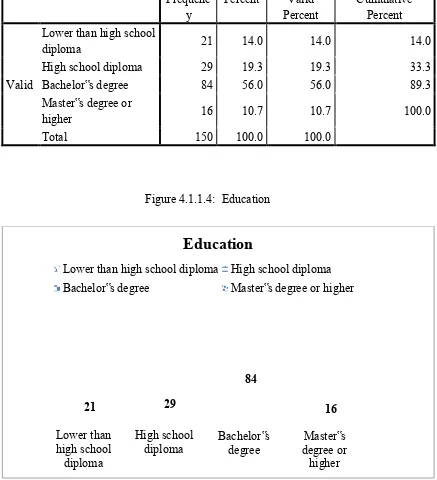
Table 4.1.1.4: Education (Sources: Primary data from SPSS)
Education Frequenc
y Percent Percent Valid Cumulative Percent
Valid
The Table 4.1.1.4 show the highest frequency 56 % among the respondents falls under the category of bachelor‟s level of studies followed by the 19.3% who has the high school diploma. A very nominal percentage of almost 37 % categorized in the lower than high school diploma and master‟s degree level of studies.
Lower than high school diploma
High school
diploma Bachelor‟s degree degree or Master‟s higher
21 29
84
16
Education
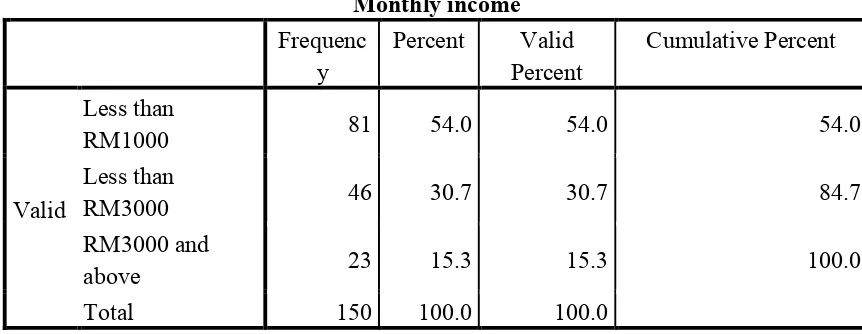
Table 4.1.1.5 Income Distribution among respondents (Sources: Primary data from SPSS)
Monthly income Frequenc
y Percent Percent Valid Cumulative Percent
Valid
Figure 4.1.1.5: Income Distribution among respondents
Table 4.1.1.5 show that the monthly income of respondents. Based on the 150 total numbers of respondents, 81 of them or 54% were monthy income around less than rm1000 . Next 46 of the respondents or 30.7% were in the category less than rm3000. Lastly 23 or 15.3% of respondent were come from rm3000 and above.
The result show that category of less than rm1000 of monthly income was higher compared to another category.
4.1.2 Pattern of customer purchasing behaviour online shopping
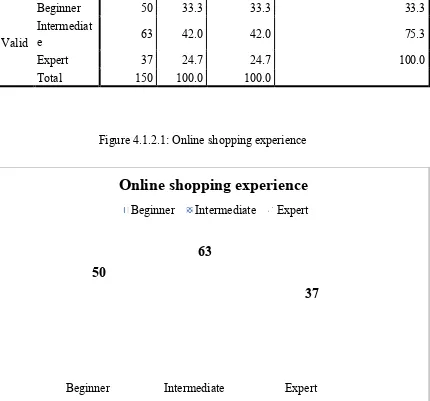
Table 4.1.2.1: Online shopping experience (Sources: Primary data from SPSS)
Online shopping experience Frequenc
y Percent Percent Valid Cumulative Percent
Valid
Beginner 50 33.3 33.3 33.3
Intermediat
e 63 42.0 42.0 75.3
Expert 37 24.7 24.7 100.0
Total 150 100.0 100.0
Figure 4.1.2.1: Online shopping experience
Beginner Intermediate Expert
50
63
37
Online shopping experience
Analysis of data indicated that level of online shopping experience of the 150 respondents that participated in this research. The category of beginner has 50 or 33.3% participant. Category of intermediate experience is a higher were 63 respondent and 42 %. Lastly is expert category and only 37 respondents or 24.7%.
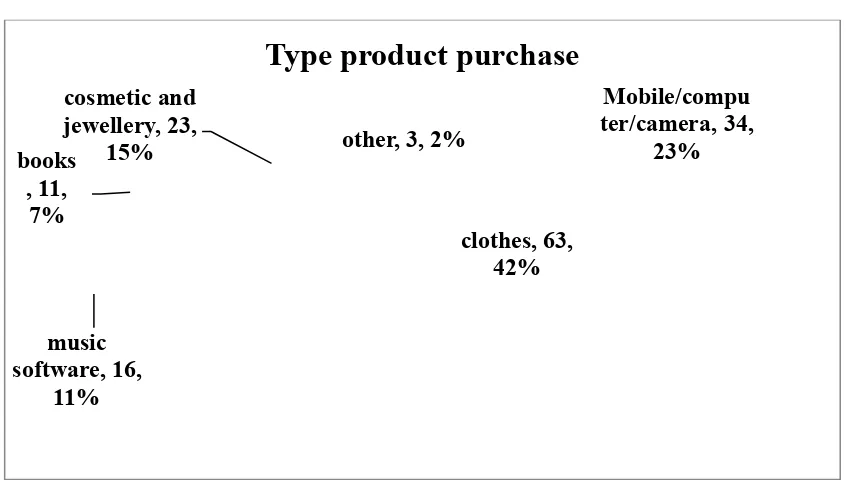
Table 4.1.2.2 Kind of products you purchased through online store (Sources: Primary data from SPSS)
Type product purchase Frequenc
y Percent Percent Valid Cumulative Percent
Valid
Figure 4.1.2.2 Kind of products you purchased through online store
Based on the chart above, the total respondents are 150 who had made online purchasing out of which 63 respondents bought clothes. It is the highest frequency of 42 % followed by clothes products of 22.7 %. Cosmetics and jewellery are bought by 15.3 % of consumers who are buying online. Music and software, books and other are bought by 11 %, 7 % and 2 % respectively.
Table 4.1.2.3: Times shop online (Sources: Primary data from SPSS)
Times shop online Frequenc
y Percent Percent Valid Cumulative Percent
Valid
0-1 33 22.0 22.0 22.0
2-3 85 56.7 56.7 78.7
4-7 25 16.7 16.7 95.3
8 and
above 7 4.7 4.7 100.0
Total 150 100.0 100.0
Figure 4.1.2.3: Times shop online
0 to 1
22%
2 to 3
56%
4 to 7
17%
8 and above
The Table 4.1.2.3 above shows the age composition of the respondents that participated in this study. From the 150 total numbers of respondents, 33 of them or 22% were respondents within the category 0-1. Another 85 of the respondents or 56.7% were in the category of 2-3 of times shop online. Next, of the respondent with 25 respondents or 16.7% were in the range of 4-7. Lastly 8 and above were 7 or 4.7%.
Table 4.1.2.4 Spent online shopping product (Sources: Primary data from SPSS)
Spent online shopping product Frequenc
y Percent Percent Valid Cumulative Percent
Valid
Figure 4.1.2.4: Spent online shopping product
The Table 4.1.2.4 above shows how much respondents spent on online shopping products last month. From the 150 total numbers of respondents, 98 of them or 65.3% were respondents within less than rm500. Another 27 of the respondents or 18% were in the category of rm501-rm1000. Lastly but not least, 15 or 10 % were in the range of rm1001-rm1500. Lastly, category of rm1501 and above was 10 or 6.7% only by respondents. High domination is less than rm500
Table 4.1.2.5: Experience online shopping (Sources: Primary data from SPSS)
Experience online shopping Frequenc
y Percent Percent Valid Cumulative Percent
Valid
Figure 4.1.2.5: Experience online shopping
0
Less than a year 1 to 5 years More than 5 years
From the above question, it is clear that from 150 of respondents have been doing online shopping from which 43.3 % of respondents have been doing online shopping for less than a year, it indicates that people in Malacca are not addicted to online shopping and just currently involve in it. While 50 % respondents have been doing online shopping since 1 to 5 years and 6.7% have been doing online shopping more than 5 years.
Table 4.1.2.6: Reason online shopping (Sources: Primary data from SPSS)
Reason online shopping Frequenc
y Percent Percent Valid Cumulative Percent
Valid
Figure 4.1.2.6: Respondent‟s reason online shopping
As analysed from the result in online shopping in youth in Malacca, consumer concerns are price factor, convenience and time saving 51% of respondents consider price as the most important factor followed by 37% people who consider convenience and time saving. The remaining percentage of 7 % falls under the category of those respondents for whom the particular product trust and website based. In Malacca, consumer mind is not different, youth behaviour is normal as other states youth behaviours norms. They are very conscious about cost cutting and time saving; majority of the peoples‟ decision is affected by the best price offer, therefore, the sellers of the product online shop must take price into consideration in their online stores in order to increase their sales.
Table 4.1.2.7: Visit to retail store first before final purchase (Sources: Primary data from SPSS)
Frequenc
y Percent Percent Valid Cumulative Percent
Valid
Yes 92 61.3 61.3 61.3
No 58 38.7 38.7 100.0
Total 150 100.0 100.0
Figure 4.1.2.7: Respondent‟s Visit to retail store first before final purchase
Yes, 92, 61%
No, 58, 39%
Visit retail store first before final purchase
This question was asked to judge the consciousness of consumer and approach regarding the selection of product about offered online products. It is analysed that 61 % or 52 of respondents do visit the retail store to see and check the actual product before actually buying from an online store while 39 % of them don‟t bother to see the actual product in offline store.
4.2 Descriptive statistics
Once the data has been collected and prepared for analysis, basic statistical and descriptive analysis will be developed for the study.
1. The measurement of central tendency is used to examine the different values for a given variable. Descriptive statistics, such as frequency and mean are used for this purpose.
2. The measurement of dispersion. Range and standard deviation will be used to determine the similarities and differences in respondents‟ opinions, behaviour and experience in this survey.
Table 4.2.1: Descriptive statistics (Sources: Primary data from SPSS)
Descriptive Statistics
N Minimum Maximum Mean Std. Deviation
PRICE 150 1.88 5.00 3.9725 .67724
TRUST 150 1.78 5.00 4.1467 .65782
CONVENIENCE AND
SAVE TIME 150 1.67 5.00 4.2193 .64184
WEBSITES BASED 150 1.73 5.00 4.0739 .66841 ONLINE CUSTOMER
PURCHASE
BEHAVIOUR 150 1.50 5.00 4.0783 .72938
Table 4.2.1 shows that mean value of price is 3.9725 and it means that most of the respondent response near 4 for likers scale and it positively. Even this response is the lowest mean value among other variable but standard deviate is 0.67724 and higher compared to another variable.
The mean value of trust and website based is near to 5 likers scale and it means that of the respondent positively influence. Response for this variable value can be deviate is lower than price.
Mean of value of convenience and save time was highest mean value among another variable. It is 4.2193 and it is nearly to 5. It shows that mostly people agree that trust has positive influence their online consumer purchasing behaviour .These response can deviate 0.65184 for trust and 0.72938 for online consumer purchase behaviour disposal at 5 likers scale from strongly disagree to strongly agree.
4.3 Validity and reliability test for research
4.3.1 Validity
Table 4.3.1: Validity of 150 respondents for the research (Sources: Primary data from SPSS)
Variable Pearson
Correlation
r Product Moment
Validity
X1.1 0.646 0.159 Valid
X1.2 0.704 0.159 Valid
X1.3 0.770 0.159 Valid
X1.4 0.662 0.159 Valid
X1.5 0.700 0.159 Valid
Y1.3 0.809 0.159 Valid
Y1.4 0.820 0.159 Valid
From the validity testing for all research, all the items are valid. This is because the values are greater than the critical value (r product moment) are 0.159.Based on Pearson Product Moment Table the total of respondent N = 150 which r product moment is 0.159. Thus, all items can be included in further questionnaires.
4.3.2 Reliability test for research
Table 4.3.2: Interpretation of reliability based on Cronbach‟s alpha for 150 respondents
Variable Cronbach‟s alpha N of Items Result
Price 0.818 8 Good
Convenience and save time
0.904 9 Excellent
Trust 0.896 9 Good
Website based 0.900 11 Excellent
Online consumer purchase behaviour
0.822 4 Good
Table 4.3.2 show the Interpretation of reliability based on Cronbach‟s alpha for 150 respondents. Based on table the Cronbach‟s alpha value of price, trust, and online consumer purchase behavior is 0.818, 0.896 and 0.822 respectively which are good. Based on table 3.9.1 cronbach‟s alpha 0.80-0.89 is good.
Cronbach‟s Alpha of 0904 and 0.90. Convenience and save time was measured through nine (9) questions, whereas website based was measured through eleven (11) questions. The result is excellent relationship with online consumer purchase behavior.
4.4 Multiple regression analysis
Multiple regression analysis is a powerful technique used for predicting the unknown value of a variable from the known value of two or more variables also called the predictors. (Amit & Choudhury, 2009).Multiple regression analysis is helping to predict outcome the value of A given by B. While the dependent variable the online purchasing. Multiple Linear Regression analysis is conducted to check the significant difference among the independent variables such as price, trust, convenience and save time and websites based.
Table 4.4.1: Model summary multiple regression Analysis (Source: primary data from output SPSS)
Model Summary
Model R R Square Adjusted R
Square Std. Error of the Estimate
1 .565a .319 .300 .61025
a. Predictors: (Constant), WEBSITES BASED, PRICE, TRUST, CONVENIENCE AND SAVE TIME
Table 4.4.2: Coefficients Multiple Regression Analysis (Sources: Primary data from SPSS)
Coefficient’s
Model Unstandardized
Coefficients Standardized Coefficients t Sig. B Std. Error Beta
a. Dependent Variable: ONLINE CUSTOMER PURCHASE BEHAVIOUR
Table 4.4.2 shows that beta values which mean individual independent variables influences on dependent variable. Result indicated that convenience and save time has highest Beta value among other variables and strong influences on online consumer purchase behaviour with Beta Value 0.312. It explained that 14.7% variation in online consumer purchase behaviour cause convenience and save time.
The coefficient for price is 0.052. So for every unit increases in price, a 0.052 unit increase in online consumer purchase behaviour are disposal, holding all other variable constant.
The coefficient for trust is 0.346. So for every unit increase in trust, a 0.0.346 unit increases in online consumer purchase behaviour disposal is predicted, holding all other variable constant.
For every unit increase in websites based the researcher expect a 0.087 unit decrease in the online consumer purchase behaviour disposal, holding all variable constant
4.5 Hypothesis testing
The researcher using significant value for interpreting hypothesis testing in this study based on chapter two. The significant value as result shows in table 4.7.1.
Table 4.5.1 Guidelines for interpreting hypothesis testing Sources: Aronson (2011)
Significance level, 0.05 > than significance value mean significant, indicating the acceptance of Hi
Significance level, 0.05 < than significance value mean significant, indicating the acceptance of Ho
Table 4.5.2: The overall result hypothesis testing
IV Significant value Conclusion Convenience and save time 0.05 > 0.020 Accepted Hi
Rejected Ho Price 0.05< 0.647 Rejected Hi Accepted Ho Trust 0.05< 0.158 Rejected Hi
Accepted Ho Website based 0.05< 0.566 Rejected Hi
Hypothesis 1
Hi: Convenience has an influence on online consumer purchase behaviour among youth generations.
Ho: Convenience has no influence on online consumer purchase behaviour among youth generations.
The significance value convenience and save time is 0.020 < 0.05, it can be concluded that the convenience and save time has significant effect on online consumer purchase behaviour among youth in Malacca. Therefore, Hi is accepted and Ho is rejected. This convenience and save time significant influence online consumer purchase behaviour disposal.
Convenience is the most prominent factor that motivates youth to shop online in Malacca. The timing, location and purchasing process through the internet are much more superior to other traditional methods of purchasing goods and the 24-hour availability of online storefront and accessibility from almost any location makes online shopping more convenient and provides youth with a powerful alternative channel for making purchases
Hypothesis 2
Hi: Price has an influence on online consumer purchase behaviour. Ho: Price has no influence on online consumer purchase behaviour.
The significance value price is 0.647 > 0.05, it can be concluded that the convenience and save time insignificant effect on online consumer purchase behaviour. Therefore, Hi is rejected acceptance Ho. This price does no significant influence online consumer purchase behaviour disposal
From the questionnaire result, the main groups of youth engaged in online shopping are mainly students and, their monthly personal income is relatively low and thus they are price sensitive. The relatively lower amount of online purchase behaviour spent reflected that they are not concern about the price of products online. The questionnaire result also showed that price has not significant relationship with online purchase behaviour among youth in Malacca. That means, a lower price for the same product may be not advantage in this case. Price sensitive consumers tend to choose sellers that offered products with a lower price. But youth reject the idea of online shopping due to high international shipping cost involved and do prefer local stores due to value added tax and custom duties in Malacca. Price advantages not necessarily gain by lower in direct price. From the questionnaire result, consumers also not regard free delivery and free gifts.
Hypothesis 3