CHLOROPHYLL SPECIFIC ABSORPTION COEFFICIENTS AND THE IMPACT OF PHYTOPLANKTON TAXONOMIC GROUP OF SURFACE
WATERS IN THE NORTHEASTERN GULF OF MEXICO
Bisman Nababan
Department of Marine Science and Technology, Faculty of Fisheries and Marine Sciences, Bogor Agricultural University, Bogor
Abstract
The chlorophyll-specific absorption coefficient at 440 nm (a*ph(440)) of surface water in the Northeastern Gulf of Mexico varied by a factor of 7 (0.02-0.15 m2 mg-1) with the of chlorophyll-a concentration of 0.06-12.25 mg m-3. In general, lower values of a*ph(440) (<0.06 m2 mg-1) were observed in the inshore particularly in the major river mouths. During summer, lower values of a*ph(440) were also observed offshore associated with low-salinity waters of the Mississippi River plume. Higher values of a*ph(440) (>0.1 m2 mg-1) were otherwise observed outside the river plumes in the outer shelf and slope, where lower chlorophyll-a concentration occurred. Based on phytoplankton taxonomic groups, the average value of a*ph(440), of microphytoplankton group was significantly lower than that of nanophytoplankton and picophytoplantkon groups, suggesting that an increase in cell optical size (pigment packaging) resulted in decreasing a*ph(440) values. The relationship between a*ph(440) and chlorophyll-a concentration was also not linear, indicating pigment composition played an important role in determining a*ph(440) variability.
Keywords: chlorophyll-specific absorption coefficient, microphytoplankton, nanophyto- plankton, picophytoplankton, Gulf of Mexico, pigment, packaging effect
1. INTRODUCTION
The phytoplankton absorption coefficient per unit of chlorophyll concentration (chlorophyll-specific absorption coefficient, a*ph(λ) is a key factor when modeling light propagation within the ocean and ocean color (e.q., Carder et al., 1986; Gordon et al., 1988; Morel, 1988,), carbon fixation by phytoplankton (Kiefer and Mitchell, 1983), the contribution of phytoplankton to the total absorption coefficient of seawater, as well as for modeling marine primary production (Morel and Andre, 1991; Carder et al., 1995; Sakshaug et al., 1997; Ishizaka, 1998).
In many studies, the spectrum and average value of a*ph(λ) has been
considered to be relatively constant (Kiefer and Mitchel, 1983; Berthon and Morel, 1992). However, the variability in a*ph(λ) has been extensively documented for both laboratory cultures (e.g., Bricaud et al., 1983, 1988; Mitchell and Kiefer, 1988a; Berner et al., 1989; Bidigare et al., 1990; Stramski and Morel, 1990; Ahn et al., 1992; Fujiki and Taguchi, 2002) and natural populations (e.g., Carder et al., 1986, 1991, 1999, 2004; Mitchell and Kiefer, 1988b; Yentsch and Phinney, 1989; Bricaud and Stramski, 1990; Hoepffner and Sathyendranath, 1991, 1992; Babin et al., 1993; Nelson et al., 1993; Bricaud et al., 1995; Cleveland, 1995; Sosik and Mitchell, 1995; Allali et al., 1997; Suzuki
instance, using a data set that included 815 spectra from different regions of the world ocean and covering chlorophyll concentrations ranging from 0.02 to 25 mg m-3, a*ph(440) values were observed to increase from eutrophic to oligotrophic waters over more than one order of magnitude (0.01 to 0.18 m2 mg-1, respectively) (Bricaud et al., 1995). Variability in the magnitude and spectral shape of a*ph(λ) can be attributed to three factors: (1) packaging effect i.e., pigments packed into stacks of shelf-shaded chloroplasts are less efficient in absorbing light per unit pigment mass than an optically thin solution (Kirk, 1994), (2) pigment composition and (3) cell size. An increase in pigment packaging can occur either as cell size increases or the internal concentration of pigments increases (Morel and Bricaud, 1981; Kirk, 1994; Lohrenz et al., 2003). Differences in phytoplankton species, as well as variation within a species grown under different environmental conditions (e.g., growth irradiance), also causes variability in a*ph(λ) due to pigmentation and packaging effects (Morel and Bricaud, 1986; Bricaud et al., 1988; Mitchell and Kiefer, 1988a; Berner et al., 1989, Stramski and Morel 1990; Fujiki and Taguchi, 2002).
Several investigators have reported an increase in a*ph(λ) with a decrease in chlorophyll concentration (Carder et al., 1986, 1991; Bricaud and Stramski, 1990; Cleveland, 1995; Bricaud et al., 1998, 1995). They interpreted this result mainly due to packaging effect or a general trend of decreasing cell size with decreasing chlorophyll concentration. However, the above trend can instead be attributed solely to the increasing contribution of accessory pigments in waters with low chlorophyll concentration, with no consideration of packaging effect (Wozniak and Ostrowska, 1990; Bricaud
et al., 1995; Sakshaug et al., 1997; Ciotti
et al., 1999). Carder et al. (1991) also suggested that chlorophyll dependency of a*ph(λ) could differ between regions such as subtropical and temperate regions due to the typical differences in cell size, light, and nutrient regimes. In contrast, Hoepffner and Sathyendranath (1992) reported that there was no dependency of a*ph(440) on chlorophyll concentration in the Gulf of Maine and Georges Bank regions within the range of 0.05-2.5 mg m-3 chlorophyll, although that could all be considered part of the same region. The Northeastern Gulf of Mexico (NEGOM) encompasses a wide variety of ecosystems which are influenced by a combination of nutrient-rich input from rivers and estuaries, coastal upwelling, vertical mixing (Muller-Karger, 2000; Gilbes et al., 1986), and the Loop Current (Huh et al., 1981; Muller-Karger et al., 2001; Weisberg and He, 2003). These processes exert strong influences on the phytoplankton abundance and distribution in the NEGOM. To date, a*ph(λ) variability has not been studied in the NEGOM region.
The objective of this study was to determine the seasonal and spatial variation of the chlorophyll-specific absorption coefficient of phytoplankton and its relationship with phytoplankton community structure based on pigment composition in the NEGOM.
2. METHODOLOGY
2.1. Sample Collection
Su-99, Su-00), and fall (November; Fa-98, Fa-99) of 19Fa-98, 1999, and 2000 (Table 1). Each cruise surveyed eleven cross-margin transects from the 10-m to the 100-m isobath.
Water samples (0.5-5.0 L) were collected from the outflow of a flow-through system that pumped at a rate of 10 liters/minute from a hull depth of about 3-m, which passed water via a 10-liter debubbler and mixing chamber. The samples were immediately filtered aboard
ship using Whatman GF/F filters (0.7 um pore size) under low vacuum pressure (<0.5 atm). The volume of water filtered varied between ~0.05 and 5.0 liters depending on the concentration of pigmented particles in the sample. Filtering was discontinued once the filter displayed sufficient color to the naked eye. Each filter pad was folded and placed into a 2.0 ml sterile Nalgene cryogenic vial, and stored in liquid N2
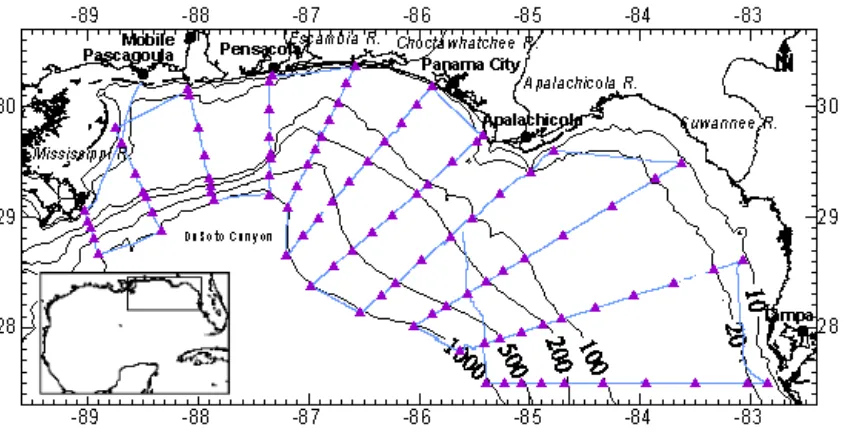
Figure 1. Study area: the NEGOM Region, Encompassing the Area between 27.3 - 30.7° N and 82.6 - 89.6°W. The map shows the 10, 20, 100, 200, 500, and 1000 m bathymetric contours and cruise transect lines (solid line). Closed triangles were CTD stations from which discrete water samples for light absorption coefficients and pigments analyses were taken. Rectangle area in the Gulf of Mexico inset is the area of the study.
Table 1. Cruise Identifiers and Dates.
for further analysis. After arrival from the field, samples were stored in a deep-freezer.
Near-surface water samples for pigment analyses were collected from one of twelve 10-L Niskin bottles operated with a Sea-Bird SBE 911 profiling system used to collect conductivity-temperature-depth (CTD) profiles. Pigment sampling and analyses, including the calibration of a fluorometer on the flow-through system, were conducted by Texas A&M University. Detailed description of data collection and analysis methods can be found in Qian et al. (2003).
2.2. Absorption Measurements
Absorption spectra for total particulate (phytoplankton and detritus, ap(λ)) and detritus (ad(λ)) was determined by the quantitative filter technique (Yentsch, 1962; Kiefer and SooHoo, 1982). Prior to analysis, sample and reference filter pads were allowed to thaw slowly at room temperature for about 5-10 minutes prior to being placed in a dark petri dish and moistened with a drop of Milli-Q water. The moist sample and reference filter pads were placed on individual glass plates (diameter=2.4cm) in a custom-made diffuse transmissometer box. Prior to each scan, the filters were slid one at a time over a tungsten-halogen light source that shone through a blue long-pass/cut-off filter and a quartz glass diffuser. Using a custom made, 512-channel spectroradiometer (~350-850nm), the transmittances of the sample filter (Tsample(λ)) and the reference filter (Treference(λ)) were measured three times. These measurements were averaged and used to obtain the optical densities of total particulate matter (ODp(λ)) as shown below.
The sample filter was then soaked with ~40-50ml of hot 100% methanol for 10-15 minutes in the dark to extract phytoplankton pigments (Kishino et al., 1985; Roesler et al., 1989; Bissett et al., 1997). Transmittances of the extracted filter (Tdetritus(λ)) and the reference filter were once again measured three times, and the optical density of detritus (ODd(λ)) calculated.
Optical densities were calculated as follows: ⎟⎟ ⎟ ⎠ ⎞ ⎜⎜ ⎜ ⎝ ⎛ = ) ( sample T ) ( reference T 10 log ) ( p OD λ λ
λ (1a)
⎟ ⎟ ⎠ ⎞ ⎜ ⎜ ⎝ ⎛ = ) ( detritus T ) ( reference T 10 log ) ( d OD λ λ
λ 1b)
The absorption coefficients of particulate matter (ap(λ)) and detritus (ad(λ)), were calculated as follows:
l β ) ( p OD 10 ln ) ( p
a λ = ∗ λ ∗ (2a)
l β ) ( d OD 10 ln ) ( d a ∗ ∗ = λ
λ (2b)
where “l” is the geometric pathlength equal to the volume of seawater filtered divided by the effective filtration area of the filter (Πr2, r=0.0215/2 m), and β is the pathlength amplification or “β factor” (Butler, 1962). The β factor is an empirical formulation defined as the ratio of optical to geometric pathlength that corrects for multiple scattering inside the filter. In this study, an average of two published β factor formulations (Bricaud and Stramski, 1990; Nelson et al., 1993) was used as follows:
Spectra with ODp(675) less than 0.04 were omitted from this study (Bissett et al., 1997) to minimize artifacts due to uncertainty in the β factor (Mitchell and Kiefer, 1988a; Bricaud and Stramski, 1990; Cleveland and Weidemann, 1993; Nelson et al., 1993; Moore et al., 1995; Lohrenz, 2000). All other spectra were set to zero at 750 nm or above to correct for residual scattering caused by non-uniformity in wetness between the sample and reference filters or for stray light.
Using Eqs. 2a and 2b, the phytoplankton absorption coefficient, aph(λ), were calculated as follows:
aph(λ)=ap(λ)−ad(λ) (4)
Fluorometric chlorophyll and phaeopigment concentrations were determined on the filtrate of phytoplankton pigments extracted from the sample filter with hot 100% methanol using a Turner 10-AU-005 fluorometer according to the methods of Holm-Hansen and Riemann (1978). Finally aph(λ) was converted to chlorophyll-a specific absorption coefficient (a*ph(λ)) dividing by chlorophyll-a concentration. The local maxima of the phytoplankton absorption coefficient spectra near 440 nm were usually observed in the range of 440+5 nm, respectively. Therefore, the magnitude of phytoplankton and chlorophyll-specific absorption coefficients at 440 nm was obtained by averaging spectra from the above range of wavelengths.
3. RESULTS AND DISCUSSION
3.1. Classification of Phytoplankton Based on Pigment Compositions
Phytoplankton in the NEGOM was grouped into three major classes based on pigment compositions as per
Vidussi et al. (2001). Index was developed using pigment compositions to derive cell-size class markers of phototroph groups, such as picophytoplankton (<2 μm), nanophytoplankton (2-20 μm), and microphytoplankton (>20 μm) as follows:
Pigment markers for picophytoplankton (<2 μm) used were Zeaxanthin (biomarker for cyanobacteria and prochlorophytes e.g., Guillard et al., 1985; Chisholm et al., 1988; Gieskes et al, 1988), Divinyl-chlorophyll a (biomarker for prochlorophytes e.g., Gieskes and Kraay, 1983; Chisholm et al., 1988; Goericke and Repeta, 1992), and Chlorophyll b+Divinyl-chlorophyll
b (biomarkers for green flagellates and prochlorophytes e.g., Jeffrey, 1976; Partensky et al., 1993; Simon
et al., 1994; Moore et al., 1995). Pigment markers for nanophytoplankton
used were 19’hexanoyloxy-fucoxanthin, 19’butanoyloxy-fucoxanthin (biomarker for chromophytes nanoflagellates e.g., Arpin et al., 1976; Wright and Jeffrey, 1987; Hooks et al., 1988; Bjornland et al., 1989; Bjornland and Liaaen-Jensen, 1989; Andersen
et al., 1993) and Alloxanthin (a biomarker for cryptophytes e.g., Gieskes and Kraay, 1983).
Pigment markers for microphytoplankton used were Fucoxanthin (a biomarker for diatoms e.g., Kimor
et al., 1987; Wright and Jeffrey, 1987; Hooks et al., 1988; Bjornland and Liaaen-Jensen, 1989) and Peridinin (a biomarker for dinoflagellates e.g., Johansen et al., 1974; Kimor et al., 1987).
DP(Diagnostic Pigments) = (Zea+ chl_b+Allo+19’-HF+19’-BF+ Fuco+Peri) (5) BPpico=(Zea+chl_b)/DP (6) BPnano=(Allo+19’-HF+19’-BF)/DP (7) BPmicro=(Fuco+Peri)/DP (8)
where BPpico=Biomass Proportion of picophytoplankton, BPnano= Biomass Proportion of nanophytoplankton, BPmicro=Biomass Proportion of micro-phytoplankton, Zea=[zeaxanthin], chl_b=[chlorophyll_b],
Allo=[alloxanthin],
19’-HF=[19’hexanoyloxyfucoxanthin], 19’-BF=[19’butanoyloxyfucoxanthin], Fuco=[fucoxanthin], Peri=[peridinin]. Distribution of biomass proportion for microphytoplankton, nanophyto-plankton and picophytonanophyto-plankton are presented in Figures 2, 3, and 4. Relatively high biomass proportions of microphytoplankton (diatoms and dinoflagellates) were observed in the inshore particularly near the major river mouths with relatively low values found offshore. During summer cruises, relatively high biomass proportions of microphytoplankton were also observed in the offshore region (Figure 2) along the Mississippi River plume. It seems that relatively high biomass proportions of microphytoplankton were associated with low salinity (Nababan, 2005). This trend is consistent with those shown in Qian et al. (2003) in which they applied different methods to quantify the abundance and distribution of diatoms in the same region.
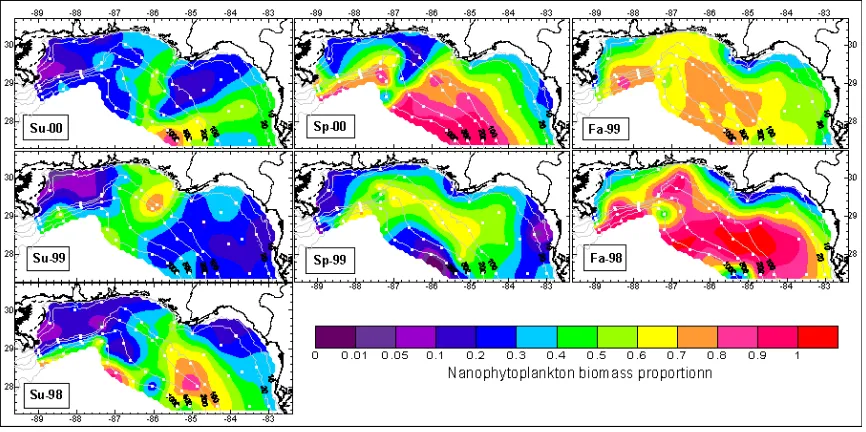
Relatively high values of biomass proportion for nanophytoplankton (chromophytes nanoflagellates and cryptophytes) were observed particularly offshore, and were relatively low inshore. Relatively high biomass proportion for nanophytoplankton were associated with low chlorophyll-a concentrations. During
summer, it appeared that relatively low nanophytoplankton biomass proportions extended offshore following the Mississippi River plume (Figure 3).
The abundance of the picophyto-plankton group (cyanobacteria, prochlorophytes and green flagellates) was mixed along the NEGOM but relatively high biomass proportions were only observed in late spring (Sp-99) and summer (Su-98, Su-99, Su-00) over the outer shelf and slope (Figure 4) in mostly oligotrophic waters since this group is a nitrogen fixer phytoplankton. This pattern was also consistent with the observation conducted by Qian et al. (2003).
3.2. Variation in Chlorophyll-Specific Absorption Coefficient
The chlorophyll-specific absorption coefficient at 440 nm was found to be highly variable in the NEGOM region for all cruises (Figure 5). a*ph(440) varied by about a factor of 7 ranging from 0.02 to 0.15 m2 mg-1 for the chlorophyll-a range of 0.06-12.25 mg m-3 over the study period (Figure 5). Variability of a*ph(673) was less pronounced and only varied by a factor 2. For chlorophyll-a range of 0.06-12.25 mg m-3 over the study period, a*ph(673) ranged from 0.0100 to 0.0248 m2 (mg chl)-1 with the average value of 0.0175 m2 (mg chl)-1.
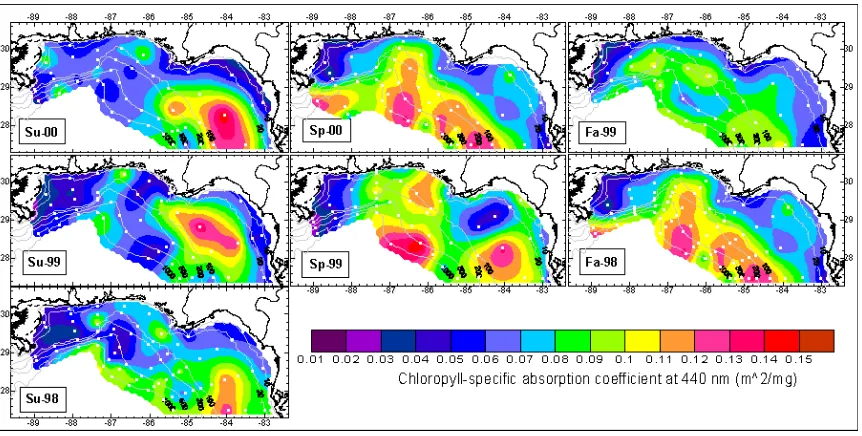
Near-surface spatial and temporal variability of a*ph(440) for seven cruises is presented in Figure 6. There was a general trend of increasing a*ph(440) with distance from shore where chlorophyll-a
Figure 2. Spatial Distribution of Biomass Proportion of Cell Size Marker for Micro- phytoplankton. See Table 1 for Cruise Identification.
Figure 4. Spatial Distribution of Biomass Proportion of Cell Size Marker for Pico- phytoplankton. See Table 1 for Cruise Identification.
Figure 6. Near-surface Distribution of the Chlorophyll-specific Absorption Coefficient at 440 nm in the NEGOM. White dots show location of water sample collections. See Table 1 for cruise identification.
were observed along the inner shelf and specifically near river mouths including the Mississippi, Mobile, Apalachicola and Suwannee river outflow regions. The general spatial pattern of a*ph(440) seemed to relate to general spatial pattern zeaxanthin (a biomarker for cyanobacteria) (Nababan, 2005) and biomass proportion of nanophyto-plankton (see Figure 3), indicating increase in a*ph(440) values associated with increase small-celled phytoplankton. Meanwhile, the opposite pattern was observed between a*ph(440) and biomass proportion of microphytoplankton (see Figure 2), indicating decrease in a*ph(440) values associated with increase large-celled phytoplankton. The a*ph(440) values were also higher in areas of lower chlorophyll-a concentration and vice versa. The positive relationship between a*ph(440) and small-celled phytoplankton and the negative relationship between a*ph(440) and large-celled phytoplankton and chlorophyll-a concentration suggesting that particle size (packaging effect) played a role in determining a*ph(440) variability. Because the
relationship between a*ph(440) and chlorophyll-a concentration was not linear (Nababan, 2005), pigment composition also likely played a role in determining a*ph(440) variability (Morel and Bricaud, 1981; Carder et al., 1986, 1999; Morel and Bricaud, 1986; Bricaud
et al., 1988; Mitchell and Kiefer, 1988a; Berner et al., 1989; Stramski and Morel 1990; Kirk, 1994; Fujiki and Taguchi, 2002; Lohrenz et al., 2003). The spatial distribution of a*ph(440) also followed salinity patterns (Nababan, 2005). Low salinity, with a higher nutrient content, may have played a role in selecting for species with low a*ph(440). However, there was no statistical relationship between surface nutrient concentrations (NO2+NO3+NH4+Urea) and a*ph(440), likely because nutrients are consumed as fast as they are supplied.
were grouped into the three corresponding cell size markers. Scatter plots of a*ph(440) and Biomass Proportion of cell size markers are presented in Figure 7. Although scatter is high, it seems that biomass proportion of nanophytoplankton and picophyto- plankton have a positive correlation with a*ph(440). While, microphytoplankton showed negative correlation suggesting higher abundance of microphytoplankton
lowered the value of a*ph(440) (Figure 7). The average value of a*ph(440) corresponding to the major biomass proportion of microphytoplankton was also significantly lower than that of nanophytoplankton and picophyto-plantkon groups (Table 2). These results strongly suggest that an increase in cell size resulted in decrease a*ph(440) values or increase in pigment packaging.
Figure 7. Scatter Plots of a*ph(440) and Biomass Proportion per Algal Group for All Seven NEGOM Cruises.
Table 2. Mean Vlues of a*ph(440) for All Seven NEGOM Cruises Data Corresponding with the Three Major Size Cell Markers of Phytoplankton (BP>0.5).
ID Cell size markers N Mean SD Different From ID*
A nanophytoplankton 136 0.0875 0.0020 C
B picophytoplankton 64 0.0815 0.0029 C
C microphytoplankton 29 0.0484 0.0044 A,B
*
Average values were compared for the differences among cell size markers using the Least Significant Difference
4. Conclusions
Variability of a*ph(440) was more pronounced within a cruise than among the seasons. It varied by about a factor of 7, i.e. a*ph(440) ranged from 0.02 to 0.15 m2 mg-1 for the range of 0.06-12.25 mg m-3 chlorophyll-a concentration. In general, lower values of a*ph(440) were observed inshore particularly in the major rivers mouth regions. Higher a*ph(440) were observed offshore, associated with high salinity, and lower chlorophyll-a, except during summer when lower a*ph(440) were also observed offshore to the west of about 85°W in the low salinity Mississippi plume. Mean values of a*ph(440) in waters dominated by microphytoplankton (diatoms) were significantly lower than in waters with nanophytoplankton and picophyto-plankton communities, indicating particle size (packaging effect) play a role in determining a*ph(440) variability. The relationship between a*ph(440) and chlorophyll-a concentration was also not linear, indicating pigment composition also play a role in determining a*ph(440) variability.
Variability of a*ph(673) was less pronounced and only varied by a factor 2, i.e. a*ph(673) ranged from 0.0100 to 0.0248 m2 (mg chl)-1 with average value of 0.0175 m2 (mg chl)-1 for the range of 0.06-12.25 mg m-3 chlorophyll-a
concentration.
Acknowledgments: This research was supported by MMS Cooperative Agreement 1335-01-97-CA-30857 and by NASA grant NAG5-10738 awarded to Dr. Frank E. Muller-Karger, USF. I would like to express my appreciation to Drs. Frank E. Muller-Karger and Douglas C. Biggs for their scholarly advise, critical reviews and stimulating ideas for completing this research.
REFERENCES
Ahn, Y. H., A. Bricaud and A. Morel. 1992. Light backscattering efficiency and related properties of some phytoplankters. Deep Sea Res., Part A, 39:1835-1855.
Allali, K., A. Bricaud and H. Claustre. 1997. Spatial variations in the chlorophyll-specific absorption coefficients of phytoplankton and photosynthetically active pigments in the equatorial Pacific. J. Geophys. Res., 102(C6):12,413-12,423.
Arpin, N., W. A. Svec, and S. Liaaen-Jensen. 1976. A new fucoxanthin-related carotenoid from Coccolithus huxleyi. Phytochemistry, 15:16,193-16,209.
Babin, M., J. C. Therriault, L. Legendre and A. Condal. 1993. Variations in the specific absorption coefficient in natural phytoplankton assemblage: Impact on estimates of primary production. Limnol. Oceanogr., 38:154-177.
Berner, T., K. Wayman and P. G. Falkowski. 1989. Photoadaptation and the “package” effect in
Dunaliella tertiolecta (Chloro-phyceae). J. Phycol., 25:70-78. Bidigare, R. R., M. E. Ondrusek, J. H.
Morrow and D. A. Kiefer. 1990. In vivo absorption properties of algal pigments. Ocean Optics X, Proc. SPIE Int. Soc. Opt. Eng., 1302:290-302.
Bjornland, T., and S. Liaaen-Jensen. 1989. Distribution pattern of carotenoids in relation to chromophyte phylogeny and sytematics. In: The Chromophyte Algae: Problems and Perspectives. Geen, G. C., B. S. Leaderbeater, and W. L. Diver (Eds.). Clerendon, Oxford, England, U. K., pp. 37-60. Bricaud, A., A. Morel and L. Prieur.
1983. Optical efficiency factors of some phytoplankters. Limnol. Oceanogr., 28:816-832.
Bricaud, A., A. L. Bedhomme and A. Morel. 1988. Optical properties of diverse phytoplanktonic species: Experimental results and theoretical interpretation. J. Plankton Res., 10:851-873.
Bricaud, A. and D. Stramski. 1990. Spectral absorption coefficients of living phytoplankton and nonalgal biogenous matter: A comparison between the Peru upwelling area and the Sargasso Sea. Limnol. Oceanogr., 35(3):562-582.
Bricaud, A., M. Babin, A. Morel and H. Claustre. 1995. Variability in the chlorophyll-specific absorption coefficients of natural phytoplankton: Analysis and parameterization. J. Geophys. Res., 100:13,321-13,332.
Carder, K. L., R. G. Steward, J. H. Paul, and G. A. Vargo. 1986. Relationships between chlorophyll and ocean color constituents as they affect remote-sensing reflectance models. Limnol. Oceanogr., 31(2):403-413.
Carder, K. L., S. K. Hawes, K. A. Baker, R. C. Smith, R. G. Steward and B. G. Mitchell. 1991. Reflectance model for quantifying chlorophyll a
in the presence of productivity degradation products. J. Geophys. Res., 96:20,599-20,611.
Carder, K. L., Z. P. Lee, J. Marra, R. G. Steward, and M. J. Perry. 1995. Calculated quantum yield of photosynthesis of phytoplankton in the marine light-mixed layers (59°N, 21°W). J. Geophys. Res., 100(C4):6655-6663.
Carder, K. L., F. R. Chen, Z. P. Lee, S. K. Hawes, and D. Kamykowski. 1999. Semianalytic moderate-resolution imaging spectrometer algorithms for chlorophyll-a and absorption with bio-optical domains based on nitrate depletion temperatures. J. Geophys. Res., 104:5403-5421.
Carder, K. L., F. R. Chen, J. P. Cannizzaro, J. W. Campbell, and B. G. Mitchell. 2004. Performance of the MODIS semi-analytical ocean color algorithm for chlorophyll-a.
Advances in Space Research,
33:1152-1159.
Ciotti, A. M., J. J. Cullen, and M. R. Lewis. 1999. A semi-analytical model of the influence of phytoplankton community structure on the relationship between light attenuation and ocean color. J. Geophys. Res., 104(C1):1559-1578. Cleveland, J. S., and A. D. Weideman.
1993. Quantifying absorption by aquatic particles: A multiple scattering correction for glass-fiber filters. Limnol. Oceanogr., 38:1321-1327.
Cleveland, J. S. 1995. Regional models for phytoplankton absorption as a function of chlorophyll a
concentration. J. Geophys. Res., 100(C7):13,333-13,344.
Gilbes, F., C. Thomas, J. J. Walsh, and F. E. Muller-Karger. 1996. An episodic chlorophyll-a plume on the west Florida shelf. Continental Shelf Res. 16(9):1201-1224.
Goericke, R., and D. J. Repeta. 1992. The pigments of Prochlorococcus marinus: The presence of divinyl chlorophyll a and b in a marine prokaryote. Limnol. Oceanogr., 37:427-433.
Gordon, H. R., O. B. Brown, R. H. Evans, J. W. Brown, R. C. Smith, K. S. Baker, and D. K. Clark. 1988. A semianalytic radiance model of ocean color. J. Geophys. Res., 93:10,909-10,924.
Guillard, R. R. L., L. S. Murphy, P. Foss, and S. Liaaen-Jensen. 1985. Syne-chococcus spp. As likelu zeaxanthin dominat ultraphytoplankton in the north Atlantic. Limnol. Oceanogr., 30:412-414.
Hoepffner, N., and S. Sathyendranath. 1991. Effect of pigment composition on absorption properties of phytoplankton. Mar. Ecol. Prog. Ser., 73:11-23.
Hoepffner, N., and S. Sathyendranath. 1992. Bio-optical characteristics of coastal waters: Absorption spectra of phytoplankton and pigment distribution in the western North Atlantic. Limnol. Oceanogr., 37:1660-1679.
Hoepffner, N., and S. Sathyendranath. 1993. Determination of the major groups of phytoplankton pigments from the absorption spectra of total particulate matter. J. Geophys. Res., 98, 22789–22803
Huh, O. K., W. J. Wiseman, and L. J. Rouse. 1981. Intrusion of Loop Current waters onto the West Florida shelf. Journal of
Geophysical Research, 86(C5):4,186-4,192.
Ishizaka, J. 1988. Spatial distribution of primary production during spring estimated by Ocean Color and Temperature Scanner (OCTS). J. Oceanogr., 54:553-564.
Johansen, J. E., W. A. Svec, S. Liaaen-Jensen, and F. T. Haxo. 1974. Carotenoids of the Dinophyceae.
Phytochem., 13:2261-2271.
Kiefer, D. A. and B. G. Mitchell. 1983. A Simple, steady state description of phytoplankton growth based on absorption cross section and quantum efficiency. Limnol. Ocenaogr., 28:770-776.
Kiefer, D. A., and J. B. SooHoo. 1982. Spectral absorption by marine particles of coastal waters of Baja California. Limnol. Oceanogr., 27:492-499.
Kirk, J. T. O. 1994. Light and hotosynthesis in aquatic ecosystem. 2nd ed. Cambridge University Press. Cambridge, 509 pp.
Kishino, M., M. Takahashi, N. Okami, and S. Ichimura. 1985. Estimation of the spectral absorption coefficients of phytoplankton in the sea. Bull. Mar. Sci., 37:634-642. Lee, Z. P., K. L. Carder, T. G. Peacock,
C. O. Davis, and J. L. Mueller. 1996. Method to derive ocean absorption coefficients from remote-sensing reflectance. Appl. Opt., 35:453-462.
Lohrenz, S. E. 2000. A novel theoretical approach to correct for path-length amplification and variable sample loading in measurements of particulate spectral absorption by the quantitavie filter technique. J. Plankton Res., 22:639-657.
Mitchell, B. G. and D. A. Kiefer. 1988a. Chlorophyll a-specific absorption and fluorescence excitation spectra for light-limited phytoplankton.
Deep Sea Res., Part A., 35:639-663. Mitchell, B. G. and D. A. Kiefer. 1988b.
Variability in pigment specific particulate fluorescence and absorption spectra in the northeastern Pacific Ocean. Deep Sea Res., Part A., 35:665-689. Moore, L. R., R. Goericke, and S. W.
Chisholm. 1995. Comparative physiology of Synechococcus and
Prochlorococcus: influence of light and temperature on growth, pigments, fluorescence and absorptive properties. Mar. Ecol. Prog. Ser., 116:259-275.
Morel, A. 1988. Optical modeling of the upper ocean in relation to its biogenous matter content (case I waters). J. Geophys. Res., 93(C3):10,749-10,768.
Morel, A. and A. Bricaud. 1981. Theoretical results concerning light absorption in a discrete medium, and application to specific absorption of phytoplankton. Deep-Sea Res., 28:1375-1393.
Morel, A. and A. Bricaud. 1986. Inherent optical properties of algal cells including picoplankton: theoretical and experimental results. Can. Bull. Fish. Aquat. Sci., 214:521-559.
Morel, A. and J. M. Andre. 1991. Pigment distribution and primary production in the western Mediterranean as derived and modeled from coastal zone color scanner observations. J. Geophys. Res., 96(C7):12,685-12,698.
Morel, A., Y. Ahn, F. Partensky, D. Vaulot and H. Claustre. 1993.
Prochlorococcus and Synecho-coccus: A comparative study of their optical properties in relation to their size and pigmnetation. J. Mar. Res., 51:617-649.
Muller-Karger, F. E., J. J. Walsh, R. H. Evans, and M. B. Meyers. 1991. On the Seasonal Phytoplankton Concentration and Sea Surface Temperature Cycles of the Gulf of Mexico as Determined by Satellites.
J. Geophys. Res., 96(C7):12645-12665.
Muller-Karger, F. E. 2000. The spring 1998 Northeastern Gulf of Mexico cold water event: Remote sensing evidence for upwelling and for eastward advection of Mississippi water (or: How an errant Loop Current Anticyclone took the NEGOM for a spin). Gulf of Mex. Sci., 18(1):55-67.
Nababan, B. 2005. Bio-Optical variabi-lity of Surface Waters in the North-eastern Gulf of Mexico. Dissertation. College of Marine Science, University of South Florida, 158p.
Nelson, N. B., B. B. Prezelin, and R. R. Bidigare. 1993. Phytoplankton light absorption and the package effect in California coastal waters.
Mar. Ecol. Prog. Ser., 94:217-227. Qian, Y., A. E. Jochens, M. C. Kennicutt,
Roesler, C. S., M. J. Perry, and K. L. Carder. 1989. Modeling in situ phytoplankton absorption from total absorption spectra in productive inland marine waters. Limnol. Ocenaogr., 34:1510-1523.
Sakshaug, E., A. Bricaud, Y. Dandonneau, P. G. Falkowski, D. A. Kiefer, L. Legendre, A. Morel, J. Parslow, and M. Takahashi. 1997. Parameter of photosynthesis: Definition, theory and interpretation of results. J. Plankton Res., 19:1637-1670.
Sosik, H. M. and B. G. Mitchell. 1995. Light absorption by phytoplankton, photosynthetic pigments and detritus in the California Current System. Deep-Sea Research I, 42(10):1717-1748.
Stramski, D. and A. Morel. 1990. Optical properties of photosynthetic picoplankton in different physiological states as affected by growth irradiance. Deep Sea Res., Part A., 37:245-266.
Suzuki, K., M. Kishino, K. Sasaoka, S. Saitoh, and T. Saino. 1998. Chlorophyll-specific absorption coefficients and pigments of phytoplankton off Sanriku, Northwestern North Pacific. J. Oceanogr., 54:517-526.
Weisberg, R. H. & R. He. 2003. Local and deep-ocean forcing contribu-tions to anomalous water properties on the West Florida Shelf. J. Geophys. Res., 108(C6): 3184, doi:10,1029/2002JC001407.