REVERSION OF THROMBOCYTOPENIA USING BOVINE SERUM ALBUMIN (BSA)
A Research Paper Presented To The Faculty of
Philippine Science High School – Western Visayas Brgy. Bitoon, Jaro, Iloilo City
In Partial Fulfilment Of the Requirements in SCIENCE RESEARCH 2
Isaiah Carlo S. Cabañero Philip Caesar M. Flores Antonio Miguel G. Tulio
TABLE OF CONTENTS
Abstract i
List of Tables ii
List of Figures iii
List of Plates iv
List of Appendices v
I.INTRODUCTION
A. Background of the Study 1
B. Objectives of the Study 3
C. Hypotheses of the Study 4
D. Significance of the Study 4
E. Scope and Delimitations of the Study 5
F. Definition of Terms 6
II.REVIEW OF RELATED LITERATURE
A. Platelets 8
A.1 Description of Platelets 8
A.2 Production of Platelets 9
A.3 Role Platelets in the Human Body 10
A.4 Categories of Thrombocytopenia 11
B. Albumin 13
B.1 Description of Albumin 13
B.2 Production of Albumin 15
B.3 Role of Albumin in the Human Body 16
B.4 Other Forms of Albumin and Their Sources 17
C. Relationship Between Platelets and Albumin 18
D. White Mouse (Mus musculus) 18
D.1 Background on Mus musculus (white mice) 17
D.2 Validity of White Mice as Model Organisms for Blood Studies 19
D.4 Proper Maintenance, Care, and Use 21
D.5 Proper Labeling 22
D.6 Proper Restraint 23
D.7 Proper Disposal 23
E. Blood Collection 24
E.1 Extraction of Blood 24
E.2 Handling, Storage, and Transport of Blood 24
E.3 Determination of the Number of Platelets 25
F. Related Studies 25
III. METHODOLOGY
A. Research Design 27
B. Preparation of Solutions 29
B.1 Preparation of 10X Phosphate-buffered Saline Solution 29
B.2 Preparation of Sterile Distilled Water 29
B.3 Preparation of 1% ammonium oxalate Solution 30
B.4 Preparation of Bovine Serum Albumin Infusions 30
C. Preparation of Test Subjects 31
C.1 Maintenance and Feeding of Test Subjects 31
C.2 Assignment of Test Subjects 31
C.3 Preparation of the Thrombocytopenic Group 31
D. Collection of Blood Samples 32
E. Determination of the Number of Platelets 32
F. Infusion of Albumin to Test Subjects 33
G. Analysis of Data Gathered 34
IV.RESULTS AND DISCUSSION
A. Results 35
B. Discussion 43
Summary of Findings 46
Conclusions 46
Recommendation 47
Literature Cited 48
Reversion of thrombocytopenia using bovine serum albumin (BSA) Cabañero I.C.S., Flores P.C.M., and Tulio A.M.G.
Philippine Science High School – Western Visayas Campus, Bitoon, Jaro, Iloilo City
[email protected]; [email protected]; [email protected]
ABSTRACT
Platelet transfusions are done to increase the number of platelets of a patient suffering from thrombocytopenia. However, due to post-complications that are present in patients who underwent this treatment, albumin transfusions, using fractionized human serum albumin, are acceptable as treatment. Bovine serum albumin has 80% sequence homology with human serum albumin by having a similar folding, which is why the two serum albumins are frequently used in biochemical studies. This study determined the percent increase in the number of platelets of thrombocytopenic Mus musculus (white mice) after the infusion of bovine serum albumin (BSA). The BSA infusions were administered to the test organisms intravenously. Blood samples of all the white mice were collected before and after the infusions of BSA using the tail-nicking method. The platelets were photographed under the microscope and were counted manually. In this study, alpha level of significance was set to 0.05. The results showed a significant increase in the numbers of platelets in all the subgroups of the Thrombocytopenic Group. The BSA infusions were able to increase the number of platelets of thrombocytopenic white mice after the infusions. But the increase was not higher than the increase in the number of platelets of thrombocytopenic white mice after normal recovery. Normal recovery from the induced thrombocytopenia had the highest percent increase in the number of platelets. A normal response to thrombocytopenia, the megakarcyocyte size and ploidy increases resulting to increased platelet production. During thrombocytopenia, elevated megakaryocyte mass serves as a ―sink‖ which results in the reduction in the levels of circulating thrombopoietin to achieve homeostasis. However, when the BSA was infused, the increase in the number of platelets was not higher compared to the increase in normal recovery from thrombocytopenia. It can be concluded that BSA does in fact have a role in platelet production but it is not yet known how it can affect the platelet production in thrombocytopenic mice. This supports the conclusion of Thon and Italiano (2010) that despite recent advances, the mechanistic processes of platelet production are not fully understood.
LIST OF TABLES TABLE
Table 1. The means of and the percent increase in the number of platelets of the thrombocytopenic and normal white mice for each subgroup before and after the BSA infusions.
36 Table 2. Results of the independent samples t-test before the BSA
infusions for Thrombocytopenic Group and Normal Group 36 Table 3. Result of the paired samples t-test for the number of platelets of
Subgroup Normal A (no treatment) 37
Table 4. Result of the paired samples t-test for the number of platelets of
Subgroup Normal B (0.2% BSA) 37
Table 5. Result of the paired samples t-test for the number of platelets of
Subgroup Normal C (0.4% BSA) 37
Table 6. Result of the paired samples t-test for the number of platelets of
Subgroup Normal D (0.6% BSA) 38
Table 7.Results of the One Way Analysis of Variance (ANOVA) test of
the Normal Group after the series of BSA infusions 38 Table 8. Result of the paired samples t-test for the number of platelets of
Subgroup Thrombocytopenic A (no treatment) 39
Table 9. Result of the paired samples t-test for the number of platelets of
Subgroup Thrombocytopenic B (0.2%BSA) 39
Table 10. Result of the paired samples t-test for the number of platelets of
Subgroup Thrombocytopenic C (0.4% BSA) 40
Table 11. Result of the paired samples t-test for the number of platelets of
Subgroup Thrombocytopenic D (0.6% BSA) 40
Table 12. Results of the One Way Analysis of Variance (ANOVA) test of
the Thrombocytopenic Group after the series of BSA infusions 40 Table 13. Results of the independent samples t-test after the BSA infusions
for Subgroups A (no treatment) 42
Table 14. Results of the independent samples t-test after the BSA infusions
for Subgroups B (0.2% BSA) 42
Table 15. Results of the independent samples t-test after the BSA infusions
for Subgroups C (0.4% BSA) 42
Table 16. Results of the independent samples t-test after the BSA infusions
for Subgroups D (0.6%BSA) 42
Table 17. Results of the independent samples t-test after the BSA infusions
LIST OF FIGURES FIGURE
Figure 1. Other forms of albumin and their sources 17
Figure 2. Experimental Setup 29
Figure 3.The increase in the number of platelets in the Normal Group after
the BSA infusions. 38
Figure 4. The increase in the number of platelets in the Thrombocytopenic
LIST OF PLATES PLATE
Plate 1. Materials prepared for the preparation of the bovine serum albumin
infusion 67
Plate 1. Three concentrations (0.2%, 0.4%, 0.6%) of bovine serum albumin
infusion prepared in conical tubes 67
Plate 2. Mice cages accessorized each with a nest box, a gravity- fed water
bottle, and a food bowl 68
Plate 3. White mouse restrained for the induction of thrombocytopenia 68 Plate 4. White mouse injected with antiplatelet to induce thrombocytopenia 69 Plate 5. White mice heated for 5 minutes for the blood collection 69 Plate 6. Tail of the white mouse nicked during the blood collection
procedure 70
Plate 7. Blood samples stored in microcontainers with EDTA 70 Plate 8. White mouse infused with BSA infusion intravenously 71 Plate 9. Diluted blood sample in the reservoir of the capillary pipet 71
Plate 10. Hemacytometer 72
Plate 11. Diluted blood sample charged into the hemacytometer 72
Plate 12. Hemacytometer mounted under the microscope 73
LIST OF APPENDICES APPENDIX
Appendix A. Handling and Restraint 51
Appendix B. Manual Platelet Count 54
Appendix C. Physiological and General Data of the White Mouse 58
Appendix D. How to Adjust pH Levels 61
Appendix E. Raw Data 63
CHAPTER 1 INTRODUCTION
A. Background of the Study
Platelets or thrombocytes are cell fragments that function in the clotting system of the body. Normal numbers range from 150,000-350,000 platelets per μL in the human blood. A change in condition of the normal number of platelets in the blood can cause defective clotting functions and bleeding disorders which may lead to hemorrhage. This change in condition may be because of (1) failing platelet production, (2) increased platelet destruction, (3) dilution of platelets, or a combination of these in the body. Thrombocytopenia is the disorder in which there is an abnormally low number of platelets in the blood which, for humans, is less than 150,000 platelets per μL of blood.
platelet transfusions eventually become refractory, or not responsive, to further transfusions because of the development of alloantibodies to non-autologous platelets, or platelets from other donors except the patient himself (Buchholz and others 1973; Gardner 1974; Herzig and others 1975; Schiffer 1978; Nagasawa and others 1978). This is an example of a condition, called alloimmunity, in which the body gains immunity against foreign cells from another individual of the same species. Transfusion of human leukocyte antigen-matched (HLA-matched) platelets has been tried to solve the problem but it was observed that it also leads to the development of alloantibodies (Howard and Perkins 1978). Red cell alloimmunization has also been reported as one of the factors due to the contamination of platelets by red cells and hemolytic reactions in the donor plasma (Zoes and others 1977). Another problem is the fever, occurring hours after the platelet transfusion, which may be due to the formation alloantibodies already, bacterial or viral contamination, and protozoal infections in the blood.
When platelet transfusions fail in increasing the platelet count of the patient, thrombocytopenia becomes severe. This condition oftentimes results to hemorrhage on the part of the patient. If this hemorrhage continues, albumin levels in the blood will decrease and the patient will develop hypoalbuminemia, a deficit of albumin in the blood. This condition necessitates albumin infusion using fractionized human serum albumin to the patient. The administration of albumin to the body can control the accompanied symptoms until the underlying condition is diagnosed and/or treated. It can also be required sometimes to maintain the level of the systolic blood pressure.
as carrier of different materials like hormones, fatty acids, and drugs in the blood. Also, because it holds approximately 18 mL of water per gram of HSA, it is used as a plasma volume expander in the treatment of hemorrhage or shock through infusions. It is also used as a protein replacement in cases of very low protein levels in the serum. But there are also other forms of albumin other than HSA, and are found in many other animals. Bovine serum albumin (BSA), for example, is found in the blood of cows. Its primary biological function has been associated with its lipid binding properties. BSA is cheap and plentiful due to the fact that's it is a natural byproduct of the cattle industry. It is often used in restriction digestion to stabilize some specific enzymes during the digestion of DNA for studies, making it ideal for determining the quantities of other particular proteins present. It is also often used in cell generation, e.g. regenerating plants from cultured guard cells, by feeding the cell a healthy amount of protein leading to faster growth and improved healing. BSA is quite stable, which makes it ideal for scientific measures, in vaccine production, medical research, and food additives.
In this study, the number of platelets of thrombocytopenic Mus musculus (white mice) will be determined after the infusions of bovine serum albumin. The BSA will be experimented at different concentrations of BSA.
B. Objectives of the Study
Specifically, it aims:
1. To compare the number of platelets (in number of platelets per μL) of the (1) thrombocytopenic and (2) normal white mice (a) before and (b) after the BSA infusions
2. To compare the percent increase in the number of platelets of the thrombocytopenic and normal white mice after the BSA infusions
C. Hypotheses of the Study
There will be a significant difference in the number of platelets of thrombocytopenic white mice and will increase in number after the BSA infusions.
D. Significance of the Study
The use of another type of albumin, bovine serum albumin, which is homologous to the human serum albumin, will be tested on the Mus musculus (white mice) to find its capability in increasing the number of platelets of thrombocytopenic white mice.
Medicine entitled "The Perils of Platelet Transfusions" (1997). Also, the high cost of the procedure was mentioned in the reviews.
Fortunately, it is known that the use of albumin transfusion, using fractionized human serum albumin, is acceptable to treat patients with shock and hemorrhage – the loss of blood from the circulatory system by leaking through damaged or cut blood vessels in the body. These continuous bleedings may be prolonged by issues concerning malfunctions in platelets, like increased destruction of platelets in the circulatory system. However, fractionized human serum albumin is easily the most expensive volume expander (―Mollison‘s Blood Transfusion in Clinical Medicine‖, Klein and others 2005).
Still, this procedure is usually done instead of platelet transfusion. The present study aims to test the capability of bovine serum albumin in increasing the number of platelets in the body when infused by determining the percent increase in the number of platelets of thrombocytopenic white mice after the infusions of bovine serum albumin.
E. Scope and Delimitation
Observations on physical and behavioral changes on the white mice during the experiment will be recorded but will only be used as supplementary data.
The experimental procedures and the gathering and analysis of data from the study will be conducted for a duration of one month. The sample of BSA will be obtained from Chemline Scientific Corporation, Quezon City, Philippines and will be shipped to Philippine Science High School - Western Visayas. The white mice will be female, 6-8 weeks old, weighing about 10-20 ± 1 g, will be obtained from a private breeder, and will be transported to Philippine Science High School - Western Visayas Campus also, where it will be given time to acclimate and be monitored and regulated.
F. Definition of Terms
Thrombocytopenia – is a condition characterized by an abnormally low number of platelets, the irregular, disc-shaped elements in the blood that assist in blood clotting; can arise due to decreased production of platelets in the bone marrow or increased breakdown of platelets in the bloodstream, spleen, or liver (Medical Dictionary in MedTerms, 2009). In this study, thrombocytopenia is the induced depletion of platelets in the blood of the white mice. (Refer to appendix C for the normal number of platelets in white mice.)
In this study, bovine serum albumin from cows is the plasma protein responsible for the transport of large organic anions and certain hormones. This is the type of albumin in 10X phosphate-buffered solution that will be infused to the white mice.
Platelet – is a minute, colorless, disk-like body in mammalian blood that assists in blood clotting by adhering to other platelets and to damaged epithelium; is also called thrombocyte (Merriam-Webster Dictionary, 2010).
In this study, the platelet is referred to as the platelets of white mice.
Number of platelets – is the calculated number of platelets in a volume of blood usually expressed as ―number of platelets per cubic millimeter (mm3)‖ of whole blood
(Medical Dictionary in MedTerms, 1999).
In this study, the number of platelets will be expressed in ―number of platelets per
microliter (µL)‖. One mm3
is equal to 1 µL.
Infusion – is the introduction of a solution such as saline, sucrose, or glucose through a drip feed, intravenously, in order to treat or feed a patient (Microsoft Encarta Dictionaries, 2009).
CHAPTER 2
REVIEW OF RELATED ARTICLES
A. Platelets
A.1 Description of Platelets
Platelets are the smallest of the blood cells. Platelets, along with red blood cells and plasma, form a major proportion of both human and animal blood. Microscopically, they look like little spiky ovals, as the average size is about four hundred thousandths of an inch or 1.0-3.5 µm (Wisegeek [updated 2010]). Like the red blood cells, they lack a nucleus and are incapable of cell division, or mitosis, but they have a more complex metabolism and internal structure than the red blood cells (―blood‖ Encyclopaedia Britannica 2011). Platelets are only about 20% of the diameter of red blood cells. The normal number of platelets in humans is 150,000-350,000 platelets per microliter (µL) of blood. Since platelets are so small, they make up just a tiny fraction of the blood volume. Although much more numerous than the white blood cells, platelets occupy a smaller fraction of the volume of the blood because of their relatively small size.
proteins similar to muscle proteins that allow them to change shape when they become sticky (www.ouhsc.edu [updated 2009]).
Mouse platelets appear discoid when viewed by light or electron microscopy. On a blood smear, mouse platelets appear round to oval to elongated, and have a diameter of 1-4 µm. Platelet clumps are frequently observed on mouse blood smears. The presence of these platelet clumps invalidates the platelet count that is why the blood collected must be stored in an EDTA tube. The EDTA tube is a blood collection tube that protects the blood sample and its platelet and cells at its original condition for a longer time. Mouse platelets are known to differ from human platelets in a number of fundamental ways, including, platelet size and platelet number. Nonetheless, studies of fundamental aspects of platelet function are quite reassuring about the similarities between human and mouse platelets, and so there is reason to extrapolate the observations made in mice to humans.
A.2 Production of Platelets
Platelets arise from large megakaryocytes found in the bone marrow, which are derived from hematopoietic stem cells (HSC). HSCs generate the multiple hematopoietic lineages through a successive series of intermediate progenitors. These include common lymphoid progenitors (CLPs), which can generate only B cells, T cells, and natural killer cells, and common myeloid progenitors (CMPs), which can generate only red cells, platelets, granulocytes, and monocytes.
system. A megakaryocyte‘s brief lifetime follows a maturation process involving the
destruction and removal of the residual cell body and the nuclear material and culminates in the release of 100-1000 platelets.
Megakaryocytes are rare myeloid cells that reside primarily in the bone marrow but are also found in the lung and peripheral blood. They arise from pluripotent hematopoietic stem cells that develop into precursors. Development of these precursors continues along an increasingly restricted lineage culminating in the formation of megakaryocyte precursors that develop into megakaryocytes. Megakaryocytes tailor their cytoplasm and membrane systems for platelet biogenesis. They experience significant maturation as internal membrane systems, granules, and organelles are assembled in bulk during their development. As terminally differentiated megakaryocytes complete maturation, they are fully equipped with the elements and machinery required for the major task of platelet biogenesis (Patel and others 2005).
A.3 Role of Platelets in the Human Body
the factor VIII von Willebrand Factor (vWF) and probably fibronectin. When activated, platelets immediately change shape, losing their discoid shape, and form tiny spheres with numerous projecting pseudopods. After adhesion of a single layer of platelets to the damaged vascular endothelium, they stick to one another and form aggregates. Certain substances react with specific platelet membrane surface receptors and initiate platelet aggregation and further activation (Turgeon 1988).
Platelets are responsible for several distinct activities in response to vascular damage, including: (1) maintenance of vascular integrity by sealing minor deficiencies of the endothelium, (2) formation of a ―platelet plug‖ to initially stop
bleeding, (3) stabilization of the platelet plug by the action of phospholipid procoagulant, and (4) promotion of vascular healing (Turgeon 1988).
A study done by Poole and others (1997) stated the mouse platelets responded in a similar manner to human platelets when stimulated with collagen, but are less sensitive to thrombin.
A.4 Categories of Thrombocytopenia
Thrombocytopenia is any disorder in which there is an abnormally low amount of platelets in the blood. This condition may arise as a result of a wide variety of conditions such as severe bleeding or liver disease. Thrombocytopenic conditions are classified into three major categories: (1) decreased production of platelets, (2) increased destruction or utilization of platelets, and (3) disorders in platelet distribution (Turgeon 1988).
Decreased production of platelets can result from damage to hematopoietic stem cells of the bone marrow. This may be due to irradiation, drugs, chemicals, infiltration of the bone marrow by malignant cells, and non-malignant conditions. Thrombocytopenia of this type is a manifestation of a nutritional disorder (Turgeon 1988).
Increased destruction or utilization of platelets may result from a number of mechanisms. This may be due to antigens, antibodies, complement activities, snake bite, autoimmune and isoimmune disorders, and vascular injury (Turgeon 1988).
B. Albumin
B.1 Description
Albumin is a small, multifunctional, non-glycoselated, negatively charged plasma protein. It contributes over 50% of the total plasma protein. It is an umbrella term for a type of protein which is water soluble. Numerous types of albumin can be found all over the natural world, and two of the most familiar examples of albumin can be found in egg whites and in human blood. Albumin is an important class of protein, and they are vitally important to health and well being for many organisms. Many plants and animals contain or secrete albumin (Wisegeek [updated 2010]). Albumins are usually named according to where they are found in nature. For example, the albumin found in human blood serum is called human serum albumin (HSA).
Albumins contain, in all cases, the elements carbon, hydrogen, nitrogen, sulphur and oxygen; their composition, however, varies within certain limits. They also contain small amounts of carbohydrates and phosphoric acid. Its chemical formula is C720H1134N218S50241 (Encyclopedia.org [updated 2006]).
Albumin has high molecular weights. The various forms of albumins have a molecular weight ranging from about 34,000-70,000 g/mol. It is produced exclusively in the liver and secreted directly into the circulation. The half-life of albumin in the circulation is about 20 days and the liver has large reserves of albumin synthetic capacity (Sydpatd [updated 2001]).
polypeptide chain of 585 amino acids with a molecular weight of 66,500 g/mol (Articleonlinedirectory [updated 2010]).
Bovine serum albumin (BSA) is a large globular protein with a molecular weight of 66,000 g/mol in cows. BSA binds free fatty acids, other lipids, and flavor compounds, which can alter the heat denaturation of the protein. Its primary biological function has been associated with its lipid binding properties. BSA is cheap and plentiful due to the fact that's it's a natural byproduct of the cattle industry. This makes it ideal in vaccine production, medical research, and food additives. BSA is essentially a plasma protein that can be used to grow cells, test the proteins of other cells, and be added to a variety of food products. BSA is quite stable, which makes it ideal for scientific measures (Articleonlinedirectory [updated 2010]).
BSA is a common agent used in restriction digest to stabilize enzymes during the digestion of DNA for study. Albumin does not affect other enzymes that don‘t use it
B.2 Production of Albumin
Albumin is synthesized in the liver at a rate of 9-12 g per day in normal adults. Under physiological circumstances only 20–30% of hepatocytes produce albumin and synthesis can therefore be increased on demand by a factor of 200–300%. Changes in the rate of production are governed primarily by alterations in colloid osmotic pressure, and the osmolality of the extravascular hepatic space.
Albumin levels are dependent on the rate of synthesis: (1) the amount secreted from the liver cell, (2) the distribution in body fluids, and (3) the level of degradation.
Albumin is distributed into the extravascular spaces of all tissues, with the majority being distributed in the skin. Approximately 30-40% of albumin in the body is found within the vascular compartments of the muscle, skin, liver, gut, and other tissues.
Albumin enters the intravascular space via two pathways. First, albumin enters this space by entering the hepatic lymphatic system and moving into the thoracic duct. Second, albumin passes directly from hepatocytes into the sinusoids after traversing the Space of Disse, the space separating sinusoids from hepatocytes. Albumin has a circulation half-life of 16-18 hours.
Albumin distributes into the hepatic interstitial volume, and the concentration of colloids in this small volume is an osmotic regulator for albumin synthesis. This is the principal regulator of albumin synthesis during normal periods without stress.
capillaries, bone marrow, and liver sinuses. Albumin molecules apparently degrade randomly, with no differentiation between old and new molecules. Albumin degradation occurs at a rate of 9-12 g (or 4% of total body albumin) per day. Factors that accelerate albumin degradation are protein and calorie malnutrition, stress, trauma and septicemia. Any derangement in one or more of these processes will result to hypoalbuminemia, or abnormally low levels of albumin.
B.3 Role of Albumin in the Human Body
A review done by Abhasnee Sobhonslidsuk (2009) on human serum albumin enumerated the 5 major roles of albumin in the human body. It contributes to the (1) colloid osmotic pressure effect, (2) binding and transport of molecules, (3) free radical scavenging, (4) platelet function inhibition and anti-thrombotic effects, and (5) capillary membrane permeability.
For the colloid osmotic pressure effect, since albumin contributes to 60% of the intravascular protein, it provides 60% of the colloid osmotic pressure. Albumin attracts sodium ions by means of the negatively charged property, resulting in water retention and colloid osmotic pressure effect.
For the binding and transport of molecules, albumin can bind weakly and reversibly to drugs and metabolites including bilirubin, fatty acid, thyroxin, etc. because of its strong negative charge.
For the platelet function inhibition and anti-thrombotic effects, the albumin inhibits the rapid inactivation of nitric oxide and allows prolongation of its anti-aggregatory effects on platelets.
Lastly, for the capillary membrane permeability, albumin may directly influence vascular integrity by binding in the interstitial matrix and subendothelium and by altering permeability of these layers to large molecules and solutes.
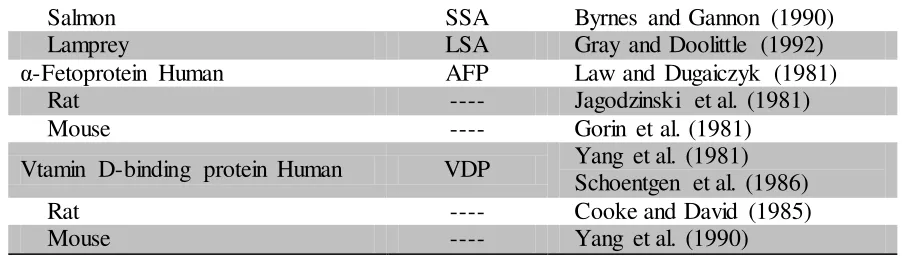
B.4 Other Forms of Albumin and Their Sources
Numerous types of albumin can be found all over the natural world, and two of the most familiar examples of albumin can be found in egg whites and in human blood. Albumin is an important class of protein, and they are vitally important to health and well being for many organisms. Many plants and animals contain or secrete albumin (Wisegeek [updated 2010]). Albumins are usually named according to where they are found in nature. For example, the albumin found in human blood serum is called human serum albumin (HSA).
Protein and Source Abbreviation Reference
Albumin
Human HSA
Behrens et al. (1975) Meloun et al. (1975 Lawn et al (1981) Dugaiczyk et al. (1982)
Bovine BSA Brown (1975)
Holowachuk (1991)
Equine ESA Ho et al. (1993)
Rat RSA Sargent et al. (1981)
Mouse MSA Minghetti et al. (1985)
Pig PSA Weinstock and Baldwin (1988)
Sheep OSA Brown et al. (1989)
Salmon SSA Byrnes and Gannon (1990)
Lamprey LSA Gray and Doolittle (1992)
α-Fetoprotein Human AFP Law and Dugaiczyk (1981)
Rat ---- Jagodzinski et al. (1981)
Mouse ---- Gorin et al. (1981)
Vtamin D-binding protein Human VDP Yang et al. (1981) Schoentgen et al. (1986)
Rat ---- Cooke and David (1985)
Mouse ---- Yang et al. (1990)
Figure 1. Other forms of albumin and their sources
C. Relationship Between Platelets and Albumin
A study conducted by O‘Neil and Ammit (1997) showed that the release of platelet -activating factor (PAF) in mouse embryos was dependent upon the extracellular albumin concentration exposed to them, with the amount of PAF released increasing as the albumin concentration increased. Small amounts of PAF were detected from the media with no albumin added. Other types of cells have demonstrated the same dependence of PAF to albumin (Benveniste and others 1972; Ludwig and others 1985). This may well be a general phenomenon, the authors suggested.
D. Mus musculus (White mice)
D.1 Background on Mus musculus (White mice)
1,200 U.S. research institutions, compared to a total of 1.2 million other species. Mice and rats together constitute approximately 90% of the total animals used for all research purposes (LAC-NUS 2007).
D.2 Validity of White Mice as Model Organisms for Blood Studies
Despite the fact that animal models have contributed a lot to our understanding of the pathological processes of various human diseases and their treatment, in many cases the issue of reliability or validity has prevented results from animal models from being readily used to develop successful clinical treatments. Animal models should have a genetic, naturally obtained, or induced pathological process that closely resembles the same conditions in humans. Useful models are described as correlational, isomorphic, or homologous, but generally, the most successful are homologous models, where both the etiology and clinical features of a disease in an animal model mirror those found in human patient.
The genetic characterization, the large number of strains available, and the large list of catalogued mutant genes provide animals suited for a number of different areas of research. Mice are easy to care for and handle, and are relatively inexpensive compared to other species. A high reproductive performance with a large litter size and a short gestation means that many generations can be produced in a relatively short period of time (LAC-NUS 2007).
between human and mouse platelets, and so there is reason to extrapolate the observations made in mice to humans.
The use of the mouse as a research animal has resulted in many scientific advancements. Much of our early understanding of the immune system was derived from studying the mouse. The use of the mouse continues to be an important part of various research endeavors including aging, embryology, cancer induction, pharmacological and toxicological testing, and infectious diseases research (LAC-NUS 2007).
D.3 Selection of Healthy White Mice
Categories of common behaviors of mice include: maintenance behaviors (grooming, eating, drinking, nesting); investigative/exploratory behaviors (climbing, digging, chewing, sniffing); and social interactions (huddling together, grooming one another, scent/territorial marking, aggression, defense, sexual behavior).
D.4 Proper Maintenance, Care, and Use
Proper care, use, and humane treatment of animals used in research, testing, and education require scientific and professional judgment based on knowledge of the needs of the animals and the special requirements of the research, testing, and educational programs.
Mice received from another site need to have adequate time to recover from shipping stress, this is known as acclimatization. The transportation of animals is stressful and leads to physiologic changes, such as increased cortisol levels, which may potentially alter research results. The length of time required may depend on the distance or time involved in transporting the mice but generally, a minimum of 48 hours is required for blood cortisol levels to return to baseline values. A quarantine or holding period will allow the mice to adapt to their new surroundings and permits observation for any signs of infectious disease (LAC-NUS 2007).
animals are used, and to the health and safety of personnel. A good management program provides the environment, housing, and care that permit animals to grow, mature, reproduce, and maintain good health; provides for their well-being; and minimizes variations that can affect research results (Guide for the Care and Use of Laboratory Animals, National Research Council 1996).
There are evidences that exist which suggest that singly housed mice may have a compromised immune system when compared to socially housed mice. Moreover, mice developed tumors faster when individually housed than when kept in groups. In rats, the provision of increased structural complexity has the potential to promote modifications in brain structure, physiology, and function. These changes are mediated via increased cortical thickness, increased dendritic spine density and increased concentrations of oligodendrocytes. Based on these evidences, the following guidelines are suggested for housing rats and mice in the laboratory:
Rats and mice benefit from being socially housed whenever possible.
Mice are timid but social animals. Contact with conspecifics is important.
A mouse housed alone may become more aggressive.
Adult male mice housed together may be very aggressive towards one another.
Mice benefit from being housed on nestable bedding or being provided with a
suitable substrate with which to build a nest. Rats also benefit from being provided
with increased structural complexity, i.e., nest box, platforms or paper towels.
Mice spend a great deal of time manipulating their bedding material, and if the
material allows they will build tunnels and nests.
Bedding material provides thermal insulation, absorbs fecal and urinary wastes, and
Material for bedding should be absorbent, not readily eaten, free of infectious agents
and injurious substances, and comfortable for the animals. Bedding may consist of
paper, hardwood chips, or corncob materials.
Avoid the use of materials like cotton or shredded paper in breeding cages.
D.5 Proper Labeling
Appropriate identification method for the mice is important. The choice of identification should be based on the age of the animal you wish to identify, the number of characters you wish to include, and the duration of your experiment. Indelible markers can be used for short-term identification. Non-toxic, permanent markers can be used to temporarily mark the fur, tail or skin of the animal. This ink, depending on the location, usually lasts 3 - 4 days without the need to remark. Alternatively, ear punches, microchips, and tattooing are all permanent procedures. Ear tags can be long-term, but there is always a chance they can become detached from the ear.
D.6 Proper Restraint
mouse by the scruff of the neck. Both of these restraining methods are only used for brief restraint; for example transferring animals from cage to cage. Scruff restraint and mechanical restrainers are used for procedures that require more than momentary restraint, such as injection or blood withdrawal.
D.7 Proper Disposal
When performing euthanasia on the mice, the procedure must be approved by the Institutional Animal Care and Use Committee (IACUC). Mice may be euthanized using the CO2 chamber method. Compressed CO2 gas is the only recommended
source of CO2 for euthanasia. Carbon dioxide generated from dry ice is unacceptable. With an animal in a chamber, an optimal flow rate should displace 10 – 20% of the chamber volume per minute until the mouse is unconscious. This flow rate is associated with a rapid loss of consciousness and minimal distress to the animal. Once the mouse is unconscious, the flow rate can be increased. Gas flow should be maintained for at least 1 minute following apparent clinical death. Death should be verified by the absence of the heartbeat, performing cervical dislocation or by perforating the diaphragm prior to proper disposal of the animal.
E. Blood Collection
E.1 Extraction of Blood
E.2 Handling, Storage and Transport of Blood
When blood is collected in a glass tube, it solidifies or coagulates within 5-10 minutes, forming a clot. Clotting can be prevented by adding a special anticoagulant (fluoride oxalate, trisodium citrate, EDTA dipotassium salt solution, Wintrobe mixture) to the blood as soon as it is collected. Blood treated with an anticoagulant separates into two liquid components: (1) the plasma, a yellow liquid, and (2) the blood cells.
Blood can be refrigerated and stored for up to three weeks. The temperature should not exceed 2 – 8 degrees Celsius. A temperature recording device is recommended to be included with the transported samples to ensure the appropriate temperature has been maintained. It must not be stored with vaccines, reagents o medicines that require frequent use of the refrigerator.
The blood samples should be transported in a refrigerated state. No sample should be allowed to freeze, and should ideally be kept at a temperature of approximately 4 degrees. Transport of blood sample from site of collection to laboratory should be made in less than 48 hours.
E.3 Determination of the Number of Platelets
should be repeated. Clumps may be due to inadequate mixing of blood or to poor technique in obtaining the blood specimen.
F. Related Studies
Albumin decreases polymer surface affinity for platelets. When covalently linked via amino silanes, albumin decreases embolization from implanted silicone rubber rings. In these studies, mere exposure of the surface to albumin was sufficient to prevent a decline in the circulating platelet count for up to 6 hr in membrane oxygenator circuits. Furthermore, albumin reduced platelet release of granule contents (release of LA-PF4) and largely preserved platelet reactivity to the aggregating agents ADP and epinephrine. Preservation of platelet functional integrity was corroborated by electron microscopy, which demonstrated morphologically intact platelet granules. When an air interface was present, albumin was less effective in preserving platelet numbers and function. (Addonizio and others. 1979)
CHAPTER 3 METHODOLOGY
G. Research Design
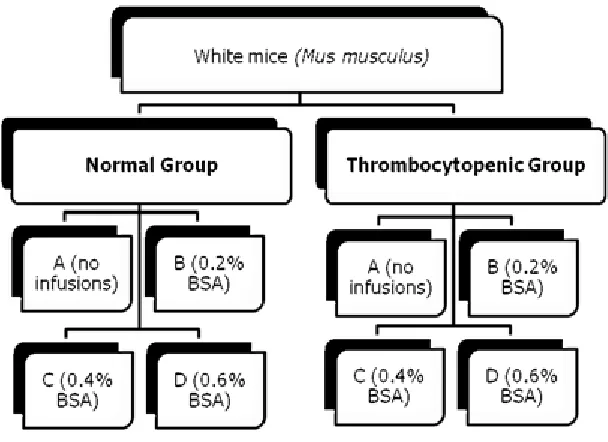
This study aimed to determine the percent increase in the number of platelets of thrombocytopenic Mus musculus (white mice) after the infusions of bovine serum albumin (BSA). The white mice used were female, 6-8 weeks old, and weighed 10-20 ± 1 g each. The white mice were obtained from a private breeder.
The experiment consisted of 2 groups: the Normal Group and the Thrombocytopenic Group.
The Normal Group was composed of 4 subgroups (A, B, C, and D), which had 4 white mice in each. The total number of white mice in this group was 16. The white mice of this group were not induced with thrombocytopenia, but were still treated with BSA infusions. Subgroup B was treated with 0.2% BSA infusions, Subgroup C with 0.4% BSA infusions, and Subgroup D with 0.6% BSA infusions. The treatment of BSA infusion was administered intravenously. Subgroup A was not treated with BSA infusions and served as the negative control.
On Day 1, all the test subjects and the needed materials and chemicals were prepared; this included the induction of thrombocytopenia to the white mice of the Thrombocytopenic Group and the preparation of the BSA infusions.
On the next day, Day 2, blood samples of all the test subjects were collected through tail-nicking method. The blood samples were collected using a microcontainer with EDTA, were diluted in 1:100 dilution of 1% ammonium oxalate solution, were charged into a hemacytometer, and were mounted under a 40X light microscope. The number of platelets of each blood sample was counted and was recorded as the number of platelets before the treatment. Each subgroup then received their corresponding concentrations of BSA infusions intravenously after the blood collection.
BSA infusions were again received by the test subjects 24 hours after (Day 3) and 48 hours after (Day 4) the first BSA infusions. Subgroups A of both groups received no BSA infusions. Subgroups B of both groups received 0.2% BSA infusions; subgroups C received 0.4% BSA infusions, and subgroups C received 0.6% BSA infusions.
On Day 5, blood samples of all the test subjects were collected through tail-nicking method again. The blood samples were also collected using a microcontainer with EDTA, were also diluted in 1:100 dilution of 1% ammonium oxalate solution, were also charged into a hemacytometer, and were also mounted under a 40X light microscope. The number of platelets of each blood sample was counted and was recorded as the number of platelets after the treatment.
Figure 2. Experimental Setup
H. Preparation of Solutions
B.1 Preparation of 10X Phosphate-buffered Saline Solution
Eighty grams of NaCl, 2 g of KCl, 14.4 g of Na2HPO4, and 2.4 g of KH2PO4 were
dissolved in 800 mL distilled water. Solutes were weighed using an analytical balance. Using the pH meter, the pH of HCl solution was adjusted to 7.2. The volume of the solution was then brought to 1 L (―10X PBS Buffer Recipe‖, Bioprotocols.info
[updated 2010]).
B.2 Preparation of Sterile Distilled Water
[image:39.612.185.489.86.307.2]for 15 minutes and was poured into the jars (Home Care Services, Seattle Children‘s
Hospital 2009).
B.3 Preparation of 1% ammonium oxalate Solution
In a 1L beaker, 1L of distilled water, 11.45 g ammonium oxalate, 1.0 g Sorensen‘s Phosphate Buffer (from BioLegend, Incorporated, USA), and 0.1 g
Thimerosal were mixed together.
B.4 Preparation of Bovine Serum Albumin Infusions
I. Preparation of Test Subjects
The test subjects of the study were 32 white mice (Mus musculus) of ages 6-8 weeks old. The white mice were female and weighed 10-20 ± 1 g each.
C.1 Maintenance and Feeding of Test Subjects
The white mice were housed in a cage for the whole duration of the experiment. There were eight mice cages of dimensions 7.5‖ x 10‖ x 5‖ (L x W x H); only one subgroup is to one cage. The cages were made of wood, aluminum wire, and screen. The cages also had some accessories which included a nest box, gravity-fed water bottle, and a food bowl. The cages were labeled as A, B, C, and D for the four subgroups of both the Normal Group and the Thrombocytopenic Group. The white mice were caged inside the Research Laboratory in Philippine Science High School – Western Visayas Campus for the whole duration of the study.
All the subgroups were fed with mice pellets in ad libitum every day. Feeding was served on a free-choice basis. Plenty of fresh, clean water in feeding bottles was also available to the white mice at all times.
C.2 Assignment of Test Subjects
The white mice were assigned randomly to each subgroup using random assignment. They were put in a common container, picked one by one, and put one by one into each subgroup‘s cage in this order: Normal A, Normal B, Normal C, Normal
C.3 Preparation of the Thrombocytopenic Group
The method used by Crow and others (2003) was adapted in this study to induce thrombocytopenia to the white mice. Two µg of the 0.5 mg/ml rat anti-white mice antiplatelet antibody MWReg30 already in 200 µL Phosphate-buffered saline (PBS) of pH 7.2 (from Genomax Technologies, Singapore) was injected to the white mice intraperitoneally. The white mice were restrained properly (refer to Appendix A) and were held at a slightly downward angle. The surface of the area to be injected was disinfected first by rubbing cotton in 75% alcohol on the area. Then, the 26G ½‖
needle of the 1 mL syringe was injected on the left side of the white mice, halfway between the midline and the top of the hind leg, at approximately 0.5 cm deep into the abdominal cavity and at an angle of 15-20. The solution was then injected slowly into the white mice at a constant rate. After that, the needle was removed and the white mice were put down gently. The white mice will have to become thrombocytopenic after 24 hours according to Crow and others (2001).
J. Collection of Blood Samples
general area around the midline of the tail. Blood was allowed to flow or drop into microcontainer with EDTA. The tail was not squeezed nor was not attempted to be milked to avoid tissue damage and contamination of the blood sample with tissue fluids. Good hemostasis was ensured using a sterile gauze pad after the appropriate volume of 0.25-0.50 mL of blood has been collected.
K. Determination of the Number of Platelets
Ten µL of blood from the blood sample was diluted in 1:100 dilution of 1% ammonium oxalate solution (refer to section B.3). It was transferred to a reservoir using a capillary pipet. It was allowed to stand for 10 minutes to allow erythrocytes to hemolyze. The diluted blood was then charged on a clean hemacytometer by gently squeezing the sides of the reservoir to expel the contents until the chamber has been properly filled. The hemacytometer was put under a petri dish with a moistened filter paper together with it to prevent evaporation. It was allowed to stand there for 10 minutes to allow the cells to settle. The hemacytometer was mounted under a 40X light microscope and was photographed for the platelets to be counted. The number of platelets in all the 25 small center squares of the hemacytometer counting chamber was counted, wherein the first row, platelets will be counted from left to right, and right to left in the second row and so on. The number of platelets counted was averaged and was multiplied by 1000 to get the total platelet count of the white mouse. The data gathered was in ―number of platelets per
laboratory manual of ―Manual Platelet Count‖ by Austin Community College District,
TX (2010).
L. Infusion of Albumin to Test Subjects
The volume of the BSA infusion administered was only 1% of the total body weight in volume (Total Blood Volume) of the white mice. The white mice‘s weight, weight in
volume, and volume to be administered was recorded. The tail was grasped at the distal end, with the index and middle fingers of the non-dominant hand placed around the tail where the sterile 26G ½‖ needle of the 1 mL syringe was inserted. The thumb and ring
fingers held the lower part of the tail just below the injection site. Slight opposing pressure was applied to straighten and stabilize the tail, but was released before administering the albumin into the vein. Both the white mice from the Normal and Thrombocytopenic Groups received BSA infusions. This method was in accordance to the Institutional Animal Care and Use Committee (IACUC) Standard Procedures.
M.Analysis of Data Gathered
CHAPTER 4
RESULTS AND DISCUSSION
A. Results
This study determined the percent increase in the number of platelets of Mus musculus (white mice) induced with thrombocytopenia after the intravenous infusions of bovine serum albumin (BSA) solution of varying concentrations (0.2%, 0.4%, and 0.6%). The experiment was composed of two groups: the Normal Group and the Thrombocytopenic Group. Each group consisted of four subgroups namely A, B, C, and D. Each subgroup contained 4 white mice, which weighed 10-20 ± 1 g each. Subgroups A received no BSA infusions; Subgroups B received 0.2% BSA infusions; Subgroups C received 0.4% BSA infusions; and Subgroups D received 0.6% BSA infusions. The numbers of platelets before and after the infusions were counted and the percent increase in the number of platelets were compared, and were the basis for determining the capability of BSA infusions in increasing the number of platelets of thrombocytopenic white mice.
Before the BSA infusions, subgroup D of the Normal Group had the highest number of platelets while the subgroup C of the Thrombocytopenic Group had the lowest number of platelets.
Table 1. The means of and the percent increases in the number of platelets of the thrombocytopenic and normal white mice for each subgroup before and after the BSA infusions.
Concentration of BSA infused
Thrombocytopenic Group Normal Group
Before After
Percent Increase
(%)
Before After
Percent Increase
(%)
None 89,750 289,250 222.280 141,250 183,250 29.730
0.2% 104,000 169,000 62.500 127,750 156,000 22.110
0.4% 88,750 257,250 189.860 113,250 136,000 20.090
0.6% *106,000 237,250 123.820 153,750 162,500 5.690
* mean of three replicates only
A.1 Comparison of Number of platelets of the Thrombocytopenic Group and
Normal Group before the BSA infusions
The number of platelets before the BSA infusions of all the white mice in the Thrombocytopenic Group and Normal Group was compared using independent samples t-test and results of the test showed that there was a significant difference in the number of platelets between the two groups before the BSA infusions.
Table 2. Results of the independent samples t-test before the BSA infusions for Thrombocytopenic Group and Normal Group
t-test for Equality of Means
Group n Mean Std.
Deviation t df
Sig. (2-tailed)
Thrombocytopenic 15 96,533.333 27,853.870
-2.780 29 0.009
Normal 16 134,000.000 44,663.184
A.2 Number of platelets of the Normal Group Before and After the BSA
infusions
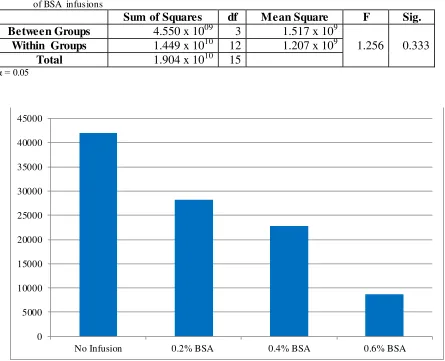
[image:47.612.104.546.372.448.2]The number of platelets before and after the BSA infusions of the Normal Group was compared using paired samples t-test and results of the test showed that there was no significant increase in the number of platelets of normal white mice infused with varying concentrations of BSA solution. However, there was a significant increase in the number of platelets of Subgroup A, which was not infused with any BSA solution. The increase in the number of platelets in the other subgroups, although not significant, decreases as the concentration of the infused BSA solution increases.
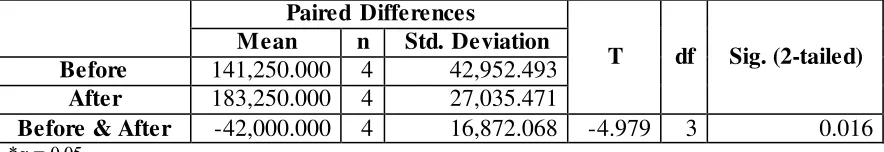
Table 3. Result of the paired samples t-test for the number of platelets of Subgroup Normal A (no treatment)
Paired Differences
T df Sig. (2-tailed)
Mean n Std. Deviation
Before 141,250.000 4 42,952.493
After 183,250.000 4 27,035.471
Before & After -42,000.000 4 16,872.068 -4.979 3 0.016
*α = 0.05
Table 4. Result of the paired samples t-test for the number of platelets of Subgroup Normal B (0.2% BSA)
Paired Differences
T df Sig. (2-tailed)
Mean n Std. Deviation
Before 127,750.000 4 42,750.244
After 156,000.000 4 33,536.050
Before & After -28,250.000 4 62,093.344 -9.100 3 0.430
[image:47.612.102.550.629.705.2]*α = 0.05
Table 5. Result of the paired samples t-test for the number of platelets of Subgroup Normal C (0.4% BSA)
Paired Differences
t df Sig. (2-tailed)
Mean n Std. Deviation
Before 113,250.000 4 17,346.950
After 136,000.000 4 50,332.230
Before & After -22,750.000 4 61,845.911 -7.360 3 0.515
Table 6. Result of the paired samples t-test for the number of platelets of Subgroup Normal D (0.6% BSA)
Paired Differences
t df Sig. (2-tailed)
Mean n Std. Deviation
Before 153,750.000 4 69,168.273
After 162,500.000 4 21,000.000
Before & After -8,750.000 4 83,344.166 -2.100 3 0.847
[image:48.612.111.556.236.597.2]*α = 0.05
Table 7.Results of the One Way Analysis of Variance (ANOVA) test of the Normal Group after the series of BSA infusions
Sum of Squares df Mean Square F Sig.
Between Groups 4.550 x 1009 3 1.517 x 10⁹
1.256 0.333
Within Groups 1.449 x 10¹⁰ 12 1.207 x 10⁹
Total 1.904 x 10¹⁰ 15
α = 0.05
Figure 3.The increase in the number of platelets in the Normal Group after the BSA infusions. This shows the number of platelets after the infusions subtracted by number of platelets before the infusions 0 5000 10000 15000 20000 25000 30000 35000 40000 45000
A.3 Number of platelets of the Thrombocytopenic Group Before and After the
BSA infusions
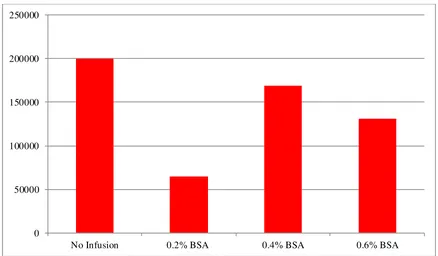
[image:49.612.102.547.399.473.2]The number of platelets before and after the BSA infusions of the Thrombocytopenic Group was compared using paired samples t-test and results of the test showed that BSA was able to increase the number of platelets of white mice induced with thrombocytopenia. All solutions were able to increase the number of platelets significantly but the 0.4% BSA solution showed to be the most effective in increasing the number of platelets, while the 0.2% BSA solution showed to be the least effective among the three concentrations. However, normal recovery from the induced thrombocytopenia showed the highest increase in the number of platelets.
Table 8. Result of the paired samples t-test for the number of platelets of Subgroup Thrombocytopenic A (no treatment)
Paired Differences
t df Sig. (2-tailed)
Mean n Std. Deviation
Before 89,750.000 4 16,859.715
After 289,250.000 4 63,767.155
Before & After -1,995,000.000 4 61,803.452 -6.456 3 0.008
*α = 0.05
Table 9. Result of the paired samples t-test for the number of platelets of Subgroup Thrombocytopenic B (0.2%BSA)
Paired Differences
t df Sig. (2-tailed)
Mean n Std. Deviation
Before 104,000.000 4 48,421.758
After 169,000.000 4 25,219.040
Before & After -65,000.000 4 31,885.211 -4.077 3 0.027
Table 10. Result of the paired samples t-test for the number of platelets of Subgroup Thrombocytopenic C (0.4% BSA)
Paired Differences
t df Sig. (2-tailed)
Mean n Std.
Deviation
Before 88,750.000 4 20,122.541
After 257,250.000 4 68,611.831
Before & After -1,685,000.000 4 61,125.554 -5.513 3 0.012
*α = 0.05
Table 11. Result of the paired samples t-test for the number of platelets of Subgroup Thrombocytopenic D (0.6% BSA)
Paired Differences
t df Sig. (2-tailed)
Mean n Std. Deviation
Before 795,00.000 4 55,584.770
After 237,250.000 4 106,756.343
Before & After -157,750.000 4 89,834.570 -3.512 3 0.039
*α = 0.05
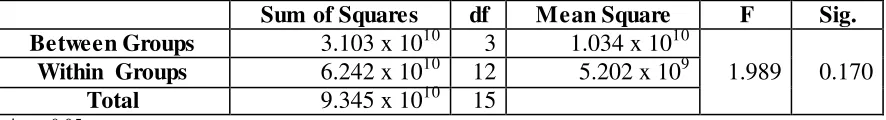
Table 12. Results of the One Way Analysis of Variance (ANOVA) test of the Thrombocytopenic Group after the series of BSA infusions
Sum of Squares df Mean Square F Sig.
Between Groups 3.103 x 10¹⁰ 3 1.034 x 10¹⁰
1.989 0.170
Within Groups 6.242 x 10¹⁰ 12 5.202 x 10⁹
Total 9.345 x 10¹⁰ 15
[image:50.612.100.546.95.189.2] [image:50.612.104.547.368.428.2]Figure 4. The increase in the number of platelets in the Thrombocytopenic Group after the BSA infusions. This shows the number of platelets after the infusions subtracted by number of platelets before the
infusions
A.4 Comparison of Number of platelets of the Thrombocytopenic Group and
Normal Group after the BSA infusions
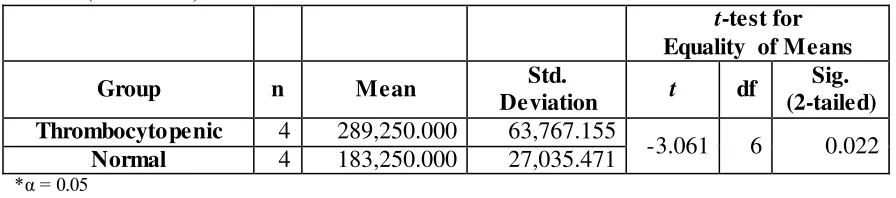
The number of platelets of the Thrombocytopenic Group and Normal Group after the BSA infusions were compared using independent samples t-test and results of the test showed that there was a significant difference in the number of platelets of Subgroups A and Subgroups C but there was no significant difference in the number of platelets of Subgroups B and Subgroups D.
0 50000 100000 150000 200000 250000
[image:51.612.119.557.68.324.2]Table 13. Results of the independent samples t-test after the BSA infusions for Subgroups A (no treatment)
t-test for Equality of Means
Group n Mean Std.
Deviation t df
Sig. (2-tailed)
Thrombocytopenic 4 289,250.000 63,767.155
-3.061 6 0.022
Normal 4 183,250.000 27,035.471
*α = 0.05
Table 14. Results of the independent samples t-test after the BSA infusions for Subgroups B (0.2% BSA)
t-test for Equality of Means
Group n Mean Std.
Deviation t df
Sig. (2-tailed)
Thrombocytopenic 4 169,000.000 25,219.040
0.620 6 0.558
Normal 4 156,000.000 33,536.050
*α = 0.05
Table 15. Results of the independent samples t-test after the BSA infusions for Subgroups C (0.4% BSA)
t-test for Equality of Means
Group n Mean Std.
Deviation t df
Sig. (2-tailed)
Thrombocytopenic 4 257,250.000 68,611.831
2.850 6 0.029
Normal 4 136,000.000 50,332.230
*α = 0.05
Table 16. Results of the independent samples t-test after the BSA infusions for Subgroups D (0.6%BSA)
t-test for Equality of Means
Group n Mean Std.
Deviation t df
Sig. (2-tailed)
Thrombocytopenic 4 237,250.000 1,067,586.000
1.374 6 0.219
Normal 4 162,500.000 21,000.000
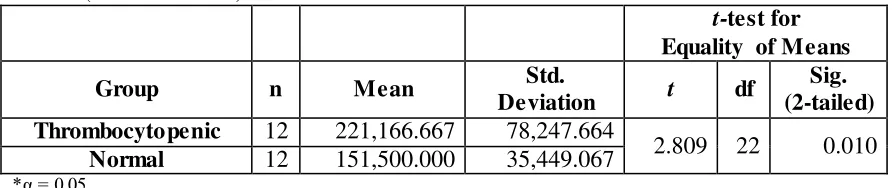
[image:52.612.101.549.93.192.2] [image:52.612.101.549.243.336.2] [image:52.612.100.551.532.625.2]Table 17. Results of the independent samples t-test after the BSA infusions (all concentrations)
t-test for Equality of Means
Group n Mean Std.
Deviation t df
Sig. (2-tailed)
Thrombocytopenic 12 221,166.667 78,247.664
2.809 22 0.010
Normal 12 151,500.000 35,449.067
*α = 0.05
B. Discussion
To determine if the Thrombocytopenic Group had thrombocytopenia, the number of platelets before the BSA infusions of all the white mice in the Thrombocytopenic Group and Normal Group was compared using independent samples t-test. Results of the test showed that there was a significant difference of number of platelets between the two groups, indicating that the white mice in the Thrombocytopenic Group indeed had thrombocytopenia.
The number of platelets before and after the BSA infusions of each subgroup was also compared. Paired samples t-test was used to determine if there were any significant changes in the number of platelets of the white mice in each subgroup after the series of BSA infusions. Results of the test showed that there was no significant increase in the number of platelets of the Normal Group after being infused with BSA (0.2%, 0.4%, and 0.6%), which means that the number of platelets in the Normal Group remained normal after the series of BSA infusions.
[image:53.612.102.548.93.187.2]BSA solution) having a 190% increase; next was Subgroup Thrombocytopenic D (0.6% BSA solution) having a 124% increase; and lastly, Subgroup Thrombocytopenic B (0.2% BSA solution) having a 63% increase. This result shows that normal recovery from induced thrombocytopenia will have a higher percent increase in the number of platelets of mice induced with thrombocytopenia compared to those infused with BSA. Normal recovery from thrombocytopenia causes a rebound thrombocytosis – a condition where there is an abnormally high number of platelets in the body. A normal response to thrombocytopenia is an increase in megakarcyocyte size, number, and ploidy. Increased platelet production is then achieved initially by increasing ploidy and with time by increasing megakaryocyte number. Megakaryocytes shed their cytoplasm earlier than normal, resulting in the production of larger platelets. During rebound thrombocytosis, the elevated megakaryocyte mass serves as a ―sink‖, which results in the accumulation
and reduction in the levels of circulating thrombopoietin, to achieve homeostasis in the body.
CHAPTER 5
SUMMARY, CONCLUSIONS, AND RECOMMENDATION
This study determined the percent increase in the number of platelets of Mus musculus (white mice) induced with thrombocytopenia after the intravenous infusions of bovine serum albumin (BSA) solution of varying concentrations (0.2%, 0.4%, and 0.6%).
Specifically, it determined the number of platelets and compared the percent increase in the number of platelets of thrombocytopenic white mice before and after the BSA infusions. It also determined and compared the significant differences in the number of platelets of thrombocytopenic white mice before and after the BSA infusions.
It was hypothesized that there will be a significant difference in the number of platelets of thrombocytopenic white mice and will increase in number after the BSA infusions.
SUMMARY
The findings of this study are summarized as follows:
1. The researchers were able to determine the number of platelets of thrombocytopenic white mice before the BSA infusions, which gave a mean value of 90,500 platelets/μL, and after the BSA infusions, which gave a mean value of 238,187.5 platelets/μL.
3. The percent increase in