DOI: 10.12928/TELKOMNIKA.v15i1.4581 190
Streaming Audio Using MPEG
–
7 Audio Spectrum
Envelope to Enable Self-similarity within Polyphonic
Audio
Jonathan Doherty, Kevin Curran*, Paul McKevitt
School of Computing and Intelligent Systems, Faculty of Computing and Engineering, Ulster University, Derry, Northern Ireland, United Kingdom BT48 7JL
*Corresponding author, e-mail: [email protected]
Abstract
The ability of traditional packet level Forward Error Correction approaches can limit errors for small sporadic network losses but when dropouts of large portions occur listening quality becomes an issue. Services such as audio-on-demand drastically increase the loads on networks therefore new, robust and highly efficient coding algorithms are necessary. One method overlooked to date, which can work alongside existing audio compression schemes, is that which takes account of the semantics and natural repetition of music through meta-data tagging. Similarity detection within polyphonic audio has presented problematic challenges within the field of Music Information Retrieval. We present a system which works at the content level thus rendering it applicable in existing streaming services. Using the MPEG–7 Audio Spectrum Envelope (ASE) gives features for extraction and combined with k-means clustering enables self-similarity to be performed within polyphonic audio.
Keywords: MPEG–7, Music Information Retrieval (MIR), packet loss, wireless networks, multimedia streaming
Copyright © 2017 Universitas Ahmad Dahlan. All rights reserved.
1. Introduction
accuracy, whereas systems for music recognition only claim a 60-70% accuracy rating depending on the audio format, although new research is producing results of up to 90% when using the MIDI format [6].
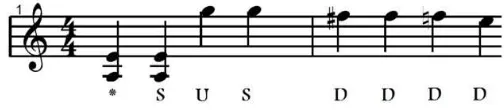
MELody inDEX[7] is a ‟Query-by-Humming‟ application similar to systems which allows a user to use a microphone to enter notes by humming a tune and then searches in a database for a similar match. To match user input with content held in the database, MELDEX primarily uses pitch and the fundamental frequency to process the signal for similarity matching. MELDEX filters the input to remove as many harmonics as possible, while preserving the fundamental frequency. The beginnings and ends of notes are defined using a technique primarily found in voice recognition, notes are dependent on the user using 'ta' or 'da' to hum the input, this causes a drop in amplitude of the waveform of 60ms at each utterance allowing each note to be more easily identified. MELDEX then uses ‟string-matching‟ to identify the input from the user with audio held in a database using approximation to score the results which are returned in order of accuracy. Similarly, the Melody Hound melody recognition system [8]. It was originally known as „Tuneserver‟ and hosted by the University of Karlsruhe. It was designed initially for Query by Whistling, i.e. it will return the song in the database that most closely matches a whistled query. A more unusual method of input is where the user can enter information about a song in the form of Parson‟s code. Each pair of consecutive notes is coded as “U” (“up”) if the second note is higher than the first note, “R” (“repeat”) if the pitches are equal, and “D” (“down”) otherwise. The first note of any tune is the reference point so it does not show up explicitly in the Parsons code and is entered as an asterisk (*) [9] showed that this simple encoding of tunes, which ignores most of the information in the musical signal, can still provide enough information for distinguishing between a large number of tunes. Figure 1 shows the first line of a “12 Bar Blues” music score with the resultant Parson‟s Code.
Figure 1. Parson‟s Code Representation of a Music Score
Humdrum is a general-purpose software system intended to assist music [10]. The syntax provides a common framework for representing information in ASCII format. Within the syntax an endless number of representation schemes can be ‟user defined‟. The Humdrum Toolkit provides a set of more than 70 inter-related software tools.
Themefinder [11] identifies common themes in Western classical music, Folksongs, and Latin Motifs of the sixteenth century. Themefinder provides a web-based interface of the Humdrum toolkit which indexes musical data for searching [10]. This in turn allows searching of databases containing musical themes. Currently, the most commonly used Humdrum representation is **kern. Kern is a core pitch/duration representation.
C-BRAHMS (Content-Based Retrieval and Analysis of Harmony and other Music Structures) [12] concentrates on retrieving polyphonic music from large scale music databases containing symbolically encoded music. C-Brahms uses a number of different algorithms that allow music to be in various formats, including MIDI, monophonic and polyphonic. It also allows partial and exact matching approaches. C-Brahms uses a geometric representation of both the query pattern and the source pattern allowing a Euclidean measurement of difference.
resultant data is then combined to describe the pitch and duration of the query allowing normal transcription to the MIDI format for comparison with songs stored in the database.
Notify! Whistle is a query by whistling/humming system for melody retrieval similar to CubyHum along with a similar conversion of user queries to a MIDI format. By using a piano roll representation of the query the user is allowed to change the original input to account for errors [15]. However, unlike CubyHum which uses a string-based approach for comparisons, [15] uses an index-based approach for pattern matching. By describing songs as notes within documents represented by the form Di N and queries as Q N allows queries to be performed using set theory and is an alternative approach to the problem of incorrect notes and mismatches that are common with user generated input queries.
Muscle Fish’s content-based retrieval CBR technology searches for audio files on the basis of how they sound [16, 17]. It can also be used to classify sound files or live sound inputs. An additional feature of Muscle Fish is its ability to cluster sound files according to category and search for sounds that are similar in their features. Muscle Fish‟s approach is to analyze sound files for a specific set of psychoacoustic features. This results in a query vector of attributes that include loudness, pitch, bandwidth and harmonicity. A covariance-weighted Euclidean (Mahalonobis) distance is then used as a measure of similarity between a given sound example and all other sound examples. Sounds are then ranked by distance with the closer ones being more similar.
2. Visualizing Structure and Repetition in Music
Pre-processing a song and storing the results for future on-the-spot repair is a-run-once-and-use-many-times approach to improving a listener's experience when less than optimum conditions occur. Linear Predictive Coding and Linear Interpolation have been a popular choice for attempting Forward Error Correction (FEC), but limitations on signal analysis can give a poor overall listening experience. The use of MPEG–7 as an initial representation of an audio signal greatly reduces the preprocessing required whilst retaining as much of the relevant information as possible. Many applications use MPEG–7 as a metadata description tool to form a database of standardised audio signal content with emphasis on the low-level physical content primarily to supplement the metadata already stored. By combining the MPEG–7 metadata with the MP3 metadata can widen the search criteria for current and future applications. This content can facilitate general search queries but can also be useful as a data reduction method for similarity analysis.
Figure 2. Example Audio Spectrum Envelope Differences
Table 1. ASE Sample Differences
Frequency Band Note A Note B Difference 1 (Lo-edge) 0.00113820000 0.00160140000 -0.0004632000 2 0.00667040000 0.00878590000 -0.0021155000 3 0.16378000000 0.15145000000 0.0123300000 4 0.03144300000 0.02257200000 0.0088710000 5 0.02642900000 0.03337200000 -0.0069430000 6 0.00675590000 0.00690820000 -0.0001523000 7 0.00550100000 0.00542540000 0.0000756000 8 0.00080775000 0.00073329000 0.0000744600 9 0.00005295100 0.00004947100 0.0000034800 10 (High-Edge) 0.00000039929 0.00000013699 0.0000002623
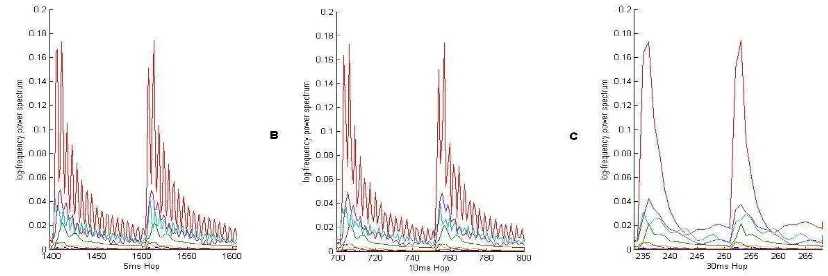
Figure 3. Example MPEG–7 Audio Spectrum Envelope 5 ms, 10 ms and 30 ms
has been greatly reduced which can be seen in Figure 4. Looking at Figure 4(a) clear reverberations of a note and between the two separate notes can be seen. Even with a 10 ms. hopsize the reverberations can be clearly seen in Figure 4(b). However, using a sample rate of 30 ms. hops the loss of information is sufficient to give a rough outline of a single note and nothing more. This shows how the number of samples can have a direct effect on the amount of information lost. As noted before, it is important not to reduce the dataset to a point that insufficient information remains to enable a meaningful classification.
To further illustrate the hopsize dimensionality reduction effects, Figure 5 shows the ASE representation of a song segment with duration of 1/10th of a second long. Since this audio contains vocals and more than one instrument it is clearly not going to have the almost sinusoidal repeating pattern shown in Figure 4. But what can be seen is the difference in representation between 5ms, 10ms and 30ms. Figure 5(a) and (b) have some minor differences in values but when compared to Figure 5(c) it becomes clear that so much ‟information‟ is lost that it makes it almost unrecognizable when compared to either Figure 5(a) or (b).
Figure 4. Example MPEG–7 ASE Closeup at 5ms, 10 ms, and 30 ms
Figure 5. MPEG–7 ASE Closeup of a Song at 5ms, 10ms and 30ms
frequency can be extracted/determined. In addition, the more convoluted the audio is, the more difficult it becomes to obtain usable results.
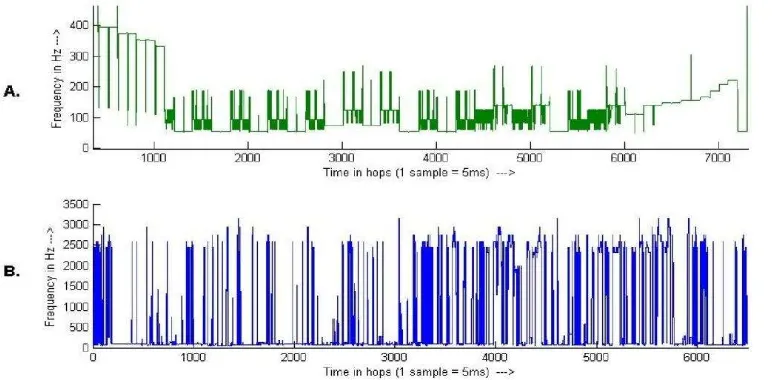
Figure 6 shows the fundamental frequencies of two different pieces of music as defined by the MPEG–7 standard. Figure 6(a) is the analysis of the 12 Bar Blues used throughout this work, and Figure 6(b) is a similar length of music but from a song in Western Tonal Format (WTF), with at least two repeating sections containing multiple instruments and vocals. Whereas the repeating pattern of the 12 Bar Blues can be seen clearly in Figure 6(a) the repetition is lost when multiple instruments and vocals are added as shown in Figure 6(b). The contrast between drums, guitars and vocals can change the fundamental frequency estimation dramatically.
Figure 6. Example MPEG–7 Fundamental Frequency of Two Audio Signals
Having polyphonic audio in a clustered format allows the identification of large sections of audio to be performed with various string matching techniques. We previously outlined various methods of measuring the differences/distance between two fixed length strings which are again dependent on the nature of the data. Although the clusters presented earlier are identified by digits there is no actual numerical association other than as an identifier hence the clusters are presented in a nominal scale. For example, consider the sequence of numbers 1, 2, 3. It can be said that 3 is higher than 2 and 1, while 2 is higher than 1. However, during the clustering process when two similar samples are found they could be as easily identified by using characters or symbols provided a nominal scale is used. By comparing a string of clusters using the hamming scale any metric value is ignored and only the number of differences between the two strings is calculated. However, if a ranking system is applied then ordinal variables can be transformed into quantitative variables through normalization. To determine distance between two objects represented by ordinal variables, it needs to transform the ordinal scale into ratio scale. This allows the distance to be calculated by treating the ordinal value as quantitative variables and using Euclidean distance, city block distance, Chebyshev distance, Minkowski distance or the coefficient correlation as distance metrics. Without rank the most effective measure is the hamming distance
3. Song Form Intelligence (SoFI) Audio Repair Framework
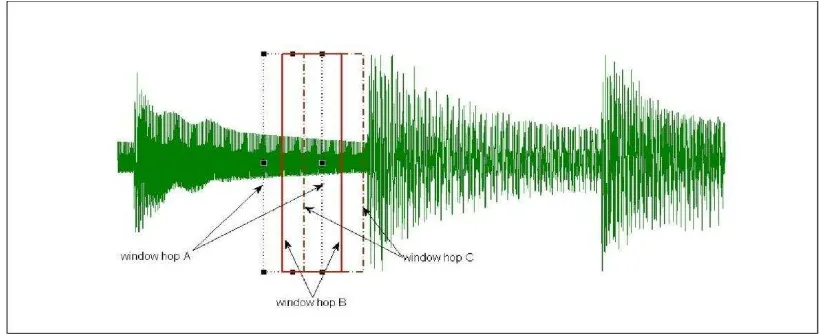
recommend these settings to be used as default values. Within the low and high frequencies a resolution of 1 is set for the parameter octaveResolution. This gives a full octave resolution of overlapping frequency bands which are logarithmically spaced from the low to high frequency threshold settings. The output of the logarithmic frequency range is the weighted sum of the power spectrum in each logarithmic sub-band. The spectrum according to a logarithmic frequency scale consists of one coefficient representing power between 0 Hz. and low edge, a series of coefficients representing power in logarithmically spaced bands between low edge and high edge, and a coefficient representing power above high edge resulting in 10 samples for each hop of the audio. The ASE features have been derived using a hopsize of 10 ms and a frame size of 30 ms this enables overlapping of the audio signal samples to give a more even representation of the audio as it changes from frame to frame as is shown in Figure 7. In general, more overlap will give more analysis points and therefore smoother results across time, but the computational expense is proportionately greater. SoFI generates the ASE descriptions in offline mode in a run once operation for each audio file stored. Audio files are in wav format to ensure that audio is of the best possible quality. Lossy compression codecs such as mp3 or ogg can introduce unnecessary variations in the compressed audio that did not exist in the original, even at a high bitrate level.
Figure 7. Overlapping Sampling Frames of a Waveform
3.1. Streaming Media Framework
network failure from the listener. When a dropout occurs the ir pipeline is paused and playback is initiated from the locally stored file. Whilst the Internet radio broadcast is being played the record pipeline receives the same broadcast and stores it locally on the machine as a local buffer for future playback. Only one song is stored at any given time, each time a new song is played, an end-of-stream message is sent to the client application and the last song received is over-written by the new song. When the state of a pipeline is changed any source/sink pads contained within the pipeline is changed. Upon invocation of the media application the media pipeline is set to playing by default. This sets the containing pipelines to playing where possible. However, the file pipeline remains in a ready state as no file has been specified for playing. This allows the other two pipelines to run concurrently.
3.2. SoFI’s Internal Synchronization Clock
Within gStreamer is the GstClock() which is used to maintain synchronization within pipelines during playback. gStreamer uses a global clock to monitor and synchronize the pads in each pipeline. The clock time is always measured in nanoseconds and always increases. GstClock() exists because it ensures media playback at a specific rate, and this rate is not necessarily the same as the system clock rate. Whenever a component of the pipeline requires the current clock time, it will be requested from the clock through a call to gst clock get time(). The pipeline that contains all others contains the global clock that all elements in the pipeline use as a base time, which is the clock time at the point where media playback is starting from zero. SoFI‟s media application, through using its own internal clock, can synchronise swapping between the audio stream and the file stored locally. When a network error occurs the current time-point of the internal clock is used as a reference point when accessing the best match data file. Initial tests demonstrated a jitter effect when swapping from one source to the other. Whilst reading the file to find the best possible time to seek to the radio stream continues playing. This means that when swapping to the previous section on the local audio file the first 0.5 s. of audio is not synchronised with the current time-point of the audio stream as shown in Figure 8. A partial fix for this involved reading the entire contents of the similarity file into a dynamically created array at the beginning of the audio song being streamed.
Figure 8. Example Time Delay Effect during Source Swapping
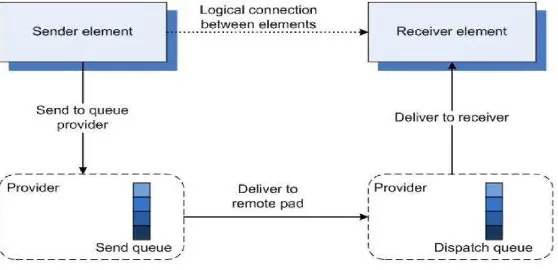
This enables the time-point to act as a reference pointer in the array, fData. Access to memory gives quicker responses than file I/O and a much quicker return time of the value held in the similarity file and thereby reducing jitter to a minimum. At the point of failure the time-point is used as a reference to be read from the similarity file. Since each comparison in this file is in 10 ms. hops the current time-point needs to be converted from nanoseconds to centiseconds: for example, 105441634000 nanoseconds convert to 10544 centiseconds or 105 s. Since the principle of swapping audio sources in real-time without user intervention, whilst maintaining the flow of audio, is a novel approach within the area of media players, SoFI creates unique adaptations to the flow of control between pipelines. This is achieved through the use of a queue element which is the thread boundary element through which the application can force the use of threads. It does so with a classic provider/receiver model as shown in Figure 9. The queue element acts both as a means to make data through-put between threads threadsafe, and it also acts as a buffer between elements. Queues have several GObject properties to be configured for specific uses. For example, the lower and upper threshold level of data to be held by the element can be set. If there is less data than set in the lower threshold it will block output to the following element and if there is more data than set in the upper threshold it will block input or drop data from the preceding element. It is through this element that the message bus receives the buffer underrun when incoming network traffic reaches a critically low state.
It is important to note that data flow from the source pad of the element before the queue and the sink pad of the element after the queue is synchronous. As data is passed returning messages can be sent: for example, when a buffer full notification is sent back through the queue to notify the file source sink to pause the data flow. Within pipelines, scheduling is either push-based or pull-based depending on which mode is supported by the particular element. If elements support random access to data, such as the gnomevfssink Internet radio source element, then elements downstream in the pipeline become the entry point of this group, i.e., the element controlling the scheduling of other elements. In the case of the queue element the entry point pulls data from the upstream gnomevfssink and pushes data downstream to the codecs. A buffer full message is then passed upstream from the codecs to the gnomevfssink, thereby calling data handling functions on either source or sink pads within the element.
4. Evaluation
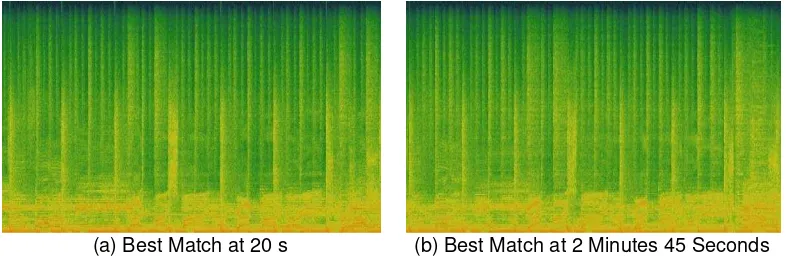
We now provide results of the best-effort approach that SoFI uses to identify similar segments. Using the ASE representation as a meaningful true representation and an audio analysis tool called Sonic Visualiser to present the same or similar sections of the actual audio in the form of a spectrogram, identified best-effort matches can be more easily displayed. Earlier, we discussed the optimum replacement for specific time points within an audio broadcast. Using Sonic Visualiser these identified sections can be visually represented not as a match ratio but as a spectrogram representation. Figure 10 shows the standard spectrogram representation which is a general overview of the file where background noise and equalisation trends may be visually evident but musical features contained within the signal are less apparent. It shows a spectral representation of similarly identified sections.
(a) Best Match at 20 s (b) Best Match at 2 Minutes 45 Seconds
The peak frequency spectrogram presents the precise/dominant frequency of a bin. Within each frequency bin, a single value representing each bin is displayed as a short horizontal line as opposed to the whole block/bin. This allows the strongest details to be seen without interference from neighbouring frequencies. Colours are representative of the power of the particular frequency ranging from black through to red.
Figure 11 shows the three similar sections identified in Figure 10 (a) and (b) as a peak frequency representation. From this layout the similarities between the different sections can be seen more clearly.
(a) Best Match at 20 s (b) Best match at 2 minutes 45 seconds
Figure 11. Peak Frequency Spectrum Representation of Two Similar Audio Sections
The most evident repetition among the range of frequencies can be seen at the lower end of the scale where strong base tones are more applicable. Base drums and male vocals can be more dominant within this range. More evident at this level is the repetition of the frequencies over the fixed temporal length of the sample. Close similarities between duration and power can be seen across Figure 11(a) and (b).
4.1. Correlation of Similar and Dissimilar Matches
Computing the 2D correlation coefficient between two similarly defined matrices produces a value of a high correlation and a low mean difference as shown in Table 2 with matrices a and b. These results can be compared to a segment of audio from a dissimilar match that produces a low correlation and a proportionately higher mean difference as shown in the comparison of matrices a and c. It is noted here that correlation measures the strength of a linear relationship between the two variables and this linear relationship can be false. A correlation coefficient of zero does not mean the two variables are independent but that there is no linear relationship between them. However, when combined with the mean differences between the vectors and their visual representations the accuracy between matches can be clearly defined.
Table 2. A Comparison of Correlation and Mean Difference between 3 different Audio Segments Matrices
Compared Correlation Mean difference
a T b 0.7204 0.000066657 a T c 0.2491 0.000785420
matches of values as high as 0.9 may be used during the first rendition of a verse or chorus and will produce audio quality that can only be described as subjective at best. The following section evaluates SoFI‟s performance based on subjective feedback on the quality of audio perceived by a listener.
4.2. Subjective Evaluation of SoFI
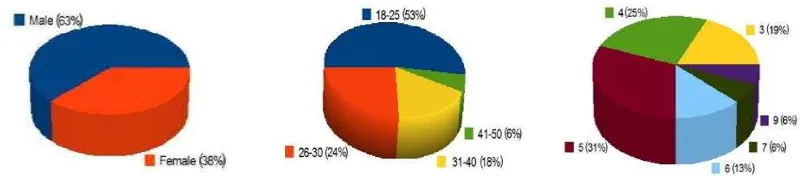
Quantitative evaluations discussed in the previous section demonstrate how accurate replacements can be when comparing errors. However, not every dropout occurrence can be accurately repaired, and comparisons to other approaches need to be performed to determine whether an acceptable level of repair is performed based on multiple scenarios. The following sections discuss the subjective evaluations performed on SoFI using feedback from listeners who were presented a series of test audio files and asked to complete a questionnaire evaluating each type of repair. Sixteen subjects were invited to participate in this experiment. Figure 12 shows the general age, gender and the time spent listening to music per week in the form of pie charts. Over 50% of the test subjects were in the age group of 18 to 25 with over 60% being male. The subjects were asked to rate their musical knowledge on a scale of one to ten in order to gain an understanding of their auditory perception skills. A keen musician would be able to discern any irregular changes in a piece of music better than a novice listener. The pie chart in Figure 12(c) shows that almost 70% consider themselves as average by scoring their abilities between 4, 5 and 6. Only two subjects (13%) considered themselves as above average with a listening skill of 7 and 9. None of the subjects considered themselves at a skill level for writing music.
Figure 12. Demographic Data for 16 Subjects that Participated in the Evaluation of SoFI
Shown in Figure 13 are subject‟s general background listening habits and their experiences of listening to music online. Over 80% use both wired and wireless network connections for Internet access and, of those over 50% use wireless more than wired. This shows a correlation between Figure 13(a) and Figure 13(c) where it can be seen that over 80% have experienced dropouts whilst listening to a music broadcast. One statistic not displayed is the number of listeners that have hearing problems. This question was included as a precautionary measure to ensure that the subjects would not be hindered in their evaluation by low sound quality. Only one subject answered ‟yes‟ to this but she presented no symptoms that would hinder the evaluation.
(a) (b) (c)
Using a ten point Likert scale, test subjects were given eight audio files to listen to in succession and asked to rate the repair in a questionnaire form. Since the tests were to be the same for each listener the audio repair in each song was simulated and stored locally as a wave file. Using sample time-points that have been identified as similar within the collection of songs, specific experiments were executed at predetermined time-points. The point of failure for each song was decided by the particular test, i.e. a verse failure, at the beginning of the song and even the duration of the dropout. The audio files were then reconstructed based on the identified segments using a wave editor to ensure precise matching of time-points. This removed any possible ambiguity introduced by re-running the audio broadcasts multiple times with varying network characteristics. Each song was evaluated when it had completed and before the next began. Once all songs had been played at least once a general rank for all the songs was requested from each test subject. This rank was based on an order of preference of one to eight with one being the most favored method of repair and eight the least favored.
5. Conclusion
We have discussed the problems and solutions for repairing dropouts whilst streaming audio across wireless bursty networks. Previous research in the field of Music Information Retrieval is presented, this includes query-by-humming, melody recognition, recommender systems, and music representation in textural format, music indexing systems for similar music queries, content based retrieval approaches, along with associated tools. We also investigated the syntax and semantics of music as meaningful textural representations of music content. Frequency and pitch detection were reviewed along with beat detection to aid in characterizing the rhythm and tempo of music and audio. The problems associated with jitter and streaming media were reviewed alongside systems that attempt repair at a network level. Having examined the associated problems and previous work on identifying music similarity and audio repair of time dependent audio broadcasts, we designed a framework that utilises self-similarity identification for automatic re-pair of bursty dropouts in streamed audio. Feature extraction of audio utilising MPEG–7 low level descriptors was presented as a method of data reduction that allows for pertinent data to be retained whilst minimising the overall volume of data to be analysed. A framework for feature extraction and similarity detection together with distance measures of successful self-similarity detection presents a unique approach to the area of receiver based audio repair when dropouts of time dependent audio are received. Based on this framework SoFI (Song Form Intelligence), an intelligent media streaming/receiving system that utilises self-similarity to repair bursty errors when receiving time dependent audio broadcasts was implemented. Utilising the MPEG–7 audio spectrum envelope features, k-means clustering and categorical measurement of distance segmentation and classification of audio in Western Tonal Format was performed. Using the resultant output of the similarity identification processes on the client side enabled SoFI to identify network dropouts and use previously received sections of audio stored locally for best-effort replacement.
References
[1] Doraisamy S, Ruger S. A Polyphonic Music Retrieval System Using N-Grams. Proceedings of the International Conference on Music Information Retrieval. 2004: 204-209.
[2] Eerola T, Toiviainen P. MIR in Matlab: The MIDI Toolbox. Proceedings of the International Conference on Music Information Retrieval. 2004: 22-27.
[3] Meredith D, Wiggins G, Lemstrom K. Pattern Induction and Matching in Poly-phonic Music and Other Multidimensional Datasets. Proceedings of the 5th World Multiconference on Systemics, Cybernetics and Informatics (SCI2001). 2001: 22-25.
[4] Foote J, Cooper M. Media Segmentation Using Self-Similarity Decomposition. Proceedings of SPIE. 2003; 5021:167–175
[5] Bartsch M, Wakefield G. To Catch a Chorus: Using Chroma-based Representations for Audio Thumbnailing. Applications of Signal Processing to Audio and Acoustics, 2001 IEEE Workshop on 2001: 15-18.
[6] Bryan N, Mysore G. Interactive User-Feedback for Sound Source Separation. International Conference on Intelligent User-Interfaces (IUI), Workshop on Interactive Machine Learning. Santa Monica. 2013.
[8] Prechelt L, Typke R. An Interface for Melody Input. ACM Transactions on Computer-Human Interaction (TOCHI). 2001; 8(2): 133-149.
[9] Parsons D. Directory of Tunes and Musical Themes. S. Brown. 1975. [10] Humdrum. The Humdrum Toolkit: Software for Music Research. 2008. [11] Sapp HDC, Aarden B. Themefinder. 2008.
[12] Lemstrom K, Makinen V, Pienimaki A, Turkia M, Ukkonen E. The C-BRAHMS Project. In Proceedings of the 4th Internationoal Conference on Music Information Retrieval (ISMIR). 2003: 237-238.
[13] Pauws S. Cubyhum: A fully operational query by humming system. In ISMIR 2002 Conference Proceedings. 2002: 187-196.
[14] Hermes D. Measurement of pitch by subharmonic summation. The Journal of the Acoustical Society of America. 1988; 83: 257.
[15] Kurth F, Ribbrock A, Clausen M. Efficient Fault Tolerant Search Techniques for Full-Text Audio Retrieval. Preprints-Audio Engineering Society. 2002.
[16] Wold E, Blum T, Keislar D, Wheaten J. Content-based classification, search, and retrieval of audio.
Multimedia, IEEE. 1996; 3(3): 27-36.
[17] Wold E, Blum T, Keislar D, Wheaton J. Classification, search, and retrieval of audio. Handbook of Multimedia Computing. 1999: 207-226.
[18] Pan D, Inc M, Schaumburg I. A tutorial on MPEG/audio compression. Multimedia, IEEE. 1995; 2(2): 60-74.