High glucose, but not testosterone, increases platelet
aggregation mediated by endothelial cells
Ikhlas Muhammad Jenie*, Budi Mulyono**, Soedjono Aswin***, Sri Kadarsih Soejono****
*
Department of Physiology, Faculty of Medicine and Health Sciences,University Muhammadiyah Yogyakarta **
Department of Clinical Pathology, Faculty of Medicine, Gadjah Mada University
***Department of Anatomy and Embriology Department, Faculty of Medicine, Gadjah Mada University ****
Department of Physiology, Faculty of Medicine, Gadjah Mada University
Article Info ABSTRACT such as prostacyclin and nitric oxide. Male subject is a traditional risk factor for cardiovascular diseases. Platelet hyperreactivity has been frequently found in patient with diabetes mellitus. To examine whether testosterone and high glucose modify platelet aggregation through endothelial cells, we did an in vitro study using endothelial cells culture from human umbilical vein (HUVEC). Treatments were performed in HUVEC sub culture as either normoglucose (5.6 mM) or high glucose (22.4 mM) medium, with or without testosterone (0, 1, 10, 100 nM), for 24 hours. HUVEC were trypsinized, resuspended, and then incubated with platelet rich plasma from healthy male donors with ratio 1:104 for 3 minutes. Platelet aggregation measured by turbidimetry methode. This study showed that testosterone did not significantly influence platelet aggregation through endothelial cells in normoglucose (p = 0.144) or high glucose (p = 0.916) medium. There was no main effect of testosterone (p = 0.73) as well as no interaction between testosterone and glucose (p = 0.69), but there was a main effect of glucose (p = 0.004), to platelet aggregation through endothelial cells. In conclusion, high glucose, but not testosterone, increases platelet aggregation mediated by endothelial cells.
Copyright © 2015 Institute of Advanced Engineering and Science. All rights reserved. blood vessels. In normal physiological condition, EC, being exposed to blood glucose levels in range 3.6-5.8 mmol/L, is characterized as antithrombotic and anticoagulant. However, when EC are being exposed to hyperglycemia, as the hallmark of diabetes mellitus (DM), cell homeostasis is perturbed and EC may change to be prothrombotic and procoagulant. Endothelial dysfunction is believed to occur before the development of microvascular and macrovascular complications in type 2 diabetes mellitus (T2DM) patients. The underlying mechanism includes the accelerated formation of advanced glycation end product and activation of protein kinase C [1-2].
this area are still conflicting. For example, as the level of serum T is rather low in patients with CVD, as well as in aging men, T replacement offers a potential benefit but abrupt uprising of T level, such as experienced by athletes who take androgen, is associated with CV events [5-7].
In CV events, platelet aggregation can be regarded as the early event that will lead to thrombosis formation [8]. Fortunately, EC will response to platelet activation by releasing thromboregulators, such as prostacyclin and nitric oxide [9]. Thus, it is very interesting to examine whether the capacity of EC was changed after exposure of T in normoglucose (NG) or high glucose (HG) environment.
2. RESEARCH METHOD
The study was approved by the Institutional Review Board of the Faculty of Medicine Gadjah Mada University (FM GMU), Yogyakarta. Donors for umbilical cords (n = 2) were mothers who delivered her baby in a midwifery clinic or Muhammadiyah’s hospitals in Yogyakarta. The mothers had no hypertension, diabetes mellitus, and (pre) ecclampsia, the delivery was aterm, and the baby was having Apgar score >10. Donors for platelets (n = 2) were healthy male subjects from FM GMU, who were 30-40 years old, had body mass index <28 kg2/m2, platelets count >100.000/mm3, O blood type, normal platelet aggregation, and with no DM, hypertension, and history of blood disorders. All participants were capable of giving informed consent.
2.1. Endothelial cells culture
Medium 199 (M199) was using as culture medium that was prepared from the powdered M199 (Gibco) added with 2 g of sodium bicarbonate and 2 g of HEPES sodium salts. Growth medium was M199 supplemented with 10% fetal bovine serum (FBS) (Caisson), 100 IU/mL of penicillin and 100 µg/mL of streptomycin (Sigma), 0.5% fungizone (Gibco), and 2 mM of L-glutamine (Sigma).
The umbilical cord buffer was prepared from 9.6 g of Dulbecco’s phosphate buffered saline (PBS) powder that dissolved with distilled water into 1000 mL in total volume. The solution was put into glass bottles and sterilized with autoclave at 1210C, for 15 minutes. After sterilizing, add 100 IU/mL of penicillin and 100 µg/mL of streptomycin, that obtained from crystalline procaine penicillin-G powder (Meiji) and streptomycin sulfate powder (Meiji) dissolved with sterilized water for injection. This buffer solution was kept at 40C.
Human umbilical vein endothelial cells (HUVEC) culture was established according to the technique describes by Jaffe et al. [10], Tanaka (School of Medicine, Kobe University) [11], and Baudin et al. [12] The umbilical cord taken from donors was placed in sterile bottle contained buffer solution (PBS-1% Pen Strep) at 40C until processed in the laboratory within 24 hours of collection. After the outside of the umbilical cord was cleaned with povidone iodine, the lumen of umbilical vein was identified. Cannula needle was inserted into the vein and kept tightly with a clamp. Then the umbilical vein was flushed with ringer lactate solution until it was free from remaining blood. The next step was filling the umbilical vein with enzyme solution to disaggregate EC. For that, warm 0.25% trypsin-EDTA (Gibco) was injected into the vein until it was distended. Another open end of the cord was clamped. The umbilical cord was incubated for 2 minutes into a beaker glass filled with warm PBS. After incubation period, the clamp was taken off and the enzyme solution was collected into a sterile bottle already filled with 1 cc of FBS. The effluent was replaced into a conical tube to be centrifuged at 2000 rpm for 10 minutes. The supernatant was removed and the pellet was washed once with M199. Then the cell was resuspended with growth medium and inoculated on a gelatine-coated 60 mm-diameter tissue culture dish (Iwaki). The dish was incubated at 370C and 5% CO2 for 24 hours. On the following day, the growth medium was changed after the dish was washed with PBS-1% Pen Strep to remove red blood cells. The growth medium was changed every 2 days until it reached 80% confluence. The cells were observed under an inverted microscope (Eclipse, Nikon, Japan).
2.1.1. Immunocytochemistry for phenotypic expression
HUVEC passage 2 were growth on gelatin-coated coverslip after reaching confluence were characterized by the presence of von-Willebrand factor (vWF) [13-14]. Immunocytochemistry was done for cell characterization. Monolayer HUVEC on gelatin-coated coverslip was fixed with methanol. Anti-vWF rabbit polyclonal antibody (1:50; Novocastra, Newcastle, UK) was used as the primary antibody for 1 h at RT, followed by trekie universal link (Starr Trek, Biocare Medical, Netherlands) as the secondary antibody for 20 minutes at RT. The coverslips were incubated with TrekAvidin horse raddish peroxidase (HRP) label (Starr Trek) for 10 minutes, and followed by betazoid 3-3’ diaminobenzidin (DAB) chromogen (1:50; Starr Trek) for 2 minutes. The coverslip was counterstained with Mayer’s hematoxylin (Merck, Darmstadt, Germany) for 2 minutes, and then underwent dehydration series using ethanol and xylol. The coverslip was finally mounted on a microscope glass using xylene-based mounting medium (EZ-Mount, Shandon, Thermo Scientific, USA). The cells were examined under an optic microscope (Olympus, Japan).
Venous blood was collected into 1/10 volume of 3.8% sodium citrate from the donors. The whole blood was centrifuged at 900 rpm for 15 minutes. The supernatant i.e. platelet rich plasma (PRP) was collected. The remaining blood was centrifuged at 1500 rpm for another 15 minutes to get platelet poor plasma (PPP). The PRP and PPP were kept at room temperature until platelet aggregation test was performed within 3 hours.
2.3. Treatment
Primary HUVEC reached 80% confluenceon the 6-9th day. The HUVEC monolayer was trypsinized with 0.25% trypsin-EDTA and counted. The EC were plated in a gelatin-coated 24-well microplate (Iwaki) at 2x10⁴cells/well. After 24 hours the growth medium of the secondary HUVEC was replaced with either NG (5.6 nM) or HG M199 growth medium (22.4nM) without or with T at 0, 1, 10, or 100 nM. For the next 24 hours, the treatment was removed and the monolayer EC were washed with PBS, trypsinized with 0.25% trypsin-EDTA, centrifuged at 2000 rpm for 5 minutes, and resuspended with 500 µL of serum free M199. 2.4. Platelet aggregation test
Platelet aggregation test was done with turbidimetric methode using an aggregometer machine and adenosine diphosphate (ADP) as platelet agonist, both were from Helena Laboratory. 5 µM of ADP was prepared by diluting 20 µM of ADP with 0.9% of saline with ratio 1:3. Light transmittance measurement was taken to the following: an empty cuvette, a cuvette filled with 300 µL of aquadest, and a cuvette filled with 450 µL of PPP. Another 4 cuvettes were prepared with a magnetic strirrer inside. 50 µL of endothelial cell suspension was put into each cuvette, according to the designated treatment group. 50 µL of PRP was added into the cuvette to reach ratio 104:1 to the EC and incubated for 3 minutes at 370C. Finally, 50 µL of 5 µM ADP was added into the cuvette, and the reading of light transmittance for platelet aggregation was started. During 10 minutes-reading, variabels such as Max%, TMax, slope, lag and % area under curve were recorded. To examine the treatment effect, Max% or maximal platelet aggregation in percentage was used as the parameter.
2.5. Statistic analysis
One way ANOVA was used to analyse the influence of T at various doses in either NG or HG medium. Analysis of varians was used to analyse 2x4 factorial designs. p value <0.05 was considered significant.
3. RESULTS AND ANALYSIS
3.1. Endothelial cells culture
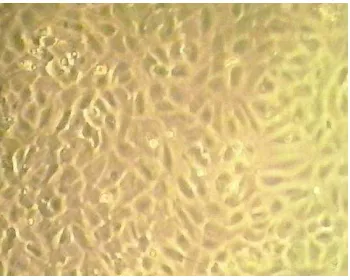
Primary EC culture was established from human umbilical vein (human umbilical vein endothelial cells; HUVEC) using enzymatic digestion. The endothelial cell culture reached confluence at 6-9th day. EC culture was identified by morphological and immunological approach. By morphological identification using a phase contrast microscope, EC were observed as mononucleate and polygonal epithelial cells. A confluent monolayer of EC showed cobblestone appearance as shown in Figure 1.
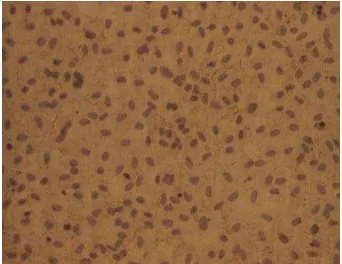
By immunological identification using immunocytochemistry method, the EC culture positively expressed von Willebrand factor (vWF) at the cell membrane (Figure 2).
Figure 2. The positive expression of von Willebrand factor (vWF) in endothelial cells. Endothelial cells from human umbilical vein (HUVEC) passage 2 were growth on a gelatin-coated coverslip. A confluent monolayer EC was fixed and immunolabelled with anti-vWF polyclonal antibody as described in the Research Method. The vWF expression was detected on the cell membrane (brown). Mayer’s hematoxylin was used to counterstain the nuclei (purple). Cells were observed under inverted microscope with 40x magnification.
3.2. Platelet aggregation test
By using luminisence turbidimetric method, maximal platelet aggregation was measured in PRP after incubated with EC previously treated with testosterone in NG or HG medium. The results are presented in Table 1.
Table 1. Maximal platelet aggregation mediated by endothelial cells treated with testosterone and glucose
Testosterone level in the EC culture medium (nM)
Percentage of maximal platelet aggregation mediated by endothelial cells from two different glucose content in the culture medium
Normoglucose High glucose
0 29.3 ± 5.8 46.5 ± 10.7
1 25.0 ± 6.8 43.9 ± 1.4
10 100
28.5 ± 7.0 29.1 ± 9.9
48.1 ± 0 37.4 ± 2.3
Note. Maximal platelet aggregation is presented as mean ± SD from 2 independent experiments. EC = endothelial cells. Normoglucose = 5.6 mM glucose in the EC culture medium. High glucose = 22.4 mM glucose in the EC culture medium.
As seen in the Table 1, percentage of maximal platelet aggregation of PRP after incubated with EC previously treated with NG medium was lower than of PRP after incubated with EC previously treated with HG medium, in each level of T in the culture medium. By one-way ANOVA analysis, exposure of T at various doses to EC did not show significant influences to maximal platelet aggregation in either NG (p = 0.144) or HG medium (p = 0.916). By analysis of varians for 2x4 factorial design, there was a main effect of glucose to EC to maximal platelet aggregation (p = 0.004). However, there was no main effect of T to EC to maximal platelet aggregation (p = 0.073). Moreover, there was no interaction between T and glucose to EC to maximal platelet aggregation (p = 0.69).
The aim of this study is to investigate the influence of T and HG condition to the normal function of EC in preventing platelet aggregation. This in vitro experiment is specific to examine the influence of T and HG to EC in relation to the early stage of thrombosis. However, this model is not compatible with real condition, in which hyperglycemia or T or the combination condition will affect EC and platelets at the same time.
with DHT, enhanced platelet reactivity. Thus, they concluded that the influence of T in increasing platelet aggregation was not a direct effect to platelets but indirectly through EC.
Actually, T does have a direct influence to platelets as had been investigated by Matsuda et al. [16] in rats. They reported that rats treated with T cypionate for 2 weeks had an increased in platelets thromboxane receptor density and platelet aggregation. Ajayi & Haluskha [17] found that thromboxane receptor density in platelets from prostate cancer patients underwent surgically and/or medically castration is was significantly lower than controls.
Campelo et al. [18] and Cutini et al. [19] offered another approach by incubating monolayer EC from rat aortic rings with PRP and T at various doses. After 1-minute incubation, PRP was removed from the plate and measured platelets aggregation by turbidimetric method using 5 µM of ADP as platelet agonist. They found that incubating PRP with monolayer EC decreased platelet aggregation as compared to PRP that was not exposed to EC. However, they showed that the presence of T depressed further platelet aggregation. What Campelo et al. [18] and Cutini et al. [19] had reported that T has anti-aggregatory action is contrary to what Rosenblum et al. [15], Matsuda et al. [16], and Ajayi and Haluskha [17] had proved that T has pro-aggregatory action. The difference is the result of the design of the experiment. Campelo et al. [16] and Cutini et al. [19] applied T to EC and platelet at the same time, whereas Rosenblum et al. [15], Matsuda et al. [16], and Ajayi and Haluskha [17] were more focus to the exposure of T to platelet. Indeed, Khetawat et al. [19] showed that androgen receptors were detected in platelet. Differed with those previous experiments, in this study T does neither increase nor decrease platelet aggregation through EC.
It has been established that diabetic environment promotes endothelial perturbation and dysfunction. HG condition in an in vitro study mimics hyperglycemia found in patients with DM [1]. There are numerous evidences for the role of EC as a break for platelet aggregation; however, only a few that reported the influence of HG condition to EC in relation to platelet activation. Cosentino et al. [21] had showed that the function of EC in preventing platelet aggregation is not optimal in HG medium because in this environment EC secrete prostanoid that functions as vasoconstrictor and pro platelet aggregation, i.e. thromboxane A2, much more than prostanoid that functions as vasodilator and antiplatelet aggregation, i.e. prostacyclin. It has been established also that T2DM patients have exaggerated platelet reactivity [22-23]. In agreement with literature, this study showed that HG environment increases platelet aggregation through EC.
Shin et al. [24] and Cheung et al. [25] reported that serum T level was inversely correlated with plasma glucose level, whereas Hernadez-Mijares et al. [26] found that low T level was common among T2DM patients. It has been suggested that low T level is one of the consequences of DM. This study showed that HG does not interact with T in influencing platelet aggregation through EC.
4. CONCLUSION
Testosterone does not increase platelet aggregation through endothelial cells, but high glucose does.
ACKNOWLEDGEMENTS
We would like to thank Directorate for Higher Education, Ministry of Education and Culture, Republic of Indonesia, for the Research Grant under “Hibah Desentralisasi Doktor 2014” Scheme.
REFERENCES
[1] Popov, D.; , “Endothelial cell dysfunction in hyperglycemia: Phenotypic change, intracellular signaling modification, ultrastructural alteration, and potential clinical outcomes,” Int J Diabetes Mellitus, vol.2, pp.189-95, 2010.
[2] Schaffer, A.; Bauersachs, J.; , “Endothelial dysfunction, impaired endogenous platelet inhibition and platelet activation in diabetes and atherosclerosis,” Curr Vasc Pharm, vol.6, pp.52-60, 2008.
[3] Kelly, D.M.; Jones, T.H.; , “Testosterone: a vascular hormone in health and disease,: J Endocrinol, vol.217, no.3; pp.R47-R71, 2013.
[4] Torres-Estay, V.; Carreno, D.V.;, Fransisco, I.F.S.; Sotomayor, P.; Godoy, A.S.; Smith, G.J.; , “Androgen receptor in human endothelial cells,” J Endocrinol, vol.224, pp.R131-R137, 2015.
[5] Liu, P.Y.; Death, A.K.; Handelsman, D.J.; , “Androgens and cardiovascular disease,” Endocrine Rev, vol.24, no.3, pp.313-340, 2003.
[6] Wu, F.C.W.; von Eckardstein, A.; , “Androgens and coronary artery disease,” Endocrin Rev, vol.24, pp.183-217, 2003.
[7] Jones, T.H.; Saad, F.; , “The effect of testosterone on risk factors for, and the mediators of, the atherosclerotic process,” Atherosclerosis, vol.207, pp.318-327, 2009.
[9] Buikema, J.H.; van Gilst, W.H.; , “Endothelial function”, In. Buikema, J.H.; , “Endothelial Dysfunction in Cardiovascular Disease: Role of Pharmacological Interventions,” Dissertation, Groningen: Rijksuniversiteit Groningen, 1995.
[10] Jaffe, E.A.; Nachman, R.L.; Becker, C.G.; Minick, C.H.; , “Culture of human endothelial cells derived from human umbilical veins,” J Clin Invest, vol.52, pp.2745-2756, 1973.
[11] Tanaka, A.; , “Primary culture of HUVEC,” A handout, School of Medicine, Kobe University, 1994.
[12] Baudin, B.; Bruneel, A.; Bosselut, N.; Vaubourdolle, M.; , “A protocol for isolation and culture of human umbilical vein endothelial cells,” Nat Protoc, vol.2, no.3, pp.481-485, 2007.
[13] Lip, G.Y.H.; Blann, A.; , “Von Willebrand factor: a marker of endothelial dysfunction in vascular disorders?,” Cardiovasc Res, vol.34, pp.255–265; 1997.
[14] Mannucci, P.M.; , “von Willebrand Factor: A Marker of Endothelial Damage?,” Arterioscler Thromb Vasc Biol, vol.18, pp.1359-1362; 1998.
[15] Rosenblum, W.I.; El-Sabban, F.; Nelson, G.H.; Allison, T.B.; , “Effects in mice of testosterone and dihydrotestosterone on platelet aggregation in injured arterioles and ex vivo,” Thromb Res, vol.45, pp.719-728, 1987.
[16] Matsuda, K.; Ruff, A.; Morinelli, T.A.; Mathur, R.S.; Mathur, R.S.; Halushka, P.V.; , “Testosterone increases thromboxane A2 receptor density and responsiveness in rat aortas and platelets,” Am J Physiol, vol.267, pp.H887-H893, 1994.
[17] Ajayi, A.A.L.; Halushka, P.V.; , “Castration reduces platelet thromboxane A2 receptor density and aggregability,” Q J Med, vol.98, pp.349-356, 2005.
[18] Campelo, A.E.; Cutini, P.H.; Massheimer, V.L.; , “Testosterone modulates platelet aggregation and endothelial cell growth through nitric oxide pathway,” J Endocrinol, vol.213, pp.77-87, 2012.
[19] Cutini, P.H.; Campelo, A.E.; Agrielo, E.; Sandoval, M.J.; Rauschemberger, M.B.; Massheimer, V.L.; , “The role of sex steroids on cellular events involved in vascular disease,” J Steroid Biochem Mol Biol, vol.132, no.3-5, pp.322-330, 2012.
[20] Khetawat, G.; Faraday, N.; Nealen, M.L.; Viajayan, K.V.; Bolton, E.; Noga, S.J.; Bray, P.F.; , “Human megakaryocytes and platelets contain the estrogen receptor beta and androgen receptor (AR): Testosterone
regulates AR expression,” Blood, vol.7, pp.2289-2296; 2000.
[21] Cosentino, F.; Eto, M.; De Paolis, P.; van der Loo, B.; Bachschimd, M.; Ullrich, V.; Kouroedov, A.; Gatti, C.D.; Joch, H.; Volpe, M.; Luscher, T.F.; , “High glucose causes upregulation of cyclooxygenase-2 and alters prostanoid profile in human endothelial cells: role of protein kinase C and reactive oxygen species,” Circulation, vol.107, pp.1017-1023, 2003.
[22] Vinik, A.I.; Erbas, T.; Park, T.S.; Nolan, R.; Pittenger, G.L.; , “Platelet dysfunction in type 2 diabetes,” Diabetes Care, vol.24, no.8, pp.1476-1485, 2001.
[23] Schneider, D.J.; , “Factors contributing to increased platelet reactivity in people with diabetes,” Diabetes Care, vol.32, no.4, pp.525-527, 2009.
[24] Shin, J.Y.; Park, E.K.; Park, B.J.; , “High-normal glucose levels in non-diabetic and pre-diabetic men are associated with decerased testosterone levels,” Korean J Fam Med, vol.33, pp.152-156, 2012.
[25] Cheung, K.K.T.; Luk, A.O.Y.; So, W.Y.; Ma, R.C.W.; Kong, A.P.S.; Chow, F.C.C.; Chan, J.C.N., “Testosterone level in men with type 2 diabetes mellitus and related metabolic effects: A review of current evidence,” J Diab Invest, vol.6, pp.112-123, 2015.