Primaquine decreased plasma concentration of ritonavir: single- and
repeated-dose study in Sprague Dawley rats
Melva Louisa, Vivian Soetikno, Nafrialdi, Rianto Setiabudy, Frans D. Suyatna
Department of Pharmacology and Therapeutics, Faculty of Medicine, Universitas Indonesia, Jakarta, Indonesia
Abstrak
Latar belakang: Penelitian ini dilakukan untuk meneliti pengaruh pemberian ritonavir dan primakuin bersamaan, yang
diberikan dalam dosis tunggal atau dosis berulang pada konsentrasi plasma ritonavir pada tikus.
Metode: Pada studi dengan pemberian dosis tunggal, 30 tikus Sprague Dawley jantan secara acak diberikan ritonavir 20
mg/kgBB atau ritonavir 20 mg/kgBB + primakuin 1,2 mg/kgBB atau ritonavir 20 mg/kgBB + ketokonazol 10 mg/kgBB. Ketokonazol digunakan sebagai kontrol positif penghambat metabolisme ritonavir. Pada studi dengan pemberian dosis berulang, 30 tikus Spraque Dawley secara acak diberikan ritonavir 20 mg/kgBB/hari atau ritonavir 20 mg/kgBB/hari + primaquine 1,2 mg/kgBB/hari atau ritonavir 20 mg/kgBB/hari + rifampisin 100 mg/kgBB/day. Rifampisin digunakan sebagai kontrol positif penginduksi metabolisme ritonavir.
Hasil: Pada pemberian dosis tunggal, ketokonazol meningkatkan area dibawah kurva kadar plasma (AUC) ritonavir
(↑114,8%, p< 0.05), sedangkan primakuin cenderung menurunkan AUC ritonavir (↓32,6%, p> 0.05). Pemberian dosis berulang menunjukkan bahwa rifampisin menurunkan AUC ritonavir (↓42,8%, p< 0.001), dan primakuin menurunkan AUC ritonavir (↓ 46,6%, p< 0.001).
Kesimpulan: Pemberian primakuin dan ritonavir bersamaan dapat menurunkan AUC ritonavir. Hal ini dapat menyebabkan
konsentrasi ritonavir sebagai anti-HIV tidak mencukupi, sehingga dapat menyebabkan kegagalan terapi dengan ritonavir.
(Med J Indones 2011; 20:190-4)
Abstract
Background: The present study was aimed to explore the effects of ritonavir and primaquine combination given as a single-dose or repeated-single-dose compared to ritonavir alone on ritonavir plasma concentration in the rats.
Methods: In single-dose study, 30 male Spraque Dawley rats were randomly allocated to receive ritonavir 20 mg/kg BW or ritonavir 20 mg/kg BW + primaquine 1.2 mg/kg BW or ritonavir 20 mg/kg BW + ketokonazole 10 mg/kg BW. Ketokonazole was used as positive control of ritonavir metabolism inhibitor. In the repeated-dose study, thirty Spraque Dawley male rats were randomly allocated to receive ritonavir 20 mg/kg BW/day or ritonavir 20 mg/kg BW/day + primaquine 1.2 mg/kg BW/ day or ritonavir 20 mg/kg BW/day + rifampicin 100 mg/kg BW/day. Rifampicin was used as a positive control of ritonavir metabolism inducer.
Results: In the single-dose study, ketokonazole increased the area under the plasma concentration (AUC) of ritonavir (↑ 114.8%, p< 0.05), while primaquine tended to decrease the AUC of ritonavir (↓ 32.6%, p> 0.05). Repeated-dose study showed that rifampicin decreases the AUC of ritonavir (↓ 42.8%, p< 0.001), and primaquine decreased the AUC of ritonavir plasma concentration (↓ 46.6%, p< 0.001).
Conclusion: Concomitant administration of primaquine and ritonavir decreases the AUC of ritonavir. This effect may result in the insuffi cient concentration of ritonavir as anti-HIV, which may lead to treatment failure with ritonavir. (Med J Indones 2011; 20:190-4)
Key words:drug interaction, metabolism, primaquine, ritonavir
Correspondence email to: [email protected]
Concomitant use of antimalaria and anti-HIV is a new challenge in the management of co-infection of malaria/ HIV. Drug interaction should be considered for treatment success. Anti-HIV regimen consists of 3 to 4 drugs. If an HIV patient has to take malaria treatments, then the patient receives two or three additional drugs.1,2
Interaction between antimalarial and antiretroviral drugs mostly involves anti-HIV drugs protease inhibitors (PIs) and non nucleotide reverse transcriptase inhibitors (NNRTIs). Protease inhibitors such as ritonavir are known to inhibit cytochrome P450 enzymes (CYPs), while NNRTIs may act as inhibitor or inducer of
CYP.1 CYPs are the main enzyme system in the liver responsible for drug metabolism of nearly 80% of currently known drugs.3
There are no data showing the exact metabolism pathway of primaquine in human. In an in vitro study, it was shown that primaquine was a substrate of cytochrome P450 3A4 (CYP3A4),7 while ritonavir is known as substrate and inhibitor of CYP3A4.8 Interaction study between primaquine and ritonavir has never been done before.1,9 We supposed that primaquine has an inhibiting or otherwise inducing properties on the metabolism of ritonavir. Inhibition of ritonavir metabolism by primaquine can cause an increase in serum drug concentration and risk of drug intoxication, while induction of ritonavir metabolism by primaquine can decrease serum drug concentration, and cause treatment failure and drug resistance.
The aim of the study was to test whether primaquine had an inhibiting or otherwise an inducing effect on the metabolism of ritonavir.
METHODS
The study protocol was approved by the Ethics Committee of the Faculty of Medicine, Universitas Indonesia. This study was conducted in the Department of Pharmacology and Therapeutics, Faculty of Medicine, Universitas Indonesia from November 2009 through April 2010.
Experimental design
The study consisted of two parts. The fi rst part was designed to investigate whether primaquine had an inhibitory effect on the metabolism of ritonavir, and was given concomitantly as a single dose. Ketokonazole was used as a positive control of ritonavir metabolism inhibitor. Thirty male Spraque Dawley rats weighing ± 300 g were randomly allocated into 3 groups of 10 rats
to receive either ritonavir 20 mg/kg BW, or ritonavir 20 mg/kg BW + primaquine 1.2 mg/kg BW, or ritonavir 20 mg/kg BW + ketokonazole 10 mg/kg BW, orally.
The second part was carried out to investigate whether primaquine had an inducing effect on the metabolism of ritonavir, and was given concomitantly in a repeated fashion for 5 days. Rifampicin was used as a positive control of ritonavir metabolism inducer. Thirty male Spraque Dawley rats weighing ± 300 g were randomly allocated into 3 groups of 10 rats to receive either ritonavir 20 mg/kg BW/ day, or ritonavir 20 mg/kg BW/day + primaquine 1.2 mg/kg BW/day, or ritonavir 20 mg/kg BW/day + rifampicin 100 mg/kg BW/day, given orally, once daily.
Sample collection
In the single-dose study, serial blood samples were collected at 0, 1, 2, 3, 4 and 6 hour/s after drug administration, while in repeated-dose study, serial blood samples were collected at day 0 (before drug administration), 1, 2, 3, 4 and 5. Blood samples were centrifuged at 3000 g for 15 minutes at 40C and the separated sera were assayed for plasma ritonavir concentrations on the same day.
HPLC method to determine ritonavir plasma concentration
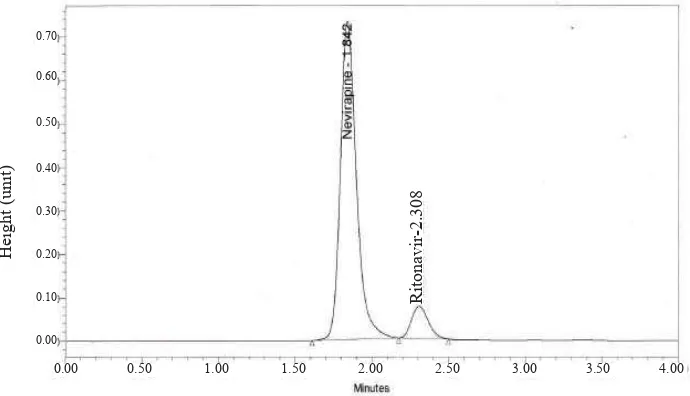
The concentration of ritonavir in plasma was measured using a validated HPLC method with ultraviolet detector at λ= 245 nm. The mobile phase was methanol: acetonitrile: H2O= 70:15:15, pumped isocratically at a
fl ow rate of 1.0 mL/min at 350C. We used nevirapine as internal standard. Retention time of ritonavir and nevirapine were at 2.3 and 1.8 min, respectively (Figure 1). Primaquine could not be detected in this system.
H
e
ig
h
t
(u
n
it
)
0.70
0.60
0.50
0.40
0.30
0.20
0.10
0.00
0.00 0.50 1.00 1.50 2.00 2.50 3.00 3.50 4.00
Figure 1. Chromatogram of ritonavir and nevirapine
Ritonavir
-2.308
Sample extraction and ritonavir concentration determination
Plasma sample (0.25 mL) was mixed with 50 μL nevirapine (internal standard) and 50 μL NaOH 0.1 N. The mixture was vortexed for 30 seconds before adding 1.5 mL of diethyl ether. Then, the sample was centrifuged at 3000 rpm for 5 minutes. The organic layer was evaporated under a gentle stream of nitrogen. The residue was reconstituted in 200 μL of mobile phase and an aliquot of 20 μL was injected to the HPLC system (WatersTM). The mixture was separated and the concentration determined on a Reverse Phase C18 Column (SymmetryTM C18 5 μm; 2.6 x 150 mm).
Analytical system validation
Analytical system validation was done and the result showed that the calibration curve was linear (r = 0.9999, n = 6) in the range of 0.05 – 1.6 μg/mL, and the limit of quantitation was 0.1 μg/mL. Precision, expressed as the intra (n=10) and inter-day (n=5) coeffi cient of variation, was ≤ 5.55 % on the same day and ≤ 7.34 % between days for each quality control sample of 1.5; 3 and 14 μg/mL, respectively. Accuracy expressed as the intra- and inter-day % bias was -1.1 – 8 % on the same day and -2.01 – 11.4 % between days at each quality control sample.
Statistical analysis
AUC of ritonavir was calculated using the trapezoidal rule based on plasma concentrations obtained at the predetermined sampling time points as stated in methods. AUC0-t(h) of ritonavir concentration were analyzed using the related one-way ANOVA followed by Tukey method for multiple comparisons at a
signifi cance level of α= 0.05, when the data showed a normal and homogenous distribution. The difference of the AUC0-t(h) of ritonavir in plasma in concomitant treatment are expressed in % versus ritonavir alone.
RESULTS
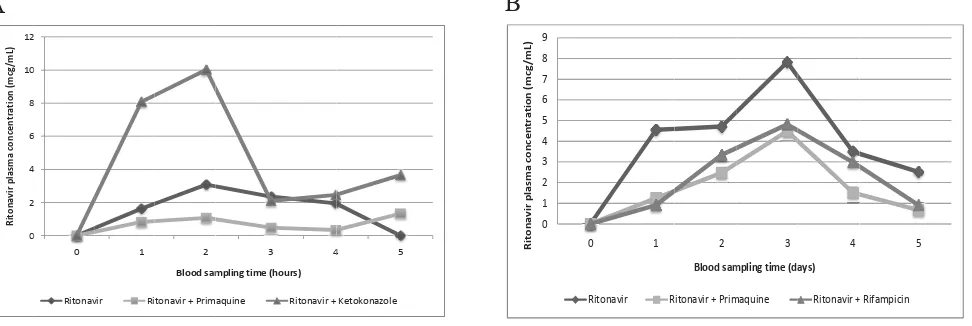
The mean concentration of ritonavir (± SD) in a single dose study and repeated dose study versus time is shown at Figure 2. In the single dose study, as a positive control for inhibitory study, concomitant administration of ritonavir with ketokonazole clearly showed an increase in the area under the plasma concentration (AUC) of ritonavir compared to ritonavir alone (increased by 114.8%, p<0.05), as expected. Ketokonazole is the known inhibitor of CYP3A4, an enzyme which also metabolizes ritonavir. Direct inhibition of metabolizing enzyme caused an increase in the plasma concentration of ritonavir. On the other hand, the administration of primaquine + ritonavir lowered the AUC of ritonavir (decreased by 32.6%, p>0.05) compared to ritonavir alone, but the decrease was not signifi cantly different.
The result of the repeated dose study, concomitant administration of ritonavir with rifampicin clearly showed a decrease in the AUC of ritonavir (decreased by 42.8%, p<0.001). This result was also expected. Rifampicin is the known inducer of cytochrome P450, not only the CYP3A4 but also several other cytochrome P450 isozymes. It was known from previous publications that the induction of cytochrome P450 in the rats might occur 3 – 5 days after drug exposure.10,11 Concomitant administration of primaquine with ritonavir given repeatedly for 5 days also lowered the AUC of ritonavir (decreased by 46.6%, p<0.001).
Figure 2. Mean of ritonavir concentration versus blood sampling time after: A. Single dose administration, B. Repeated dose administra-tion for 5-days.
Single dose administration of ritonavir and primaquine resulted in the decrease of ritonavir plasma concentrations, while ritonavir and ketokonazole as positive control increased ritonavir plasma concentrations (Fig 2A). Repeated dose administration of ritonavir and primaquine resulted in the decrease of ritonavir plasma concentrations, as did the positive control (ritonavir and rifampicin) (Fig 2B).
DISCUSSION
This study was conducted to test whether primaquine has an inhibiting or otherwise inducing effect on the metabolism of ritonavir. Most of inhibition of drug metabolism occur due to direct disruption of enzyme activity. On that account, we do a single-dose concomitant treatment to test the possibility of inhibiting effect of primaquine on the metabolism of ritonavir. Repeated dose study was done to investigate whether primaquine might have inducing effect on the metabolism of ritonavir. Xenobiotics can infl uence the extent of drug metabolism by activating transcription and inducing the expression of genes encoding drug metabolizing enzymes. Thus, a drug might induce the metabolism of other drugs after a certain amount of time and dose administered.12
The present study shows that single concomitant administration of ritonavir and ketokonazole results in the signifi cant increase of ritonavir plasma con-centration, while primaquine slightly reduces plasma concentration of ritonavir. Interaction between rito-navir and ketokonazole was as expected before. Ketokonazole clearly increased plasma concentration of ritonavir through its inhibitory mechanism to CYP3A4. Ketokonazole is commonly utilized as an index inhibitor of human CYP3A4 isoforms.13 Earlier research by Lim et al. 2009, showed that inhibition of CYP3A4 by ketokonazole was mediated by the disruption of pregnane X receptor, steroid receptor coactivator-1, and hepatocyte nuclear factor 4 [alpha] interaction.14
However, single concomitant administration of rito-navir and primaquine did not elevate the area under the plasma concentration of ritonavir. So, it is suggested that primaquine did not have inhibitory properties to CYP3A4 like that of ketokonazole. Altough not signifi cant, primaquine reduced plasma concentration of ritonavir. We supposed that this interaction occured in the absorption stage.
Drug-drug interactions that lead to altered drug absorption can infl uence the rate and/or the extent of absorption. Interactions affecting absorption can result from either the formation of insoluble complexes, changes to gastric pH/gastrointestinal motility or drug interaction via transport protein in the intestine.9 Primaquine is a weak base.15 At the dose that we use in this study, (1.2 mg/kgBB), it is unlikely for primaquine to affect gastric pH and alter ritonavir absorption through this mechanism. The most plausible explanation of this decrease might be through the interaction via transport protein in the intestine. It is known that both ritonavir and primaquine is a substrate of P-glycoprotein, an effl ux transporter that is widely expressed in the apical
side of the intestinal epithelia.16,17 However, no study has ever confi rmed the interaction of ritonavir and primaquine via P-glycoprotein before.
Our result showed that repeated-dose concomitant administration of ritonavir with rifampicin signifi cantly decreased the AUC of ritonavir, in accordance to concomitant administration of ritonavir with primaquine that consistently lowered the AUC of ritonavir. It is widely known that rifampicin is an inducer of cytochrome P450, not only of CYP3A4 isoform, but also inducer of CYP2Cs and CYP2Bs. Among those CYPs isoforms, CYP3As are more effi ciently induced by rifampicin.10 Rifampicin induces cytochrome P450 through the activation of pregnane X receptor (PXR), which acts as a ligand-activated transcription factor. Thus, when rifampicin binds to PXR, it activates transcription of CYP3A4 and several other genes.18
The fact that ritonavir alone, given in repeated-dose for 5 days, did not show dose accumulation is an interesting
fi nding. It was shown that plasma concentrations of ritonavir continued to increase from the fi rst administration to Day 3 (Figure 2B), but then started to decline on Day 4 and Day 5. We suggested that this is due to the autoinduction (the ability to induce its own metabolism) properties of ritonavir. Aside from its inhibitory properties to CYP3A4, ritonavir is also a moderate inducer of CYP3A4.19 However, the autoinduction effect of ritonavir to CYP3A4 still needs to be confi rmed.
Our results showed that both single- and repeated-dose concomitant administration of ritonavir and primaquine reduced the AUC of ritonavir. The decrease was signifi cant, and lowered ritonavir AUC by 46.6% (in repeated-dose study), which is similar to that caused by rifampicin (42.8%). This decrease could result in the insuffi cient concentration of ritonavir as anti-HIV, which might lead to treatment failure and drug resistance with protease inhibitor. In addition, ritonavir is widely used as agent to boost plasma concentrations of other protease inhibitors.
We propose two possible explanations for the decrease of ritonavir AUC by primaquine. Primaquine might have inducing effect to cytochrome P450 that occured through the activation of nuclear receptor. The second explanation, it might result from the cumulative decrease of ritonavir concentration that occured in the absorption site.
Our study used animal model to get initial information for drug interactions. The clinical application of this model is limited by species differences in patterns of metabolic biotransformation and systemic pharmacokinetics.20 Thus, our result still needs to be confi rmed in clinical trials that explore full pharmacokinetic parameters of ritonavir. Furthermore, this study only showed the effect of primaquine to the AUC of ritonavir. Therefore, further research to study the effect of ritonavir on plasma concentration of primaquine is a challenge.
In conclusion, this study showed that single- or repeated-dose administration of primaquine decreased plasma concentration of ritonavir in animal models. These
fi ndings may serve as an evidence-based information to conduct clinical trials in human.
Acknowledgments
This study was funded by Hibah Strategis Nasional 2009 contract number 407AC/DRPM-UI/A/N1.4/2009.
REFERENCES
Khoo S, Back D, Winstanley P. The potential for interactions 1.
between antimalarial and antiretroviral drugs. AIDS. 2005; 19: 995 -1005.
Hewitt K, Stekette R, Mwapasa V, Whitmorth J, French N. 2.
Interactions between HIV and malaria in non-pregnant adults: Evidence and implications. AIDS. 2006; 20: 1993 – 2004. Venkatakrishnan K, von Moltke LL, Greenblatt DJ. Human 3.
drug metabolism and cytochromes P450: Application and relevance of in vitro models. J Clin Pharmacol. 2001; 41: 1149 – 79.
Galappaththy GNL, Omari AAA, Tharyan P. Primaquine 4.
for preventing relapses in people with Plasmodium vivax malaria. Cochrane Database of Systematic Reviews. 2007; Issue 1; Art. No. CD004389.
Direktorat Jenderal Pengendalian Penyakit dan Penyehatan 5.
Lingkungan Depkes RI. Pedoman Penatalaksanaan Kasus Malaria di Indonesia. Jakarta: Depkes RI 2008.
Leslie T, Mayan I, Mohammed N, Erasmus P, Kolaczinsky 6.
J, Whitty CJM, et al. A randomised trial of an eight-week, once weekly primaquine regimen to prevent relapse of Plasmodium vivax in Northwest Frontier Province, Pakistan. PLoS ONE. 2008; 3:e2861
Li XQ, Bjorkman A, Andersson TB, Gustafsson LL, 7.
Masimirembwa CM. Identifi cation of human cytochrome
P450s that metabolise anti-parasitic drugs and predictions of in vivo drug hepatic clearance from in vitro data. Eur J Clin Pharmacol. 2003; 59:429 – 42.
Parker AJ, Houston JB. Rate-limiting steps in hepatic drug 8.
clearance: comparison of hepatocellular uptake and metabolism with microsomal metabolism of saquinavir, nelfi navir and ritonavir. Drug Metab Dispos. 2008; 26: 1375 – 84.
Elsherbiny D. Pharmacokinetic drug-drug interactions in 9.
the management of malaria, HIV and tuberculosis. Acta Universitatis Upsaliensis Uppsala. 2008; 68:11 – 6. Handschin C, Meyer UA. Induction of drug metabolism: The 10.
role of nuclear receptors. Pharm Rev. 2003; 55: 649 – 73. Perloff MD, von Moltke LL, Greenblatt DJ. Ritonavir 11.
and dexamethasone induce expression of CYP3A4 and P-glycoprotein in rats. Xenobiotica. 2004; 34:133 – 50. Gonzales FJ, Coughtrie M, Tukey RH. Drug metabolism. 12.
In: Brunton LL, Parker KL. (eds). Goodman and Gilman’s The Pharmacological Basis of Therapeutics. 12th ed. New York: Publ 2011. p. 123 – 43.
von Moltke, Durol ALB, Duan SX, Greenblatt DJ. Potent 13.
mechanism-based inhibition of human CYP3A in vitro by amprenavir and ritonavir: comparison with ketokonazole. Eur J Clin Pharmacol. 2000; 56: 259 – 61.
Lim YP, Kuo SC, Lai ML, Huang JD. Inhibition of CYP3A4 14.
expression by ketokonazole is mediated by the disruption of pregnanc X receptor, steroid receptor coactivator-1, and hepatocyte nuclear factor 4 [alpha] interaction. Pharmacogenet Genomics. 2009; 19: 11 – 24.
van Weert AW. Geuze HJ, Groothuis B, Stoorvogel W. 15.
Primaquine interferes with membrane recycling from endosomes to the plasma membrane through a direct interaction with endosomes which does not involve neutralisation of endosomal pH nor osmotic swelling of endosome. Eur J Cell Biol. 2000; 79: 394 – 9.
Hayesi R, Masimirembwa C, Mukanganyama S, Ungell 16.
ALB. The potential inhibitory effect of antiparasitic drugs and natural products on P-glycoprotein mediated effl ux. Eur J Pharm Sci. 2006; 29: 70 – 81.
Ho RH, Kim RB. Transporters and drug therapy: Implications 17.
for drug disposition and disease. Clin Pharmacol Ther. 2005; 78: 260 – 77.
Chen J, Raymond K. Roles of rifampicin in drug-drug 18.
interactions: underlying molecular mechanisms involving the nuclear pregnane X receptor. Ann Clin Microbiol Antimicrob. 2006; Feb 15;5:3.
Foisy MM. Induction effects of ritonavir: Implications for 19.
drug interactions. Ann Pharmacother. 2008; 42: 1048 – 59. Kotegawa T, Laurijssens BE, von Moltke LL, Cotreau 20.