Relationship of socioeconomic factors with vision-related quality
of life on severe low vision and blind population in Indonesia
Keywords: NEI VFQ 25, severe low vision and blind, socioeconomic, vision-related quality of life pISSN: 0853-1773 • eISSN: 2252-8083 • http://dx.doi.org/10.13181/mji.v24i4.1245 • Med J Indones. 2015;24:245–51
• Received 20 May 2015 • Accepted 17 Dec 2015
Correspondence author: Habsyiyah, [email protected]
Copyright @ 2015 Authors. This is an open access article distributed under the terms of the Creative Commons Attribution-NonCommercial 4.0 International License (http://creativecommons.org/licenses/by-nc/4.0/), which permits unrestricted non-commercial use, distribution, and reproduction in any medium, provided the original author and source are properly cited.
Habsyiyah,1
Yeni D. Lestari,1
Iwan Ariawan,2 Tjahjono D. Gondhowiardjo1
1 Department of Ophthalmology, Faculty of Medicine, Universitas Indonesia, Cipto Mangunkusumo Hospital, Jakarta, Indonesia
2 Department of Biostatistics and Population, Faculty of Public Health, Universitas Indonesia, Depok, Indonesia
C o m m u n i t y Re s e a rc h
ABSTRAK
Latar belakang: Faktor sosioekonomi diketahui memiliki hubungan dengan terjadinya gangguan penglihatan, dan gangguan penglihatan dapat mempengaruhi kualitas hidup seseorang. Penelitian ini bertujuan untuk menilai adanya hubungan faktor sosioekonomi terhadap kualitas hidup pada populasi gangguan penglihatan berat dan buta di Indonesia.
Metode: Penelitian potong lintang berbasis populasi ini dilakukan di 5 provinsi di Indonesia. Wawancara menggunakan kuesioner sosioekonomi dan national eye institute visual function questionnaire 25 (NEI VFQ 25) dilakukan pada responden RISKESDAS 2013 yang berusia di atas 18 tahun dan memiliki gangguan penglihatan berat (Visus≥3/60 hingga 6/60) dan buta (visus<3/60). Skor total NEI VFQ 25 dibandingkan berdasarkan derajat gangguan penglihatan, tingkat pendidikan, status bekerja, status buta huruf, tingkat pendapatan dan tempat tinggal. Hasil dianalisis menggunakan uji T tidak berpasangan atau Mann-Whitney dan uji kai kuadrat.
Hasil: Sebanyak 134 subyek masuk dalam kriteria inklusi penelitian ini. Sebaran subyek paling banyak berjenis kelamin perempuan (68,2%), usia >64 tahun (64,9%), berpendidikan rendah (65,7%), buta huruf (52,2%), berpenghasilan rendah (71,6%), tidak bekerja (63,4%) dan tinggal di daerah urban (58,2%). Kelompok buta memiliki skor kualitas hidup yang lebih rendah dibandingkan dengan kelompok gangguan penglihatan berat (p=0,001). Responden yang bekerja memiliki kualitas hidup yang lebih tinggi daripada yang tidak bekerja (p=0,041) sementara tingkat pendidikan, penghasilan, kemampuan baca tulis, dan tempat tinggal tidak menunjukkan perbedaan bermakna pada kualitas hidup.
Kesimpulan: Kualitas hidup terkait penglihatan pada populasi dengan gangguan penglihatan berat dan buta berhubungan dengan status bekerja. Karena pengaruh budaya dan karakter masyarakat Indonesia, kualitas hidup pada populasi tersebut tidak dipengaruhi oleh tingkat pendidikan, tingkat penghasilan, status buta huruf, dan tempat tinggal.
ABSTRACT
Background: Socioeconomic factors are known to be associated with visual impairment. Being someone who is visually impaired could affect his quality of life. The aim of this study is to evaluate the quality of life (QOL) in severe low vision and blind population in Indonesia in relation to their socioeconomic status.
Methods: A cross sectional population-based study was performed in 5 provinces, in Indonesia. Respondents of validation study on blindness data of national basic health survey 2013 (RISKESDAS 2013), who were above 18 years old with severe low vision (BCVA≥3/60 to 6/60) and blind (BCVA<3/60), were included in this study. Questionnaires for socioeconomic status and a questionnaire from the national eye institute visual function questionnaire 25 (NEI VFQ 25) for visual function were administered. Total scores of NEI-VFQ25 were compared based on severity of visual impairment, educational level, occupation, literacy adequacy, income level, and residency. Data analysis was using independent T-test or Mann-Whitney test, and Chi square test.
Results: A total of 134 subjects were enrolled in this study, most of them are women (68.2%), aged >64 years old (64.9%) with low education (65.7%), illiterate (52.2%), low income (71.6%), non working (63.4%) and living in urban areas (58.2%). The blind population has lower VFQ scores than severe low vision (p=0.001). Different status of educational level, literacy adequacy, income level and residency did not show significant difference in VFQ scores, but those who have an occupation had better VFQ scores than those who do not (p=0.041).
World Health Organization stated that 39 million people were blind worldwide and approximately
90% of them were living in developing countries.1
Indonesian Ministry of Health survey in 1993– 1996 had reported that the prevalence of
blindness in Indonesia was 1.5%.2 It means that
Indonesia has the second highest prevalence of
blindness in the world after Ethiopia.
Socioeconomic status such as level of education and income might be one of main factors determining health status including visual
impairment or blindness.3 Some studies showed
that people with low level education or low income had worse vision compared to those with
better socioeconomic status.4-6
The impact of visual impairment on vision-specific functioning may vary in population with different sociodemographic and economical characteristics especially when associated with
level of education, literacy, occupation, etc.7
Therefore, identifying the sociodemographic characteristic(s) within a group that is at higher risk of being affected by vision impairment related to their quality of life will lead to more targeted interventions in public health programs
and facilitate its implementation.7,8
Several methods have been used in measuring health related quality of life. In ophthalmology, there are establihed methods to measure visual function index such as the VF-14 and the national eye institute visual function questionnaire 25
(NEI VFQ 25).9 Till recent time, there have been no
data regarding the relationship of socioeconomic factors with the quality of life in severe low vision and blind population in Indonesia. This study aimed to evaluate vision-related quality of life in severe low vision and blind population in Indonesia related to their socioeconomic status.
METHODS
This study was a population-based cross sectional study which was conducted in five provinces in Indonesia, namely DKI Jakarta, West Sumatera, South Sulawesi, East Java, and Yogyakarta. The location of study was choosen based on their level of blindness and visual impairment data reported by national basic health survey (RISKESDAS) 2013
study.10 This study had been approved by ethical
commitee of Health Research and Development Body of Ministry of Health (LB.02.01/5.2/ KE.402/2013).
Respondents who were diagnosed of having blind or severe low vision (SVI) by RISKESDAS investigators were invited to primary health care or visited at their home by the study teams which consist of refractionists and residents of ophthalmology, supervised by ophthalmologists, to have a full eye examinations. After receiving explanation and signed the informed consent, all subjects underwent visual acuity (VA) examination including presenting VA and corrected VA, anterior segment, posterior segment of eyes, and intraocular pressure examination. Based on all the finding, the diagnosis and the main cause of visual impairment were determined.
Respondents that are older than 18 years, classified as blind (presenting VA<3/60 in the better eye) and SVI (presenting VA≥3/60 to 6/60 in the better eye) were included in this study. Purposive sampling methods were used based on those criteria. Any patient with difficulties in the interview process was excluded. Minimal sample size was counted based on criteria provided by NEI VFQ 25 using independent T-test formula. Point difference of 10 was considered significant and standard deviation was 20 point. Power of
20% was used.11
A validated modified NEI VFQ 25 was used to
assess the vision related quality of life (VRQoL) on
the respondents.12,13 This questionnaire has been
translated into Indonesian language and back-translation was done by the registered translator. Socioeconomic questionnaire used in this study was based on criteria provided by Office of Statistics Centre (Biro Pusat Statistik). A validation of translated NEI VFQ 25 and socieconomic questionnaires were conducted before they were used in this study. Each respondent was interviewed by trained interviewer.
and working status. Comparison of demographic characteristics was made to evaluate the equality between socioeconomic groups.
Level of education was divided into three categories; low if respondents did not pass elementary school, moderate if only passed junior high or high school, and high if respondents passed academic school. Literacy was defined as the respondents not being able to read nor write
adequately. Income status was classified into four
categories; very high income was if respondents’ average income was above IDR 3,500,000, high was IDR 2,500,000–3,500,000, moderate was IDR 1,500,000–2,500,000, and low was under IDR 1,500,000 per month. Occupational status was divided into working and not working and area of living consists of urban and rural area. Non-productive age was defined if a person aged above 64 years old. We also analyzed correlation between socioeconomic factor and history of previous consultation with an ophthalmologist.
Statistic analysis was done using SPSS program v.16.0. Numeric data were calculated using unpaired T-test or Mann-Whitney test while categorical data were calculated by Chi square test.
RESULTS
A total of 134 respondents met the inclusion and exclusion criteria. The majority of the respondents were female (68.2%). The age range of the respondents were 28–95 years old, with most of the respondents (64.9%) were above 64 years old which considered as a non-productive age.
This study found that 46 (34.3%) respondents were severe low vision and 88 (65.7%) respondents were blind. Cataract (73.9%) was the main cause of visual impairment followed by optic neuropathy (5.2%), glaucoma (5.2%), and refractive error (4.5%). The average duration of visual impairment experienced by respondents was 6.38±10.32 years.
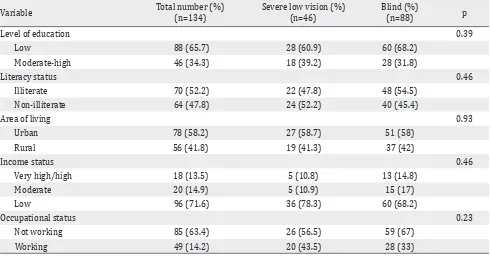
Respondents’ socioeconomic characteristics showed no significant difference between severe low vision group and blind group, as shown in table one. More respondents had lower level of education (65.7%), illiterate (52.2%), live in urban area (58.2%), lower income (71.6%), and not working (63.4%). We also recorded the length of unemployment from the not working group (26 respondents) and found that the mean of length unemployment was 9.88±6.50 years.
Variable Total number (%)
(n=134)
Severe low vision (%) (n=46)
Blind (%)
(n=88) p
Level of education 0.39
Low 88 (65.7) 28 (60.9) 60 (68.2)
Moderate-high 46 (34.3) 18 (39.2) 28 (31.8)
Literacy status 0.46
Illiterate 70 (52.2) 22 (47.8) 48 (54.5)
Non-illiterate 64 (47.8) 24 (52.2) 40 (45.4)
Area of living 0.93
Urban 78 (58.2) 27 (58.7) 51 (58)
Rural 56 (41.8) 19 (41.3) 37 (42)
Income status 0.46
Very high/high 18 (13.5) 5 (10.8) 13 (14.8)
Moderate 20 (14.9) 5 (10.9) 15 (17)
Low 96 (71.6) 36 (78.3) 60 (68.2)
Occupational status 0.23
Not working 85 (63.4) 26 (56.5) 59 (67)
Working 49 (14.2) 20 (43.5) 28 (33)
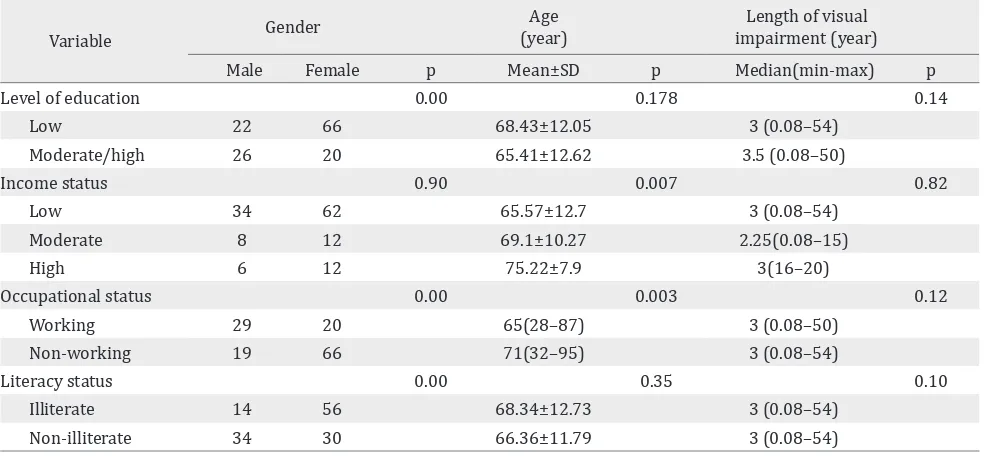
We compared the demographic characteristics related to each socioeconomic level as seen in table two. There were significant differences of gender in relation to educational level (p=0.000), literacy status (p=0.000), and occupational status (p=0.000), but no difference on income status (p=0.902). There was also inequality of age on population with different income status (p=0.007) and occupational status (p=0.003). This table also shows that there was no correlation on length of visual impairment to various level of socioeconomic factors.
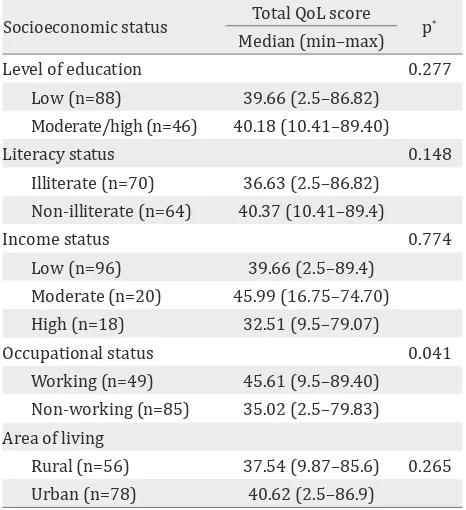
Comparison of vision related quality of life between severe low vision and blind group showed that the severe low vision group had better quality of life than blind group (p=0.001). In this study, there were only three subjects who had high educational level, therefore in VRQoL score analysis we regrouped the level of education into two groups; low educational level and moderate-high educational level. There was no significant difference on VRQoL total score between low educated and moderate-high educated groups (p=0.277), eventhough the group with higher educational level had higher total score, as shown in table three. On literacy status category, as classified into illiterate and adequate literacy, there was no significant difference between this group related to total score of VRQoL (p=0.148), but group with adequate literacy had higher VRQoL total
Variable Gender
Age (year)
Length of visual impairment (year)
Male Female p Mean±SD p Median(min-max) p
Level of education 0.00 0.178 0.14
Low 22 66 68.43±12.05 3 (0.08–54)
Moderate/high 26 20 65.41±12.62 3.5 (0.08–50)
Income status 0.90 0.007 0.82
Low 34 62 65.57±12.7 3 (0.08–54)
Moderate 8 12 69.1±10.27 2.25(0.08–15)
High 6 12 75.22±7.9 3(16–20)
Occupational status 0.00 0.003 0.12
Working 29 20 65(28–87) 3 (0.08–50)
Non-working 19 66 71(32–95) 3 (0.08–54)
Literacy status 0.00 0.35 0.10
Illiterate 14 56 68.34±12.73 3 (0.08–54)
Non-illiterate 34 30 66.36±11.79 3 (0.08–54)
Table 2. Relationship of gender, age, length of visual impairment with level of socioeconomic status
score than the illiterate. On income variable, the category of very high and high income were merged because of small respondents number, so there were three groups of income variable being compared. It showed that there was no significant difference of VRQoL total score among those groups (p=0.774). Statistical analysis of VRQoL total score between the working and not working groups revealed significant differences (p=0.041). Working respondents had better QoL total score then those who not working respondents. There was no significant difference in VRQoL total score between respondents who live in urban area and rural area (p=0.265), though those who live in urban had higher total score.
There was a significant association between history of consultation with an ophthalmologist with the level of education (p=0.000) and literacy status (p=0.001), but not with area of living, income status or occupational (Table 4).
DISCUSSION
This study showed that 35.1% of respondents were at a productive age-range. Respondents’
dependency to other people gave significant
Socioeconomic status Total QoL score p*
Median (min–max)
Level of education 0.277
Low (n=88) 39.66 (2.5–86.82) Moderate/high (n=46) 40.18 (10.41–89.40)
Literacy status 0.148
Illiterate (n=70) 36.63 (2.5–86.82) Non-illiterate (n=64) 40.37 (10.41–89.4)
Income status 0.774
Low (n=96) 39.66 (2.5–89.4)
Moderate (n=20) 45.99 (16.75–74.70) High (n=18) 32.51 (9.5–79.07)
Occupational status 0.041
Working (n=49) 45.61 (9.5–89.40) Non-working (n=85) 35.02 (2.5–79.83) Area of living
Rural (n=56) 37.54 (9.87–85.6) 0.265 Urban (n=78) 40.62 (2.5–86.9)
Table 3. Comparison of VRQoL total score on visual impair-ment respondents to the level of socioeconomic status
*: Mann Whitney test
Variable History of consultation
Illiterate 15 55
Non-illiterate
30 34
Area of living 0.298
Rural 16 40
Table 4. Association of socioeconomic status with history of consultation to an ophthalmologist
*: Chi square test
errors (10.6%), which were preventable and treatable eye disorders. Immediate rehabilitation will directly increase productivity and respondents’
quality of life, that will reduce social burden.14
The proportion of respondents consisted of more women (64.2%). This finding was similar with WHO’ report from several surveys in African, Asian countries with lower gross domestic product (GDP) and many countries with high income, that showed 65,0% of blind population in the world is
dominated by women.15
In this study, 65.7% of the respondents had low level of education and only 47.8% had adequate
literacy. Singapore-Indian Eyes Study6 and
Singapore-Malay Eyes Study16 mentioned that lower
level of education was related to visual impairment, and it was a significant risk factor. Beijing Eyes
Study17 also showed that the prevalence of visual
impairment and blindness were related to level of
education. Pakistan National Eyes Study18 showed
that educational status was significantly related to severe low vision and blindness. That condition was similar to the results of this study, visual impairment was related to low level of education. However, we could not conclude that educational status was a risk factor from this study, since it had different method of study.
Zheng et al19 found that illiterate people
were twice more vulnerable of having visual impairment compared to those literate people. Study in India, Nepal, and Bangladesh even
showed that risk was three times higher.20-24
People with inadequate literacy have difficulties in understanding medical information which have relation with the adequacy of treatment. Health literacy is the ability to read, understand, and use the information related to health service in making decision and following treatment/therapy
instruction.19 Similar to this study, educational
status and literacy influence respondents in seeking treatment to the ophthalmologist. Health literacy is an important factor since it will influence the success of public health educational and rehabilitation program.
family income less than IDR 1,500,000 per month, it means that most of the respondents had low income, but statistically the low income did not
relate to visual impairment degree. Saw et al25
study showed that those with lower family income had higher prevalence of blindness compared to those who had higher income.
Different number of eye health centers, educational level, lifestyle, and economic status have different consequences to mortality and health status in urban and rural population. In this study, there was no difference in demographic and socioeconomic characteristic between respondents who live in urban and rural area. It
was similar to Beijing Eye Study.17
Nutheti et al14 found that quality of life score in
respondents with visual impairment were lower in respondents with low income and low level
of education. The study by Nirmalan et al26 also
showed that quality of life score and visual function were better in respondents who were employed and educated compared to those unemployed and uneducated respondents. Similar result was also
stated by McClure et al,27 subjects with job and
higher income had higher score.
In our study, the socioeconomic variable which significantly related to VRQoL score was occupational status (p=0.041). Meanwhile, level of education, literacy status, income level, and area of living were not related significantly. While, other studies found that better socioeconomic status results in better quality of life. The difference between our study and other countries’ studies was related to Indonesian culture and beliefs, in which many elderly live with other family members as a big family, thus they could help the persons with visual impairment. In addition, level of income was not statistically significant in affecting visual impairment that might be related to less sensitive parameter used in this study which might cause bias. While having a job indicates that they still can function and are still productive in their daily life regardless of their visual impairment condition.
Generally, respondents who live in urban area tend to have higher quality life score in all of subscales, but was not statisticaly significant. The different culture of urban and rural area in one to other provinces might also have influence in the quality of life.
The present study has some limitations that potentially bring to bias. This study used purposive sampling method which is highly prone to researcher bias. Another possible bias come from the interview method used in collecting respondents’ data. Data collecting was held at the same time within several areas by several teams. Although questionnaire filling was done by each interviewer team that had been trained before, local language variety in each province could also cause bias, even though in each interview, a translator was available.
Educational and literacy status were significantly associated with respondents’ history of consultation with ophthalmologists. This means that with better educational level and literacy status of a respondent, he/she was more aware with his/her eye health condition and seeking appropiate treatment for their eye conditions. The difference of socioeconomic status such as income level, occupational status, rural/urban area of respondents’ residence, and degree of visual impairment did not associate with the number of respondents who seek help to the ophthalmologist. Contrary to this, Wagner and
Rein28 found that factors which relate to number
of visit to eye care services were availability of health insurance and high level of income. This result has shown that most Indonesian lack of awareness in seeking help to eye health services. The delay to seek for help because they are not aware the availability of eye health services or treatment to improve their health condition. This condition shows that improvement of health education and awareness to public was necesssary. Cataract as the major cause of visual impairment group was actually treatable, thus blindness could be preventable. Based on our study, we could put sign of red spot on those areas where being needed for getting help for eye care. By improving education and giving counseling with new and high technology, eyes health information’s could better cover all parts of the country.
quality of life of severe low vision and blind population in Indonesia.
Conflicts of interest
The authors affirm there is no conflict of interest in this study.
Acknowledgement
The authors gratefully acknowledge the full support of DR. dr. Widya Artini, SpM(K), the head of Ophthalmology Department, Faculty of Medicine, Universitas Indonesia.
REFERENCES
1. www.who.int [Internet]. Visual impairment and blindness [cited July 2014]. Available from: http:// www.who.int/mediacentre/factsheets/fs282/en/ 2. Departemen Kesehatan Republik Indonesia. Survey
Kesehatan Indera Penglihatan Tahun 1993–1996. Jakarta: Departemen Kesehatan RI; 1998. Indonesian. 3. Zheng Y, Lamoureux E, Finkelstein E, Wu R, Lavanya
R, Chua D. et al. Independent impact of area-level socioeconomic measures on visual impairment. Invest Ophthalmology Vis Sci. 2011;52(12):8799–805.
4. Dandona L, Dandona R, Srinivas M, Giridhar P, Vilas K, Prasad MN,et al. Blindness in the Indian state of Andhra Pradesh. Invest Ophthalmology Vis Sci. 2001;42(5):908–16. 5. Chong EW, Lamoureux EL, Jenkins MA, Aung T, Saw
SM, Wong TY. Sociodemographic, lifestyle, and medical risk factors for visual impairment in an urban asian population: the singapore malay eye study. Arch Ophthalmol. 2009;127(12):1640–7.
6. Zheng Y, Lavanya R, Wu R, Wong WL, Wang JJ, Mitchell P, et al. Prevalence and causes of visual impairment and blindness in an urban Indian population: the Singapore Indian Eye Study. Ophthalmology. 2011;118(9):1798–804. 7. Chiang PP, Zheng Y, Wong TY, Lamoureux EL. Vision
impairment and major causes of vision loss impacts on vision-specific functioning independent of socioeconomic factors. Ophthalmology. 2013;120(2):415–22.
8. Livingston P, McCarty C, Taylor HR. Visual impairment and socioeconomic factors. Br J Ophthalmol. 1997;81(7):574–7. 9. Pesudovs K. Patient-centred measurement in
ophthalmolog--a paradigm shift. BMC Ophthalmol. 2006;6:25.
10. Kementerian Kesehatan Republik Indonesia. Riset kesehatan dasar 2013. Jakarta: Badan Litbangkes; 2013. Indonesian.
11. Mangione CM, Lee PP, Gutierrez PR, Spitzer K, Berry S, Hays RD,et al. Development of the 25-list-item national eye institute visual function questionnaire. Arch Ophthalmol. 2001;119(7):1050–8.
12. Massof RW, Fletcher DC. Evaluation of the NEI visual functioning questionnaire as an interval measure of visual ability in low vision. Vision Res. 2001;41(3):397–413. 13. Lamoureux EL, Pesudovs K, Thumboo J, Saw SM, Wong,
TY. An evaluation of the reliability and validity of the visual functioning questionnaire (VF-11) using Rasch
analysis in an Asian population. Invest Ophthalmol Vis Sci. 2009;50(6):2607–13.
14. Nutheti R, Shamanna BR, Nirmalan PK, Keeffe JE, Krishnainah S, Rao GN,et al. Impact of impaired vision and eye disease on quality of life in Andhra Pradesh. Invest Ophthalmol Vis Sci. 2006;47(11):4742–8. 15. www.who.int [Internet]. Gender and Blindness, Gender
and health information sheet. [update Aug 2014, cited Sept 2014]. Available from: http://www.who.int/ gender-equity-rights/knowledge/a85574/en/
16. Wong TY, Chong EW, Wong WL, Rosman M, Aung T, Loo JL, et al. Prevalence and causes of low vision and blindness in an urban Malay population: the Singapore Malay Eye Study. Arch Ophthalmol.
17. Xu L, Wang Y, Li Y, Wang Y, Cui T, Li J,et al. Causes of blindness and visual impairment in urban and rural areas in Beijing: the Beijing Eye Study. Ophthalmology. 2006;113(7):1124.e1–11.
18. Jadoon MZ, Dineen B, Bourne RR, Shah SP, Khan MA, Johnson GJ,et al. Prevalence of blindness and visual impairment in Pakistan: the Pakistan National Blindness and Visual Impairment Survey. Invest Ophthalmol Vis Sci. 2006;47(11):4749–55.
19. Zheng Y, Lamoureux EL, Chiang PP, Cheng CY, Anuar AR, Saw SM,et al. Literacy is an independent risk factor for vision impairment and poor visual functioning. Invest Ophthalmol Vis Sci. 2011;52(10):7634–9.
20. Nirmalan PK, Thulasiraj RD, Maneksha V, Rahmathullah R, Ramakrishnan R, Padmawathi A,et al. A population based eye survey of older adults in Tirunelveli district of south India: blindness, cataract surgery, and visual outcomes. Br J Ophthalmol. 2002;86(5):505–12. 21. Vijaya L, George R, Arvind H, Baskaran M, Raju P,
Ramesh SV,et al. Prevalence and causes of blindness in the rural population of the Chennai Glaucoma Study. Br J Ophthalmol. 2006;90(4):407–10.
22. Murthy GVS, Gupta SK, Bachani D, Jose R, John N. Current estimates of blindness in India. Br J Ophthalmol. 2005;89(3):257–60.
23. Sapkota YD, Pokharel GP, Nirmalan PK, Dulal S, Maharjan IM, Prakash K. Prevalence of blindness and cataract surgery in Gandaki Zone, Nepal. Br J Ophthalmol. 2006;90(4):411–6. 24. Dineen BP, Bourne RRA, Ali SM, Huq DMN, Johnson
GJ. Prevalence and causes of blindness and visual impairment in Bangladeshi adults: results of the National Blindness and Low Vision Survey of Bangladesh. Br J Ophthalmol. 2003;87(7):820–8.
25. Saw SM, Husain R, Gazzard GM, Koh D, Widjaja D, Tan DTH. Causes of low vision and blindness in rural Indonesia. Br J Ophthalmol. 2003;87(9):1075–8.
26. Nirmalan PK, Tielsch JM, Katz J, Thulasiraj RD, Krishnadas R, Ramakrishnan R, et al. Relationship between vision impairment and eye disease to vision-specific quality of life and function in rural India: the Aravind Comprehensive Eye Survey. Invest Ophthalmol Vis Sci. 2005;46(7):2308–12.
27. McClure TM, Choi D, Becker T, Cioffi GA, Mansberger SL. The effect of visual impairment on vision-related quality of life in American Indian/Alaska Natives. Ophthalmic Epidemiol. 2009;16(2):128–35.