STUDY OF LOCAL PE OPLE PE RCE PTION RE LATE D TO LANDSLIDE HAZARD: A CASE OF TAWANGMANGU SUB-DISTRICT KARANGANYAR
RE GE NCY INDONE SIA
Studi Tentang Persepsi Masyarakat Lokal Terhadap Bencana Tanah Longsor: Kasus Di Kecamatan Tawangmangu Kabupaten Karanganyar Indonesia
Heru Setiawan1 dan Dyah R Hizbaron2
1) Researcher of Forestry Research Institute of Makassar 2) Lecturer of Geography Faculty, Gadjahmada University
e-mail: hiero_81@ yahoo.com
ABSTRACT
In 2007, a series of landslides occurred at Tawangmangu, resulting in the collapse of several houses and the death of dozens of people. One essential pathway to reduce the vulnerability of communities goes through an increased preparedness. The present contribution aims to determine existing level of preparedness by analysing the people perception and k nowledgeof landslides. Survey method with random sampling technique was applied to assess the level of people perception and to analysis local people k nowledge regarding with landslide. The number of respondents was spread proportionally across five sub-villages; Plalar, Guyon, Sodong, Salere and Ngledok sari. The respondents were interviewed using questionnaires with open and closed questions. Statistical analysis with multiple linear regressions was applied to identify the influencing factors of local people perception related to landside. The result show that people in the area have good k nowledge and perception about landslide. This condition is commonly influenced by age and education.
Keywords: Landslide, people perception, Tawangmangu, disaster, hazard knowledge, vul-nerability assessment
ABSTRAK
Bencana tanah longsor yang terjadi di Kecamatan Tawangmangu pada tahun 2007 mengak ibatk an puluhan rumah roboh dan k ematian. A nalisis persepsi masyarak at terhadap longsor merupak an salah satu elemen yang penting untuk mengetahui k esiapsiagaan masyarak at dalam menghadapi bencana longsor yang ak an terjadi di masa mendatang dan untuk meminimalk an dampak negatif yang timbul ak ibat bencana longsor. Untuk mengetahui tingk at persepsi dan pengetahuan masyarak at terhadap longsor digunak an metode survey dengan pengambilan responden yang dilak uk an secara acak . Jumlah responden ditentuk an secara proporsional dan tersebar di lima dusun yaitu Plalar, Guyon, Sodong, Salere and N gledok sari. Wawancara terhadap responden dilak uk an dengan menggunak an quesioner dengan tipe pertanyaan terbuk a dan tertutup. Data yang didapat selanjutnya dianalisis secara statistik dengan menggunak an metode regresi linear berganda untuk mengetahui fak tor-fak tor yang mempengaruhi tingk at persepsi masyarak at local terhadap longsor. Hasil pengamatan di lapangan menunjuk k an bahwa secara umum masyarak at memilik i persepsi dan pengetahuan yang baik terhadap longsor. Kondisi tersebut dipengaruhi oleh umur dan pendidik an.
INTRODUCTION
One of hazard occurred frequently in sia is landslide. Almost every place in Indone-sia especially on mountainous area, land-slide usually happened. Landland-slides commonly happen during rainy season between De-cember and February. They bring extensive damages on property and cause losses of lives. According to the data that published by National Disaster Management Agency (BNPB, 2009), amount of dead people in 1998 until 2007 caused by landslide are 1,362 and the injured victims 315 people. Landslide has been considered as the top-five rank of most frequent disasters in In-donesia with the average events of 92 per year, after floods with 297 events per year, droughts with 156 events per year, fires with 147 events per year and typhoons with 110 events/ year (Karnawati et al, 2012).
Landslide can be triggered by several fac-tors such as intense rainfall, earthquake shaking, water level change, storm waves or rapid stream erosion that cause a rapid increase in shear stress or decrease in shear strength of slope-forming materials (Dai et al, 2002). On the other hand, human activities have significant role for landslide occur-rences for example undercutting of steep slopes for road construction and housing.
Tawangmangu is one of sub-district in K aranganyar regency, Central Java that sus-ceptible to landslide. The two major of landslide events in 2007 in Tawangmangu has resulted 33 houses collapsed and 34 people died. The driving factors of the event were high intense rainfall, morpho-logical condition, slope and land use change (Prawiradisastra, 2008). Based on these land-slide events, the research related to the lo-cal people perception on landslide becomes important. By knowing the people percep-tion about disaster, will be know how respond of people to survive and to cope from
di-saster in the future. The people perception about disaster and its negative impacts because of disaster will affected the ability of people to cope the disaster. Ability of people to deal with a disaster will reduce the negative impact which may be caused by the disaster (Sare, 2009). Community’s perception is considered being fundamen-tal for the behaviour towards risks and for the decision to take preventive measures (Rianto, 2009). Information on risk is impor-tant to reduce loses when disaster actually comes (Hizbaron, et al., 2010). The general objective of this research is to analyse the local people’s perception in relation to land-slide. The more specific objectives are to analyze the factors that influence local community’s perception of landslides.
RE SE ARCH ME THOD
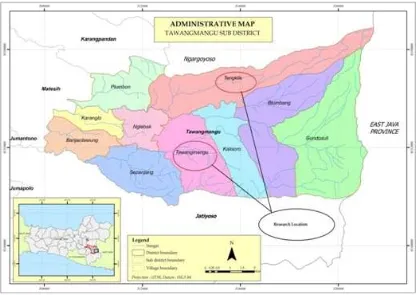
The study site is located in Tawangmangu Sub-district with cover areas 70.03 km2 and altitude average 1,200 meters above sea level (BPS, 2011). T he results of spatial data analysis related susceptibility to land-slide show that most of area in the Tawangmangu Sub-districts categorized in medium susceptibility class was covering 2,674.888 Ha (Wati et al, 2010). This re-search was conducted on August till November 2012 (Figure 1).
Where:
2
= E rror standard = 1 d = Standard deviation = 0.05 P = Q = Probability = 0.5 S = Total sampleN = Population
Base on Sugiyono (2007) formulation, the total minimum respondent that must be taken is 93 household. The respondents were distributed proportionally by considering the number of people in each sub-village. The amount of respondent is 14 respondents in Plalar Sub-village, 16 respondents in Guyon village, 25 respondents in Sodong Sub-village, 22 respondents in Selere Sub-village and 16 respondents in Ngledoksari Sub-village. The questionnaire with close and open ended questions used in order to collect
the primary data from household survey. The questions included close question with “agree” until “not agree” and open ques-tion to give opportunity for respondent to explore their opinion. The answer scored using L ink ertscale as 5 if “fully agree” until 1 if “fully not agree” (Albaum, 1997). The data analysis process included several tech-niques, as follow: descriptive statistics analysis, linear regression analysis and chi-square analysis.
Some of equipments were used in this re-search; consist of Global Positioning System (G PS), recorder device, digital camera, printer, printed thematic map, printed sat-ellite imageries, questionnaire sheet and list of question for interview, stationery. Soft-ware was applied for data analysis com-prises Microsoft Office 2007 (Word, Excel) and SPSS 19 for statistical data processing.
RE SULT AND DISCUSSION Characteristic of Respondents
Totally, the amount of sample is 93 respon-dents consisted of 69% were men and 31% were women. The age of respondents is rang-ing from 23 to 82 years old, 41% respondents were between 23 and 39 years old, 45 % were 40 to 59 years old and 13% were 61 years old or older. Base on the monthly income, 48 % of the respondents reported monthly in-comes lower than $95 and 52% more than $95. As regards level of education, 55% of respondents had attended elementary school or under, 23% junior high school, 17% se-nior high school and 5% had a university degree. Regarding the occupation type, at the time of data collection 46% of the sample were farmer, while 11% were trader and self-employed, 4% were civil servant, 20% were private employees and 18% have non-per-manent occupation. The size of the surveyed households was dominated by the household with the 3 to 4 of family member (58%), fol-lowed by 5 to 6 member with 24% of re-spondents, 14% with 1-2 member and 4% with more than 6 member. Most of respon-dents have permanent building (70%), 17% semi permanent and 13% of respondent have non- permanent house. Regarding on the landslide experience, the majority of respon-dents (50%) experienced the landslide more than twice, while 24% respondents were twice and 26% respondent have once expe-rienced in landslide.
Local People’s Perception to Landslide Risk perception is characterized as the intuitive judgment of individuals and groups of risks in the context of limited and uncertain infor-mation (Slovic, 2000). Perceptions regarding the definition of landslides declared that most respondents (40%) answered mass of rock and soil that fallout. Deforestation is a major cause of the landslide chosen by 35% respondents, while the location of the
landslide occurred dominated in steep slopes area with 68% respondents. Type landslides that have occurred in the study area were Topple (47%). Losses caused by landslides consisting of physical and non-physical losses. Perception population re-garding the major physical losses caused by landslides is house damage (71%), while the non-physical is trauma (66%).
The level of risk perception is derived by calculating the answer of respondents from the questionnaire. The result of calcula-tion was categorized in three classes: Low, Moderate, and High. Cross tabulation be-tween people perception and domicile of respondents (sub -village) was presented on the table 1.
Cross tabulation is a summary of the data presented in table form. On the table 1, it can be seen that totally, 43 respondents (46%) have moderate level of risk percep-tion, 44 respondents have high level (47%) and only 6 respondents (6%) that have low level of perception. On the low level was scattered in Plalar Sub-village 1 respon-dent, Salere 3 respondents, Sodong and Ngledoksari have the same number with 1 respondent. People who have moderate level spread across Guyon Sub-village 11 respondents, Plalar 6 respondents, Salere 11 respondents, 9 respondents in Ngledoksari and 6 respondents in Sodong Sub-village. Population with a high level of perception amounted to 44 respondents with a composition in Guyon Sub-village 5 respondents, Plalar 7 respondents, Salere 8 respondents, 18 respondents in Sodong and 6 respondents in Ngledoksari.
alter-native hypothesis (Ha) stated that there is a differences level of perception in five sub-villages. T he decision making was deter-mined by looking at the ratio between the value of calculated chi-square and the value of chi-square table. Null hypothesis is ac-cepted if the value of calculated chi-square is less than the value of chi-square table and the opposite, null hypothesis is rejected if the value of calculated chi-square is greater than the value of chi-square table.
Base on the Table 2 can be seen that value of calculated chi-square was 12.911 and chi-square table is 15.507. Because of the value of calculated chi-square (12.911) less than the value of chi-square table (15.507),
null hypothesis is accepted, meaning that there was no differences level of people’s perception in five sub-villages or there was no correlation between the level of people perceptions and the domicile of respon-dents (sub-village).
Influencing Factors of People Perception Westen and Kingma (2011) mentioned that the level of risk perception depend on their personal situation, cultural and religious background, social background, economic level, political background, level of aware-ness, media exposure, other risks and risk reduction situation. Before conducting an analysis of factors that influence percep-tion, the first thing to do is analysis to the
Sumber: primary data analysis
Tabel 1. Cross Tabulation Between People Perception and Domicile of Respondents
People_Perception * Sub_Village Crosstabulation
Count
Sub_village
Total Guyon Plalar Salere Sodong Ngledoksari
People_ perception
Low 0 1 3 1 1 6
Moderate 11 6 11 6 9 43
High 5 7 8 18 6 44
Total 16 14 22 25 16 93
Chi-Square Tests
Value df Asymp. Sig. (2-sided)
Pearson Chi-Square 12.911a 8 .115
Likelihood Ratio 13.616 8 .092
Linear-by-Linear Association
.682 1 .409
N of Valid Cases 93
a. 5 cells (33.3%) have expected count less than 5. T he minimum expected co unt is .90. Sumber: primary data analysis
factors that have correlation with the level of community’s perception related to land-slide. Social economic characteristic of respondents preassumed has correlations with the level of landslide perception of local community. Independent factors of respon-dents comprise age, gender, education, house-hold size, occupation, income, building type and people experience to the landslide.
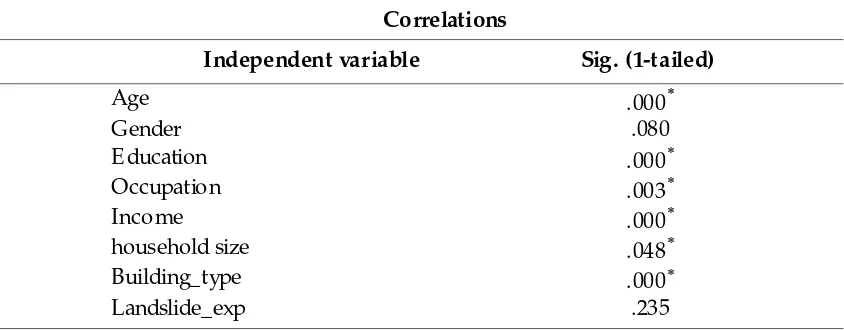
Correlation analysis was conducted using SPSS Software. The null hypothesis stated that independent variables (age, gender, education, occupation, income, household size, building type and landslide experience) do not have a correlation with the depen-dent variable (community’s perception). Decision-making is based on the null hypo-thesis that will be accepted if the value of Sig. (1-tailed) > 0.05. The results of correla-tion analysis are presented in the Table 3.
The null hypothesis used in this analysis is independent variables (age, gender, edu-cation, occupation, income, household size, building type and landslide experience) do not have a correlation with the depen-dent variable (people perception).
Probabil-ity value (P-value) was used 0.05.
Decision-making is based on the null hypothesis that
will be accepted if the value of Sig. (1-tailed) > 0.05. From calculations process using SPSS software (see Table 3) can be seen that there are five variables that have a sig. (1-tailed) < 0.05, those are age, education, occupa-tion, income, household size and building type. It can be concluded that the variables that have a correlation with the local people perception are age, education, occupation, income, household size and building type.
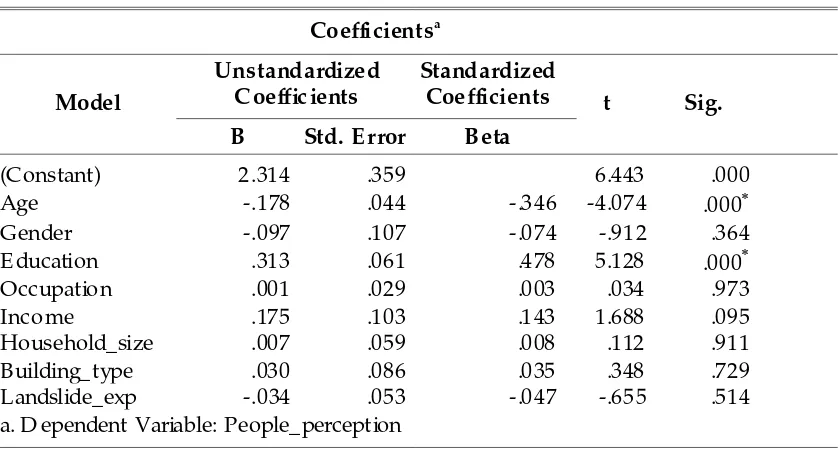
The final output of the multiple linear re-gression analysis is coefficients table. Co-efficients tested the influence of one by one independent variables with the depen-dence factor (the level of people percep-tion) using T-test. The null hypothesis stated that partially the independent variables not have significant influence with the level of people perception (dependent variables). A method for decision-making is done using a probability value (P-value) 0.05. If the signifi-cance value > 0.05, null hypothesis is accepted.
Base on the Table 4 can be seen there are only two variables that have significant influence to the people perception, that are age and education. Findings from this study indicated that two predictor variables, age and education, have a significant influence
Correlations
Independent variable Sig. (1-tailed)
Age .000
Gender .080
E ducation .000
Occupatio n .003
Income .000
household size .048
Building_type .000
Landslide_exp .235
Sumber: primary data analysis
with the variation of local people percep-tion to landslide.
The respond of two significant predictor variable (age and education) to the regres-sion c an b e seen o n the value of Unstandardized Beta Coefficients. Constant coefficient have a positive value (2.314) which states that assuming the absence of predictor variables, the level of people perception tends an increase. Regression coefficient for age variable is negative (-.178), meaning that by assuming the ab-sence of other independent variable, the increasing of age level will be followed by the decline of perception level. The young people tend to have higher level of per-ception than elderly people. Regression coefficient for education variable is posi-tive (.313), meaning that by assuming the absence of other independent variable, the increasing of education level will be fol-lowed by the raise of perception level. The people with high level education tend to have higher level of perception than people who have low level education.
CONCLUSIONS
Community’s perception related with land-slide in Tawangmangu dominated in high and moderate level. Totally, 46% respondents have moderate level of risk perception, 47% have high level and only 6% respondents that have low level. The variables that have a relationship with the perception are age, education, occupation, income, household size and building type. Age and education are two factors that have significant role which influence the level o f lo cal community’s perception to landslide.
ACKNOWLE DGE ME NT
I would like to give my great full thanks to Drs. N.C. (Nanette) Kingma and Dr. C.J. (Cees) van Westen as my excellent super-visors. Great thanks are consigned to all of respondents in Tawangmangu for kind cooperation and comfortable condition during fieldwork in Tawangmangu.
Coefficientsa
Model
Unstandardized Coeffic ients
Standardized
Coefficients t Sig. B Std. E rror Beta
(Constant) 2.314 .359 6.443 .000
Age -.178 .044 -.346 -4.074 .000
Gender -.097 .107 -.074 -.912 .364
E ducation .313 .061 .478 5.128 .000
Occupatio n .001 .029 .003 .034 .973
Income .175 .103 .143 1.688 .095
Household_size .007 .059 .008 .112 .911
Building_type .030 .086 .035 .348 .729
Landslide_exp -.034 .053 -.047 -.655 .514
a. D ependent Variable: People_perception Sumber: primary data analysis
RE FE RE NCE S
Albaum, G. 1997. The L ink ert Scale Revisited: A n A lternate V ersion. Journal of the Market Research Society; Apr 1997; 39, 2; ABI/INFORM Global pg. 331
BNPB (National Disaster Management Agency). 2009. Indonesian Disaster Data and Information. Retrieved 21st May, 2012. http://dibi.bnpb.go.id/
BPS (Centre of Statistic Bureau) of Karanganyar Regency. 2011. Karanganyar dalam angk a 2011. Badan Pusat Statistik Kabupaten Karanganyar
Dai, F.C. Lee, C.F. Ngai, Y.Y. 2002. L andslide Risk A ssessment and Management: A n Overview, E ngineering Geology 64:65–87
Hizbaron, D.R., Hadmoko, D.S., Samodra, G., Dalimunthe, S.A., Sartohadi, J. 2010. Review of Vulnerability, Risk and Rockfall Danger Prone Zoning in Kulonprogo, Yogyakarta. Forum Geografi. Vol 24, No. 2 Dec 2010.
Karnawati, D. Syamsul, M. Teuku, F. Wahyu, W. 2012. Development of Socio-Technical A pproach for L andslide Mitigation and Risk Reduction Program in Indonesia. www.seed-net.org/ download/C1-1_Paper3.pdf. Accessed on 24 January 2013
Prawiradisastra, S. 2008. A nalisis morfologi dan geologi bencana tanah longsor di Desa L edok sari Kabupaten Karanganyar. Jurnal sains dan teknologi Indonesia Vol. 10 No. 2 Agustus 2008 Hlm.84-89
Rianto, T. 2009. Spatial A nalysis of V olcanic Risk Perception Case Study in L ocal Community at Merapi V olcano Dangerous Zones, ITC, International Institute of Geoscience and E arth Observation, MSc Thesis, E nschede, The Netherlands
Sare, M. Y. W. 2009. Tingk at k erentanan dan k apasitas masyarak at lok al terhadap bencana tanah longsor di Kecamatan Kok ap Kabupaten Kulon Progo. Thesis Program Sekolah Pascasarjana Universitas Gadjahmada
Slovic P. 2000. The perception of risk, 1st edn. E arthscan publications Ltd. London. E ngland
Sugiyono. 2007. Metode Penelitian Kuantitatif dan Research Development. Alfabeta, Bandung
Westen, V. N.C. Kingma. 2011. Guide Book Session 7: Disaster Risk Management. Twente University - ITC School on D isaster G eo-information Management. E nschede. Netherland