Change Mitigation
Armi Susandi
Expert Group of Atmospherical Sciences Faculty of Earth Sciences and Technology
Institut Teknologi Bandung, Jl. Ganesa No. 10 Bandung 40132 Indonesia ([email protected])
Abstract:
This paper study on the potential of low-emission energy that can be developed in Indone-sia, which comes from natural resources. This study is considered important as the atten-tion of Indonesia to the increase in carbon emissions from energy and forestry sectors, as well as efforts to mitigate global climate change. Study of low-emission energy potential in this research are to: wind energy, energy mini / micro hydro, solar energy, geothermal energy, and biodiesel energy. Development of low emission energy has not reached the optimal point in the development of energy except the mini / micro hydro, and biodiesel. Development of low-emission energy in the future is expected to reach the target of na-tional energy mix in 2025 through special policy and technology development.
Keyword: national energy mix, low-emission energy, the absorption of carbon emissions, the scenario optimization
I. Introduction
National energy policy aims to guarantee the security of supply (security of sup-ply) of energy in supporting the country's economy which is driving national devel-opment. As a country that many of its in-habitants and have a large area, distribution of development also means equal opportu-nity to obtain suficient energy. One of the national energy development strategy is to increase diversiication of energy with low emissions energy utilization. This is in line with the general policy that prioritizes en-ergy utilization of domestic enen-ergy. While energy exports, especially oil and natural gas still plays an important role as a source of national income for national develop-ment.
Therefore, the development of renewable energy / low emission becomes very im-portant and urgent to continue to be done. In addition to the national energy supply security interests in maintaining the sus-tainability of development, developing low-emission energy will participate took part in mitigating climate change caused by increasing concentrations of carbon dioxide gases in the atmosphere. As it is known that the burning of fossil fuels as the main source of increased concentrations of carbon dioxide (CO2). Therefore, the de-velopment of low emission renewable en-ergy will be worth double for the national economy and global environment.
uti-small. Utilization of low energy emission is still limited commercial geothermal and hydropower. The use of commercial bio -mass, energy bomassa only for household and industrial wood (cogeneration). For that effort to develop alternative energy in Indonesia's energy structure is very impor -tant to continue to be done and developed. Some low-emission energy with the poten -tial to be developed are: (1) wind energy, (2) mini / micro hydro, (3) geothermal, (4) biomass, (5) solar energy, (6) ocean energy. In this paper we will study all the low en -ergy unless the en-ergy of the sea.
This paper will provide an assessment on the low-energy emissions in Indonesia that lace emission mitigation of global climate change with increasing CO2 emissions in the atmosphere. The next section of the paper we will describe the carbon emis -sions from energy and forestry sector of Indonesia. Then on the third section will analyze the government's policy on energy mix by 2025. Furthermore, the fourth part will examine the potential of Indonesia and the emission of low energy absorption ca -pability of carbon will be presented in the next section. Conclusions and future stud -ies into the last part of this paper.
2. Carbon Emissions Projections in Indo -nesia
Indonesia has large reserves of oil, gas, coal and a signiicant moment. Existing gas will be in production until the next 70 years, in the current production level (EUSAI, 2001). Meanwhile, coal will be -come the mainstay of energy for domestic consumption in Indonesia (can be in pro -duction until 500 years into the future in the current production level). Meanwhile, oil energy will only survive in the next 17 years after the year 2000.
Indonesia's energy consumption is domi
-nated by energy from fossil fuels, which is about 3.9 quadrillion British thermal units (BTU) or about 95 percent of total en -ergy consumption in Indonesia (DGEED, 2000). Oil up to now dominate the energy consumption of Indonesia, approximately 56% of the total energy in 2000. Further -more, the gas is consumed by 31% and coal for 8% of total energy consumption in Indonesia (IEA, 2000).
From Indonesia's energy consumption level above, then in year 2000, total CO2 emissions from Indonesia's energy require -ment is equal to 62 million metric tons of carbon, 42% is derived from the energy in -dustry (including power plants), the rate of growth of CO2 from this source is sebesat 7% per year (other sources that an average of 3.3% per year). Furthermore, 25% of the industrial sector, 24% of the transpor -tation sector, and 9% comes from house -hold (SME-ROI, 1996). According to the Merge model, emissions from primary en -ergy consumption in Indonesia amounted to 64 million metric tons of carbon (Figure 2.1). Carbon emissions from energy sec -tor increased substantially until it reaches its peak in 2060, emissions reached about 158 millions metric tons of carbon. Fur -thermore, the role of emission free energy (Susandi, 2004) will dominate the next pe -riod on the market for Indonesian energy to replace fossil energy. At the end of the 21st century, emissions will decline gradu -ally and reach 110 million metric tons of carbon (Figure 2.1).
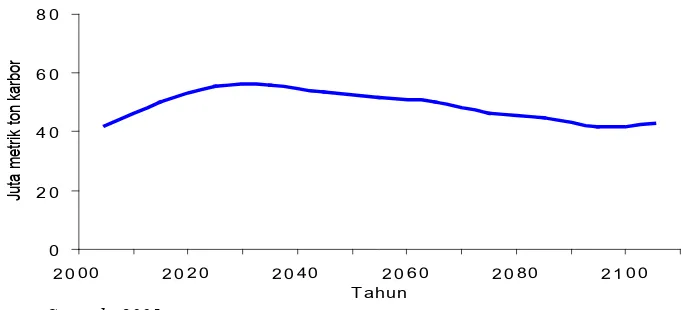
amounted to 42.1 million metric tons of carbon (Figure 2.2). In 2000 the deforesta -tion in Indonesia is estimated at 2.3 million ha per year (Sari et al. 2001). Furthermore, deforestation activities is expected to in
-crease and reached the highest point in the year 2030 carbon emissions by 56 million metric tons. After that carbon emissions from the forestry sector will decrease grad -ually until the year 2100 (Figure 2.2).
0 3 0 6 0 9 0 1 2 0 1 5 0 1 8 0
2 0 0 0 2 0 2 0 2 0 4 0 2 0 6 0 2 0 8 0 2 1 0 0
T a h u n
Ju
ta
me
tri
k
to
n
ka
rb
o
n
Source: Susandi, 2005
Figure 2.1. Projection of carbon emission from energy sector
0 2 0 4 0 6 0 8 0
2 0 00 2 0 2 0 2 0 40 2 0 6 0 2 0 80 2 1 0 0
T ahun
Ju
ta
me
tri
k
to
n
ka
rb
o
n
Figure 2.2. Projection of carbon emission from reforestation Source: Susandi, 2005
3. Energy Potential Low Carbon Emission and Absorption
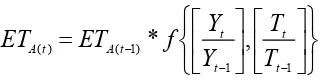
This section will then be assessed and quantiied projections of low energy emis -sion of Indonesia based on two scenarios, ie business as usual scenario (scenario) and the optimization scenario. Optimization
is a function of the value / energy data pre -viously. The approach used was developed with the econometric approach and the de -termination of the size variable using the principle of elasticity.
=
− − − −
1 1 1
1
*
,
,
t t
t t
t t t
t
T
T
Y
Y
P
P
f
ET
ET
(3.1)where;
t
ET
= Production of low-emission energy (ET) in year t1
−
t
ET
= Production of low-emission energy (ET) in year t-1t
P
= Population in the year t1
−
t
P
= Population in the year t-1t
Y
= Economic growth in year t1
−
t
Y
= Economic growth in year t-1t
T
= Improved technology in year t1
−
t
T
= Improved technology in year t-1General equation used in the projection of low-emission energy / renewable energy (ET) is a national, as shown in equation (3.1) the following:
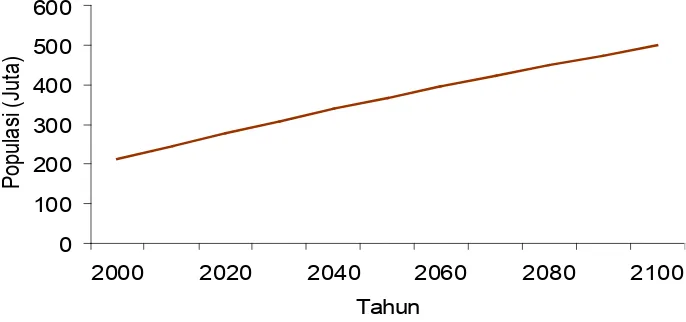
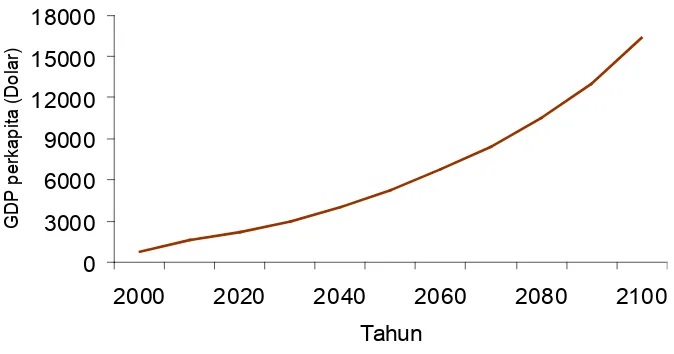
Population growth using the results of the study population and economic growth in Indonesia, which was obtained from the research Susandi (2004), while technol -ogy development is a function of per capita
economic growth in Indonesia. Population, economic development and economic per capita of Indonesia until the year 2100, re -spectively shown in Figure 3.1, Figure 3.2 and Figure 3.3.
0 100 200 300 400 500 600
2000 2020 2040 2060 2080 2100
Tahun
Po
p
u
la
si
(Ju
ta
)
0
1
2
3
4
5
6
7
8
9
2000
2020
2040
2060
2080
2100
Tahun
G
D
P
(T
ri
lyu
n
D
o
la
r)
Figure 3.2. Projections of Economic Growth (GDP) Indonesia Source: Susandi, 2004
0 3000 6000 9000 12000 15000 18000
2000 2020 2040 2060 2080 2100 Tahun
G
D
P
p
e
rka
p
it
a
(D
o
la
r)
Figure 3.3. Projection of Indonesia's GDP per capita Source: Susandi, 2004
Equation (3.1) is used as a general equation for the projection of each low-emission en-ergy of Indonesia, which will be given in detail in the sections below.
3.1. Mini / micro hydropower
be increased as a function of economic growth, then this scenario is referred to as the scenario optimization, so that equation (3.3) becomes:
from the energy mini / micro hydro is the equation (3.2) as follows:
=
− − −
1 1 )
1 ( )
(
*
,
t t t
t t
Mh t
Mh
Y
Y
P
P
f
ET
ET
(3.2)It is assumed that the business de
-velopment of low energy emission from the mini / micro hydro through investment and inancing policies pattern as proposed in this study will
=
− −
1 )
1 ( )
(
*
t t t
Mh t
Mh
Y
Y
f
ET
ET
(3.3)The projection development of low energy
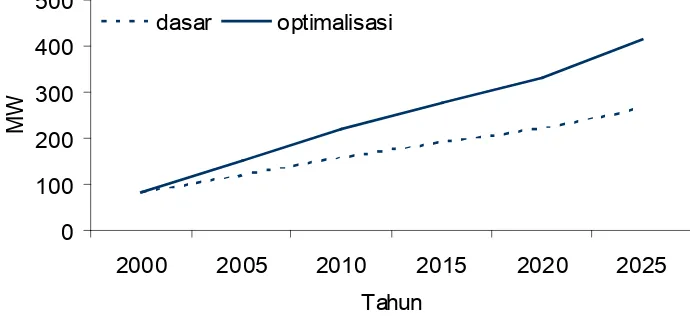
emission from the mini / micro hydro as given in Figure 3.4. follows:
0 100 200 300 400 500
2000 2005 2010 2015 2020 2025
Tahun
MW
dasar optimalisasi
Figure 3.4. Energy Projections Mini / Micro Hydro Association and Optimization Sce -nario
Seen that the energy micro-mini / mi
-cro hydro rise to 264 MW (Off the Grid) or 0.08% of total national energy (target 0.1%) with the basic scenario in 2025 and reached 413 MW (Off the Grid) with the optimization scenario ( exceeding the tar
-get, or 1.25%, while the target in this sce
-nario amounts to 0.216% or a total of 330 MW (Off the Grid)).
3.2. Wind
port from governments is a function of eco
-nomic growth (Y) only, see equation (3.5).
=
− − − 1 1 ) 1 ( ) (*
,
t t t t t A t AT
T
Y
Y
f
ET
ET
(3.4)While for the scenario optimization with the pattern of investment and funding sup
-
=
− − 1 ) 1 ( ) (*
t t t A t AY
Y
f
ET
ET
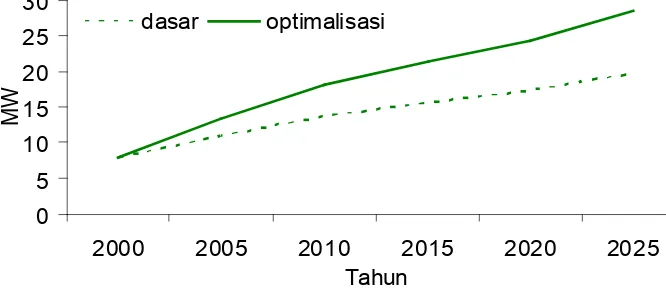
(3.5)Figure 3.5, shows projections for the ba
-sic conditions and optimization of condi
-tions. Shown that wind energy contributes 2.1 MW (Off the Grid) in 2025 on the ba
-sic scenario and reached 2.5 MW (Off the
Grid) in scenario optimization or equal 0.014% lower than the target of 0.028%, amounting to 5 MW (Off grid), see Figure 3.5.
0.0
0.5
1.0
1.5
2.0
2.5
3.0
2000
2005
2010
2015
2020
2025
Tahun
MW
dasar
optimalisasi
Figure 3.5. Projected Wind Energy Association and Optimization Scenario
3.3. Sun
Furthermore, econometric approach to the equation (3.6) will describe the low-energy projections of solar emissions, the function
of the growth of population (P) and techno
-logical development (T).
=
− − − 1 1 ) 1 ( ) (*
,
t t t t t S t ST
T
P
P
f
ET
ET
(3.6)While for the scenario approach was used optimaslisasi technology functions (4.T) that spur the growth of solar energy, as the implications of government funding assis
-tance in the development of this solar ener
tional mix of 28.4 MW, while the target is to reach 0.02% or equal to 80 MW (Figure 3.3).
=
− − 1 ) 1 ( ) (*
t t t S t ST
T
f
ET
ET
(3.7)Figure 3.7 shows the projection of the low energy emissions from solar to the second scenario, by 2025, solar energy will yield 0.007% of the total energy (primary) or
na-0 5 10 15 20 25 30
2000 2005 2010 2015 2020 2025
Tahun
MW
dasar optimalisasi
Figure 3.7. Solar Energy Projections and the Optimizing Primary Scenario 3.4. Biomass
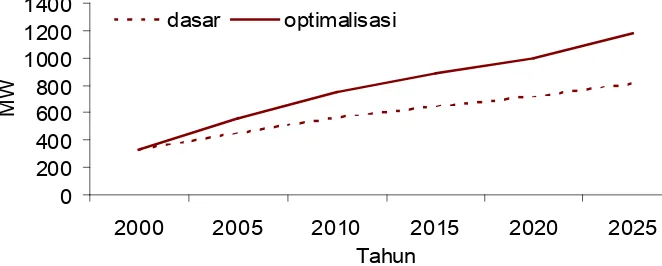
Development of biomass energy is assumed to be berkembangan with the growth of population (P) and increased development
of technology (T) from the biomass itself, therefore equation (3.8) provides projec-tions for future biomass energy is the basic scenario.
=
− − − 1 1 ) 1 ( ) (*
,
t t t t t B t BT
T
P
P
f
ET
ET
(3.8)While for the optimization scenario, the
development of biomass energy described by equation (3.9).
=
− − 1 ) 1 ( ) (*
t t t B t BT
T
f
ET
ET
(3.9)Figure 3.8 shows the second projection scenario. Based on Figure 3.8, shows that the optimal scenario would increase the production of biomass reached 1175 MW
function of economic growth (Y) and tech
-nological development (T), heat the earth itself. Equation (3.10) and (3.11) provide for the basic scenario and the scenario op
-timization. 0
200 400 600 800 1000 1200 1400
2000 2005 2010 2015 2020 2025
Tahun
MW
dasar optimalisasi
Figure 3.8. Biomass Energy Scenario Projections of Primary and Optimization
3.5. Geothermal
Based on an econometric model for the development of geothermal case of Indo
-nesia, it is assumed that the development of geothermal energy in Indonesia is a
=
− − −
1 1 )
1 ( )
(
*
,
t t
t t t
G t
G
T
T
Y
Y
f
ET
ET
(3.10)
=
− −
1 )
1 ( )
(
*
t t t
G t
G
Y
Y
f
ET
ET
(3.11)Figure 3.10 showing projections of geothermal energy in the two scenarios.
0 1000 2000 3000 4000 5000
2000 2005 2010 2015 2020 2025
Tahun
MW
dasar optimalisasi
IEA (International Energy Agency)., 2000. World consumption of primary energy. In
-ternational Energy Annual, World Energy Consumption.
Sari, A et al., 2001. Does money growth on tress? Opportunities and Challenges of Forestry CDM in Indonesia, Pelangi, Ja
-karta.
SME-ROI (State Ministry for Environment, Republic of Indonesia)., 1996. Indonesia: First National Communication under the United Nations Framework Convention on Climate Change, Jakarta.
Susandi, A., 2004: The Impact of Interna
-tional Green House Gas Emmisions Re
-duction on Indonesia. Report on System Science. Max Planck Institute for Meteo
-rology. Hamburg, Jerman.
Susandi, A., 2005. Emisi Karbon dan Po
-tensi CDM dari Sektor Energi dan Kehu
-tanan Indonesia. Jurnal Teknik Lingkun
-gan, ISSN 0854 – 1957, October 2005
Susandi, A., 2006. Indonesia’s Geohermal: Development and CDM Potential.
Seen that the Indonesian geothermal en
-ergy will only reach 3400 MW in the base scenario. While through the optimization of the model scenario shows that geothermal energy will reach 3940 MW, or contribute 1.6% of the total energy mix, lower than the target of 3.8% or a total of 9500 MW (Mineral Resources, 2005), see Figure 3.3 and Figure 3.9.
4. References
DESDM., 2005. Blue Print Kebijakan Pen
-gelolaan Energi Nasional 2005-2025. De
-partemen Energi dan Sumber Daya Min
-eral. Indonesia.
DGEED (Directorate General of Electricity and Energy Development)., 2000: Statistik dan Informasi Ketenagalistrikan dan En
-ergi (Statistics and Information of Electric Power and Energy), Jakarta.
DGEED (Directorate General of Electric
-ity and Energy Development)., 2000. Sta
-tistics and Information of Electric Power and Energy. Jakarta.