Does Stereotype Threat Affect Test Performance of Minorities and
Women? A Meta-Analysis of Experimental Evidence
Hannah-Hanh D. Nguyen
California State University, Long Beach Michigan State University
Ann Marie Ryan
A meta-analysis of stereotype threat effects was conducted and an overall mean effect size of |.26| was found, but true moderator effects existed. A series of hierarchical moderator analyses evidenced differential effects of race- versus gender-based stereotypes. Women experienced smaller performance decrements than did minorities when tests were difficult: meands⫽|.36| and |.43|, respectively. For women, subtle threat-activating cues produced the largest effect,followed by blatant and moderately explicit cues: ds⫽ |.24|, |.18|, and |.17|, respectively; explicit threat-removal strategies were more effective in reducing stereotype threat effects than subtle ones:ds⫽|.14| and |.33|, respectively. For minorities, moderately explicit stereotype threat-activating cues produced the largest effect,followed by blatant and subtle cues:ds⫽|.64|, |.41|, and |.22|, respectively; explicit removal strategies enhanced stereotype threat effects compared with subtle strategies:ds⫽|.80| and |.34|, respectively. In addition, stereotype threat affected moderately math-identified women more severely than highly math-identified women:ds⫽|.52| and |.29|, respectively; low math-identified women suffered the least from stereotype threat:d⫽|.11|. Theoretical and practical implications of these findings are discussed.
Keywords:stereotype threat effects, meta-analysis, cognitive ability test performance, gender gap in math scores, racial gap in test scores
Since Steele and Aronson’s (1995) seminal experiments, the research literature on stereotype threat effects on test performance has steadily grown. According to the theory, stereotype threat refers to the “predicament” in which members of a social group (e.g., African Americans, women) “must deal with the possibility of being judged or treated stereotypically, or of doing something that would confirm the stereotype” (p. 401; Steele & Aronson, 1998). For instance, when stereotyped group members take stan-dardized ability tests, such as in educational admission or employ-ment selection contexts, their performance may be partially under-mined when they encounter cues of a salient negative stereotype in the testing environment (e.g., women are not good at math, or ethnic minorities are inferior in intellectual abilities; Steele, Spen-cer, & Aronson, 2002).
The social message that the theory of stereotype threat conveys is powerful: Members of stigmatized social groups may be con-stantly at risk of underperformance in testing contexts, and the risks may be partially caused by situational factors (i.e., beyond established factors such as poverty, parental style, socialization, etc.; Steele, 1997). For astigmatized social group, we adopt the widely used definition of Crocker and Major (1989): belonging to a social category about which others hold negative attitudes, ste-reotypes, and beliefs. According to Devos and Banaji (2003), the contribution of the stereotype threat theory and literature is that it predicts (and empirically tests) the relationship between negative in-group stereotypes and group members’ behavioral changes (e.g., diminished task or test performance in a stereotyped evalu-ative domain), not only attitudinal or affective changes. The present meta-analytic study aims at investigating the extent to which the activation of stereotype threat is detrimental to stereo-typed test takers’ performance on cognitive ability tests by aggre-gating the findings in stereotype threat experiments. In our pre-sentation, we discuss how the laboratory conditions may or may not generalize to employment testing contexts, and hence whether or not any stereotype threat effects produced in these contexts might occur in field settings of interest to organizational psychol-ogists.
Stereotype Threat: Research Paradigm and Empirical
Evidence
The primary hypothesis of stereotype threat theory is perfor-mance interference, or the prediction that stereotyped individuals perform worse on an evaluative task (e.g., African Americans taking a verbal ability test or women taking a mathematics test) in a stereotype-threatening context than they would in a nonthreat-Hannah-Hanh D. Nguyen, Department of Psychology, California State
University, Long Beach; Ann Marie Ryan, Department of Psychology, Michigan State University.
This article was partly based on Hannah-Hanh D. Nguyen’s dissertation research under Ann Marie Ryan’s supervision. The meta-analysis was supported with Hannah-Hanh D. Nguyen’s National Science Foundation Graduate Research Fellowship and Michigan State University Competitive Doctoral Enrichment Fellowship.
We thank the researchers who generously shared their work and addi-tional statistical data, especially Gregory Walton. We also thank Irene Sze and Emily Harris for their coding assistance, Huy A. Le for his meta-analytic advice, and Linda Jackson, Neal Schmitt, and Ilies Remus for their committee guidance.
Correspondence concerning this article should be addressed to Hannah-Hanh D. Nguyen, Department of Psychology Room 319, California State University, Long Beach, 1250 Bellflower Boulevard, Long Beach, CA 90840. E-mail: hnguyen@csulb.edu
ening condition (see Steele, 1997; Steele et al., 2002). The basic experimental paradigm involves randomly assigning members of a stereotyped group to a control or threat condition and comparing mean performance of the conditions. Researchers sometimes also include a comparison group to whom the induced negative stereo-type is not relevant (e.g., Whites, men). In a seminal experiment, Steele and Aronson (1995; Experiment 1) assigned African Amer-ican students to one of three conditions of stereotype threat where they were administered a difficult verbal ability test (i.e., only 30% of a pretest sample correctly solved the test). In the stereotype threat condition, participants were told that the test was diagnostic of their intellectual capability; in the other conditions, the test was either described as a problem-solving task or no particular direc-tions were given. Participants in the stereotype threat condition correctly solved fewer test problems compared with those in other conditions, supporting the performance interference hypothesis.
A majority of subsequent researchers replicated and extended the stereotype threat effect on cognitive ability tests for African American or Hispanic test takers (e.g., Cadinu, Maass, Frigerio, Impagliazzo, & Latinotti, 2003; Dodge, Williams, & Blanton, 2001) and on difficult math ability tests for female test takers (e.g., Davies, Spencer, Quinn, & Gerhardstein, 2002; Schmader & Johns, 2003; S. J. Spencer, Steele, & Quinn, 1999). However, some researchers did not find support for the performance inter-ference hypothesis (e.g., McFarland, Kemp, Viera, & Odin, 2003; Oswald & Harvey, 2000 –2001; Schneeberger & Williams, 2003; Stricker & Ward, 2004). The mixed findings suggest moderating effects for stereotype threat. Stereotype threat theory does propose three moderators—stereotype relevance, domain identification, and test difficulty—which are described in the next section and investigated in this study.
Conceptual Moderators
Relevance of Stereotypes
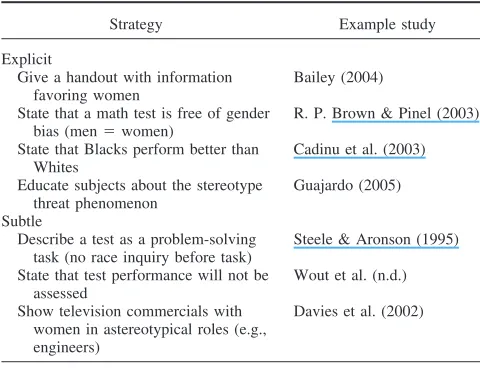
Steele (1997) posited that the degree of stereotype threat effects may vary depending on the relevance of a stereotype in the test setting. For example, Shih, Pittinsky, and Ambady (1999) found that, when encountering a stereotype threat-loaded situation (i.e., taking a math test), Asian American women tended to solve more correct problems when the situational cues about their “Asian” identity were accessible than when their “woman” identity was made salient (mean differences were not statistically significant, however). Researchers can activate stereotype threat by manipu-lating the degree to which a stereotype is salient to individuals in an evaluative testing context by either cuing test takers to the link between a stereotype and a particular evaluative test (i.e., implicit stereotype threat activation) or by declaring that members of a social group tend to perform worse on the test than a comparison group (i.e., explicit stereotype threat activation; see definitions and examples in Table 1).
Stereotype theories in general predict that more implicit threat cues would have a stronger negative effect on task performance than explicit ones (see Bargh, 1997). Explicit stereotype threat cues have been found to cause target test takers to overperform on a test or task (e.g., Kray, Thompson, & Galinsky, 2001; McFar-land, Kemp, et al., 2003), a phenomenon called a stereotype reactance effect.According to Kray et al. (2001), when a negative
stereotype is blatantly and explicitly activated, it might be per-ceived by test takers as a limit to their freedom and ability to perform, thereby ironically invoking behaviors that are inconsis-tent with the stereotype.
The implication is that a nonlinear relationship possibly exists between stereotype threat-activating cues and performance. Stud-ies using subtle stereotype threat-activating cues (i.e., via manip-ulating the testing environment) might produce a larger effect size than those using blatant cues (i.e., via spelling out a stereotype to target test takers) because the stereotype might work on a subcon-scious level and directly affect targets’ test performance (see Levy, 1996). Also, threatened individuals might consciously react against a blatant stereotype. Studies using moderately explicit cues might actually yield the greatest stereotype threat effects: When a general message of subgroup differences in intellectual abilities is explicitly conveyed to target test takers but the direction of these differences is not specified and is instead left open for test takers’ interpretation, the stereotype might be direct enough to draw targets’ attention, ambiguous enough to cause targets to engage in detrimental off-task thinking (e.g., trying to figure out how the message should be interpreted), but not too blatant to make some targets become motivated to “prove it wrong.” This distinction is particularly important to consider if one wishes to determine if laboratory stereotype threat effects generalize to employment test-ing setttest-ings, where blatant or even moderately explicit cues are unlikely to be present. If effects are not found with more subtle cues, then one might question the applicability of this line of research to employment testing contexts.
The relevance between a negative stereotype and a test can also be refuted or removed to reduce observed stereotype threat effects, either implicitly (e.g., by framing a test as a nondiagnostic task) or explicitly (e.g., by disputing said group differences in test perfor-mance; see examples in Table 2). Explicit stereotype threat-removal strategies may serve as a catalyst to motivate individuals to avoid being stereotyped; this motivation can in turn inhibit negative stereotypes by shaping activated thoughts into actions toward their goals (see S. J. Spencer, Fein, Strahan, & Zanna, 2005). In other words, explicitly making a stereotype less relevant to a test context might alleviate stereotype threat effects more effectively than implicit threat-removal strategies. This distinction is also an important one to examine in determining the viability of generalizing stereotype threat lab research to employment testing contexts: Hiring organizations are unlikely to enact the more explicit threat-removal strategies used in this line of research.
In this meta-analysis, we examine the type of stereotype acti-vation cue—subtle, moderately explicit, or blatant—and the type of threat-removal strategy (implicit vs. explicit) as potential mod-erators.
Domain Identification
taking a math test (Cadinu et al., 2003, Study 1). That is, negative stereotypes will not be threatening to individuals who do not care about performing well in an area, as success in that domain plays little role in their identity. Surprisingly, only a few studies directly tested domain identification as a moderator of stereotype threat
effects, and the results were mixed (Aronson et al., 1999; Cadinu et al., 2003; Leyens, Desert, Croizet, & Darcis, 2000; McFarland, Lev-Arey, & Ziegert, 2003). In this meta-analysis, we examined whether levels of individuals’ domain identification might influ-ence the magnitude of stereotype threat effects.
Test Difficulty
Stereotype threat theory suggests that members of a stigmatized social group are most likely to be threatened by a situational stereotype threat cue when a test is challenging. Because the cognitive demands of a difficult test will increase individuals’ mental workload, interference from a stereotype will be cogni-tively more problematic when a test is challenging than when a test does not require as much from the test takers’ resources (Steele & Aronson, 1995; Steele et al., 2002). Some researchers selected highly difficult intellectual ability tests to investigate stereotype threat effects (e.g., Croizet et al., 2004; Gonzales, Blanton, & Williams, 2002; Inzlicht & Ben-Zeev, 2003; McIntyre et al., 2003; Schmader, 2002; Steele & Aronson, 1995), whereas other re-searchers used moderately difficult tests (e.g., Dodge et al., 2001; McKay, Doverspike, Bowen-Hilton, & Martin, 2002; J. L. Smith & White, 2002; Stricker & Ward, 2004). The empirical evidence for the moderating effects of test difficulty is mixed (O’Brien & Crandall, 2003; S. J. Spencer et al., 1999; Stricker & Bejar, 2004). Examining this moderator is also of importance to understanding Table 1
Stereotype Threat-Activating Cues
Cue classification Operational definition Stereotype threat-activating cue Example study
Blatant The message involving a stereotype about a subgroup’s inferiority in cognitive ability and/or ability performance is explicitly conveyed to test takers prior to their taking a cognitive ability test. The group-based negative stereotype becomes salient to test takers via a conscious mechanism.
Emphasizing the target subgroup’s inferiority on tests (or the comparison subgroup’s superiority). For example, stating that Whites tend to perform better than Blacks/ Hispanics or that men tend to score higher than women.
Aronson et al. (1999); Cadinu et al. (2003); Schneeberger & Williams (2003)
Priming targets’ group-based inferiority. For example, administering a stereotype threat questionnaire before tests or giving information favoring males before tests.
Bailey (2004); Seagal (2001)
Moderately explicit The message of subgroup differences in cognitive ability and/or ability perfor-mance is conveyed directly to test takers in test directions or via the test-taking context, but the direction of these group differences is left open for test takers’ interpretation. The group-based negative stereotype may become salient to test takers via a conscious mechanism.
Race/gender performance differences in general ability tests. For example, stating that generally men and women perform differently on standardized math tests.
R. P. Brown & Pinel (2003); Edwards (2004); H. E. S. Rosenthal & Crisp (2006)
Race/gender performance differences on the specific test. For example, stating that taking a specific math test produces gender differences, testing minorities’ math ability on a White-normed or biased test, stating that certain groups of people perform better than others on math exams.
Keller & Dauenheimer (2003); Pellegrini (2005); Tagler (2003)
Indirect and subtle The message of subgroup differences in cognitive ability is not directly conveyed; instead, the context of tests, test takers’ subgroup membership, or test taking experience is manipulated. The group-based negative stereotype may become salient to test takers via an automatic and/or subconscious mechanism.
Race/gender priming. For example, making a race/gender inquiry prior to tests or race/ gender priming by other means (e.g., a pretest questionnaire, a pretest task, a testing environment cue).
Emphasizing test diagnosticity purpose. For example, labeling the test as a diagnostic test or stressing the evaluative nature of the test.
Martin (2004); Marx & Stapel (2006); Ployhart et al. (2003); Prather (2005)
Note. In Walton and Cohen’s (2003) meta-analysis, only two levels of classification were employed.
Table 2
Stereotype Threat-Removal Strategies
Strategy Example study
Explicit
Give a handout with information favoring women
Bailey (2004)
State that a math test is free of gender bias (men⫽women)
R. P. Brown & Pinel (2003)
State that Blacks perform better than Whites
Cadinu et al. (2003)
Educate subjects about the stereotype threat phenomenon
Guajardo (2005)
Subtle
Describe a test as a problem-solving task (no race inquiry before task)
Steele & Aronson (1995)
State that test performance will not be assessed
Wout et al. (n.d.)
Show television commercials with women in astereotypical roles (e.g., engineers)
the potential generalizability of stereotype threat effects from laboratory to employment testing contexts, as employers often seek to use at least moderately difficult tests to increase selectivity.
Type of Stereotype
The theory of stereotype threat alludes to a universal reaction to stereotype threat by members of any stigmatized social group, implying that findings are generalizable from one stigmatized social group to another (see Steele et al., 2002). In this meta-analysis, we tested the viability of this assumption of universal effects by examining whether the activation of stereotype threat might differentially affect women and ethnic minority test takers in testing contexts. Stereotype relevance might differ because in the United States, where group differences are publicly acknowledged and discussed, advances in employment and higher education for minorities are affected by high-stakes testing (Sackett, Schmitt, Ellingson, & Kabin, 2001). However, the effect of math test performance on women’s advancement opportunities is not likely to be as great, given that career opportunities that many women choose are not affected by math scores (see Halpern et al., 2007, for a review). Hence, a race-based stereotype regarding test per-formance might be more salient to test takers, or might lead to stronger reactions, than a gender-based math stereotype.
Prior Meta-Analysis
Although not their primary focus, Walton and Cohen (2003) conducted a meta-analysis on stereotype threat effects experienced by members of several stigmatized groups (e.g., ethnic minorities, women, older adults, individuals of lower socioeconomic status). They found a small overall effect size (meand⫽ |.29|,k⫽ 43),
which was moderated by stereotype relevance and domain identi-fication. Walton and Cohen did not examine test difficulty as a moderator but opted instead to examine only studies that used a difficult test or performance situation. Although Walton and Co-hen’s results on stereotype threat effects are informative, there is room for improvement on their approach. We replicated and ex-tended their work in five ways: (a) examining test difficulty as a moderator, (b) examining differential effects of different group-based stereotypes, (c) using a more fine-grained classification in examining stereotype-activating cues as a moderator, (d) consid-ering nonindependent data points in a more appropriate manner, and (e) including substantially more studies.
First, Walton and Cohen (2003) reported significant heteroge-neity tests of the observed effect sizes for all meta-analytic find-ings, meaning that there were other uninvestigated moderators that may further explain the variance in their findings. Therefore, we extended Walton and Cohen’s work to include test difficulty and type of stereotype as potential moderators. Second, Walton and Cohen meta-analytically cumulated effect sizes from studies with various stereotype threats based on race, gender, age, or socioeco-nomic status and with various outcome measures. In this meta-analysis, we tested the viability of a universal stereotype threat reaction, considering potential differential effects of two types of stereotypes (race and gender) related to test performance.
Third, although Walton and Cohen (2003) did examine whether subtle versus explicit ways of activating and/or attempting to remove stereotype threat manipulations produced differing results,
we extended their work by using a more concretely defined and detailed categorization for both threat activation and threat re-moval to better address generalizability issues to employment contexts. Fourth, Walton and Cohen’s treatment of nonindepen-dent data points was nonstandard: Studies in the data set that yielded hundreds of nonindependent data points each (i.e., identi-cal or overlapping samples on multiple dependent measures; e.g., Stricker, 1998; Stricker & Ward, 1998) were given a weight of 0.5 in the effect size computation, but the reasons and/or implications of such a treatment in regard to the variance estimation of effect sizes (see Hunter & Schmidt, 1990) were neither explained nor discussed. Finally, Walton and Cohen used a small data set of experiments (k⫽ 43) and the literature has grown substantially
since their study. Less than one half of the studies the researchers meta-analyzed are related to the two group-based stereotypes of interest in employment settings, and many additional studies were included in the present meta-analysis.
In summary, to address these five extensions to Walton and Cohen’s (2003) work, we conducted a hierarchical moderator meta-analysis, with each of the stated conceptual moderators—test difficulty, domain identification, and stereotype threat relevance (i.e., activation cues and removal strategies)—meta-analyzed across group-based stereotypes (i.e., race-based vs. gender-based). Furthermore, the primary focus of Walton and Cohen’s meta-analysis was that the variance in observed between-subgroups mean test score differences (e.g., men vs. women, Black/Hispanic vs. White) might be partially accounted for by the debilitated performance of the target group members and partially by the comparison group’s performance boost (stereotype lift). In this study, we directly examined the estimates of such between-group differences in test performance, considering potential differential effects for different stereotypes.
Method
Literature Search
We conducted a bibliographic search of electronic databases such as PsycINFO and PROQUEST using the combined keywords ofstereotypeand threatas search parameters for journal articles and dissertation abstracts dated between 1995 (the publication year of the seminal article by Steele and Aronson) and April 2006. A manual search was conducted by reviewing the reference lists of key articles to find additional citations of unpublished articles. The internet search engines of Google and Google Scholar were used to search for unpublished empirical articles of interest and/or for self-identified stereotype threat researchers. We sent the identified researchers with available e-mail addresses a “cold” e-mail, re-questing manuscripts and/or working papers. We also posted the same request on various psychology list-servs. Furthermore, sev-eral prominent researchers in the stereotype threat area were con-tacted for unpublished manuscripts, in-press papers, as well as for other additional sources of research data on stereotype threat effects on cognitive ability test performance.
Inclusion Criteria
within-subgroup performance interference hypothesis regarding stereotyped minorities’ or women’s cognitive ability test perfor-mance (quantitative, verbal, analytic, and/or nonverbal intelli-gence). Empirical studies that drew inferences from the theory of stereotype threat but were correlational or based on a different research framework were excluded (e.g., Ben-Zeev, Fein, & Inz-licht, 2005; Chung-Herrera, Ehrhart, Ehrhart, Hattrup, & Solamon, 2005; Cullen, Hardison, & Sackett, 2004; Good, Aronson, & Inzlicht, 2003; Inzlicht & Ben-Zeev, 2000, 2003; Osborne, 2001a, 2001b; Roberson, Deitch, Brief, & Block, 2003).
Second, a report had to operationalize test performance as the number of correct answers. (For studies that used a different index of performance, such as a ratio of correct answers to attempted problems, we converted these indexes from available reported information or contacted study authors for the information.) Third, an article had to yield precise statistics that were convertible to a weighted effect size d (e.g., mean test performance differences between women in a stereotype threat condition and those in a control condition). Finally, a report had to be written in English or could be translated into English.
Summary of the Meta-Analytic Data Set
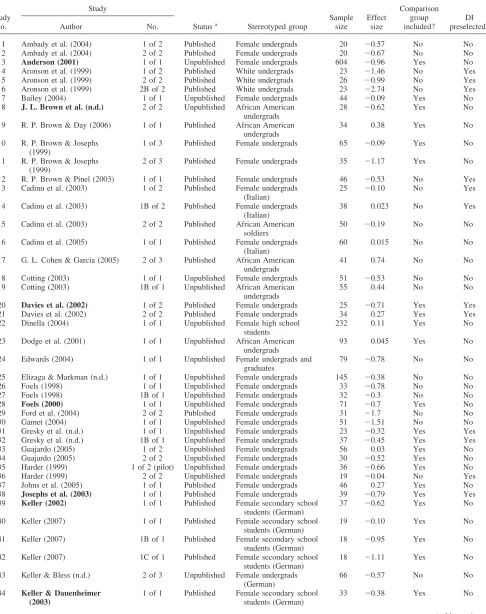
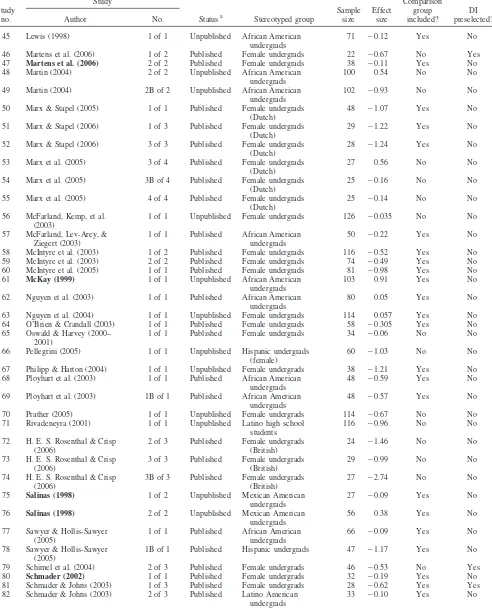
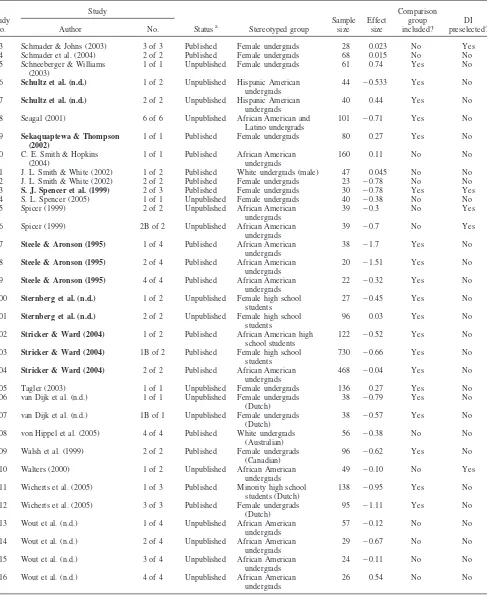
The literature search initially identified a total of 151 published and unpublished empirical reports on stereotype threat effects. Of these reports, 75 were excluded because they did not meet one or more inclusion criteria.1
The remaining 76 reports contained 116 primary studies; 67 of which were from published peer-reviewed articles, and 65 of which included a comparison sample (e.g., Whites or men). The study database yielded a total of 8,277 data points from stereo-typed groups and a total of 6,789 data points from comparison groups. Table 3 presents an overview of the characteristics of studies included in the full data set. Note that of the 43 primary studies in Walton and Cohen’s (2003) meta-analysis, there were only 24 studies overlapping with our data set. In other words, about 79% of our data set (ork⫽92) was nonoverlapping with that
in Walton and Cohen’s meta-analysis.
Treatment of Independent Data Points
When an article consisted of multiple single studies, we treated each study as an independent source of effect size estimates. When a single study included a fully replicated design across demo-graphic subgroups (i.e., a conceptually equivalent but statistically independent design), we treated the data as if they were values from different studies. For example, means of cognitive ability test scores from all ethnic subgroups (e.g., Hispanic Americans and African Americans; Sawyer & Hollis-Sawyer, 2005) were statis-tically independent.
Treatment of Nonindependent Data Points
To be sensitive to potential problems caused by nonindependent data, for the eight studies with multiple measures of cognitive ability in our data set, we used only one independent estimate of effect size per study (i.e., an average effect size across cognitive ability tests for all subsamples per study). Nonindependent data points also occurred when the design of an experiment allowed for
multiple effect size estimates to be computed across study condi-tions. For example, the research design of 14 studies in our data set consisted of one stereotype threat-activated condition and at least two or more stereotype threat-removed conditions and vice versa, resulting in multiple mean effect estimates per study. Following Webb and Sheeran’s (2006) practice, we used the largest mean effect size estimate.
Treatment of Studies With a Control Condition
A nonexperimental (control) condition was defined as when a cognitive ability test was administered to test takers without any special directions. When a study design consisted of two conditions of stereotype threat manipulation (i.e., stereotype threat-activation, or STA, vs. stereotype threat-removal, or STR), the study contributed one effect size, dSTA-STR, to the data set. When a study design
consisted of STA and control conditions, the study contributed one effect size,dSTA-Control. When all three conditions (STA, STR,
con-trol) were present in a study, the effect sizedSTA-STRwas chosen to
be cumulated. Although this approach might result in an upward bias in interpreting the magnitude of stereotype threat effects across studies (i.e., an estimate ofdSTA-STRmight be larger than that ofdSTA-Control),
we erred on optimizing the probability of detecting stereotype threat effects and supporting the theory tenets, given the important social implications of stereotype threat.
Treatment of Studies With Stereotype Threat
⫻
Moderator Designs
For primary studies employing either the design of Stereotype Threat ⫻ Domain Identification or Stereotype Threat ⫻ Test
Difficulty (e.g., Anderson, 2001), we split these studies into two or three independent subsamples according to the levels of domain identification or test difficulty as defined by the researchers them-selves. Each subsample contributed an independent estimate of effect size to the database. For studies with a Stereotype Threat⫻
Nontarget Moderator design (i.e., a moderating factor not investi-gated in the present meta-analysis), we gathered relevant statistical information across the stereotype threat conditions only.2
Treatment of Studies Where Gender Was Nested in Race
Schmader and Johns (2003, Study 2) and Stricker and Ward (2004, Study 2) conducted studies where test takers’ gender was nested within race/ethnicity subgroups (i.e., White men/women vs. Latinos/Latinas vs. African American men/women). Because these
1The list of all excluded studies and reasons for exclusion is available
from Hannah-Hanh D. Nguyen upon request.
2An exception was Keller’s (2007) experiment, involving both domain
Table 3
Overview of the Meta-Analysis Database: Characteristics of Included Studies (K⫽116)
Study no.
Study
Statusa Stereotyped group
Sample size
Effect size
Comparison group included?
DI preselected?
Author No.
1 Ambady et al. (2004) 1 of 2 Published Female undergrads 20 ⫺0.57 No No
2 Ambady et al. (2004) 2 of 2 Published Female undergrads 20 ⫺0.67 No No
3 Anderson (2001) 1 of 1 Unpublished Female undergrads 604 ⫺0.96 Yes No
4 Aronson et al. (1999) 1 of 2 Published White undergrads 23 ⫺1.46 No Yes
5 Aronson et al. (1999) 2 of 2 Published White undergrads 26 ⫺0.99 No Yes
6 Aronson et al. (1999) 2B of 2 Published White undergrads 23 ⫺2.74 No Yes
7 Bailey (2004) 1 of 1 Unpublished Female undergrads 44 ⫺0.09 Yes No
8 J. L. Brown et al. (n.d.) 2 of 2 Unpublished African American undergrads
28 ⫺0.62 Yes No
9 R. P. Brown & Day (2006) 1 of 1 Published African American undergrads
34 0.38 Yes No
10 R. P. Brown & Josephs (1999)
1 of 3 Published Female undergrads 65 ⫺0.09 Yes No
11 R. P. Brown & Josephs (1999)
2 of 3 Published Female undergrads 35 ⫺1.17 Yes No
12 R. P. Brown & Pinel (2003) 1 of 1 Published Female undergrads 46 ⫺0.53 No Yes 13 Cadinu et al. (2003) 1 of 2 Published Female undergrads
(Italian)
25 ⫺0.10 No Yes
14 Cadinu et al. (2003) 1B of 2 Published Female undergrads (Italian)
38 0.023 No Yes
15 Cadinu et al. (2003) 2 of 2 Published African American soldiers
50 ⫺0.19 No No
16 Cadinu et al. (2005) 1 of 1 Published Female undergrads (Italian)
60 0.015 No No
17 G. L. Cohen & Garcia (2005) 2 of 3 Published African American undergrads
41 0.74 No No
18 Cotting (2003) 1 of 1 Unpublished Female undergrads 51 ⫺0.53 No No
19 Cotting (2003) 1B of 1 Unpublished African American undergrads
55 0.44 No No
20 Davies et al. (2002) 1 of 2 Published Female undergrads 25 ⫺0.71 Yes Yes
21 Davies et al. (2002) 2 of 2 Published Female undergrads 34 0.27 Yes Yes
22 Dinella (2004) 1 of 1 Unpublished Female high school students
232 0.11 Yes No
23 Dodge et al. (2001) 1 of 1 Unpublished African American undergrads
93 0.045 Yes No
24 Edwards (2004) 1 of 1 Unpublished Female undergrads and graduates
79 ⫺0.78 No No
25 Elizaga & Markman (n.d.) 1 of 1 Unpublished Female undergrads 145 ⫺0.38 No No
26 Foels (1998) 1 of 1 Unpublished Female undergrads 33 ⫺0.78 No No
27 Foels (1998) 1B of 1 Unpublished Female undergrads 32 ⫺0.3 No No
28 Foels (2000) 1 of 1 Unpublished Female undergrads 71 ⫺0.7 Yes No
29 Ford et al. (2004) 2 of 2 Published Female undergrads 31 ⫺1.7 No No
30 Gamet (2004) 1 of 1 Unpublished Female undergrads 51 ⫺1.51 No No
31 Gresky et al. (n.d.) 1 of 1 Unpublished Female undergrads 23 ⫺0.32 Yes Yes
32 Gresky et al. (n.d.) 1B of 1 Unpublished Female undergrads 37 ⫺0.45 Yes Yes
33 Guajardo (2005) 1 of 2 Unpublished Female undergrads 56 0.03 Yes No
34 Guajardo (2005) 2 of 2 Unpublished Female undergrads 30 ⫺0.52 Yes No
35 Harder (1999) 1 of 2 (pilot) Unpublished Female undergrads 36 ⫺0.66 Yes No
36 Harder (1999) 2 of 2 Unpublished Female undergrads 19 ⫺0.04 No Yes
37 Johns et al. (2005) 1 of 1 Published Female undergrads 46 0.27 Yes No
38 Josephs et al. (2003) 1 of 1 Published Female undergrads 39 ⫺0.79 Yes Yes 39 Keller (2002) 1 of 1 Published Female secondary school
students (German)
37 ⫺0.62 Yes No
40 Keller (2007) 1 of 1 Published Female secondary school students (German)
19 ⫺0.10 Yes No
41 Keller (2007) 1B of 1 Published Female secondary school students (German)
18 ⫺0.95 Yes No
42 Keller (2007) 1C of 1 Published Female secondary school students (German)
18 ⫺1.11 Yes No
43 Keller & Bless (n.d.) 2 of 3 Unpublished Female undergrads (German)
66 ⫺0.57 No No
44 Keller & Dauenheimer (2003)
1 of 1 Published Female secondary school students (German)
33 ⫺0.38 Yes No
Table 3 (Continued)
Study no.
Study
Statusa Stereotyped group
Sample size
Effect size
Comparison group included?
DI preselected?
Author No.
45 Lewis (1998) 1 of 1 Unpublished African American undergrads
71 ⫺0.12 Yes No
46 Martens et al. (2006) 1 of 2 Published Female undergrads 22 ⫺0.67 No Yes
47 Martens et al. (2006) 2 of 2 Published Female undergrads 38 ⫺0.11 Yes No 48 Martin (2004) 2 of 2 Unpublished African American
undergrads
100 0.54 No No
49 Martin (2004) 2B of 2 Unpublished African American undergrads
102 ⫺0.93 No No
50 Marx & Stapel (2005) 1 of 1 Published Female undergrads (Dutch)
48 ⫺1.07 Yes No
51 Marx & Stapel (2006) 1 of 3 Published Female undergrads (Dutch)
29 ⫺1.22 Yes No
52 Marx & Stapel (2006) 3 of 3 Published Female undergrads (Dutch)
28 ⫺1.24 Yes No
53 Marx et al. (2005) 3 of 4 Published Female undergrads (Dutch)
27 0.56 No No
54 Marx et al. (2005) 3B of 4 Published Female undergrads (Dutch)
25 ⫺0.16 No No
55 Marx et al. (2005) 4 of 4 Published Female undergrads (Dutch)
25 ⫺0.14 No No
56 McFarland, Kemp, et al. (2003)
1 of 1 Unpublished Female undergrads 126 ⫺0.035 No No
57 McFarland, Lev-Arey, & Ziegert (2003)
1 of 1 Published African American undergrads
50 ⫺0.22 Yes No
58 McIntyre et al. (2003) 1 of 2 Published Female undergrads 116 ⫺0.52 Yes No
59 McIntyre et al. (2003) 2 of 2 Published Female undergrads 74 ⫺0.49 Yes No
60 McIntyre et al. (2005) 1 of 1 Published Female undergrads 81 ⫺0.98 Yes No
61 McKay (1999) 1 of 1 Unpublished African American undergrads
103 0.91 Yes No
62 Nguyen et al. (2003) 1 of 1 Published African American undergrads
80 0.05 Yes No
63 Nguyen et al. (2004) 1 of 1 Unpublished Female undergrads 114 0.057 Yes No
64 O’Brien & Crandall (2003) 1 of 1 Published Female undergrads 58 ⫺0.305 Yes No 65 Oswald & Harvey (2000–
2001)
1 of 1 Published Female undergrads 34 ⫺0.06 No No
66 Pellegrini (2005) 1 of 1 Unpublished Hispanic undergrads (female)
60 ⫺1.03 No No
67 Philipp & Harton (2004) 1 of 1 Unpublished Female undergrads 38 ⫺1.21 Yes No 68 Ployhart et al. (2003) 1 of 1 Published African American
undergrads
48 ⫺0.59 Yes No
69 Ployhart et al. (2003) 1B of 1 Published African American undergrads
48 ⫺0.57 Yes No
70 Prather (2005) 1 of 1 Unpublished Female undergrads 114 ⫺0.67 No No
71 Rivadeneyra (2001) 1 of 1 Unpublished Latino high school students
116 ⫺0.96 No No
72 H. E. S. Rosenthal & Crisp (2006)
2 of 3 Published Female undergrads (British)
24 ⫺1.46 No No
73 H. E. S. Rosenthal & Crisp (2006)
3 of 3 Published Female undergrads (British)
29 ⫺0.99 No No
74 H. E. S. Rosenthal & Crisp (2006)
3B of 3 Published Female undergrads (British)
27 ⫺2.74 No No
75 Salinas (1998) 1 of 2 Unpublished Mexican American undergrads
27 ⫺0.09 Yes No
76 Salinas (1998) 2 of 2 Unpublished Mexican American undergrads
56 0.38 Yes No
77 Sawyer & Hollis-Sawyer (2005)
1 of 1 Published African American undergrads
66 ⫺0.09 Yes No
78 Sawyer & Hollis-Sawyer (2005)
1B of 1 Published Hispanic undergrads 47 ⫺1.17 Yes No
79 Schimel et al. (2004) 2 of 3 Published Female undergrads 46 ⫺0.53 No Yes
80 Schmader (2002) 1 of 1 Published Female undergrads 32 ⫺0.19 Yes No
81 Schmader & Johns (2003) 1 of 3 Published Female undergrads 28 ⫺0.62 Yes Yes 82 Schmader & Johns (2003) 2 of 3 Published Latino American
undergrads
Table 3 (Continued)
Study no.
Study
Statusa Stereotyped group
Sample size
Effect size
Comparison group included?
DI preselected?
Author No.
83 Schmader & Johns (2003) 3 of 3 Published Female undergrads 28 0.023 No Yes
84 Schmader et al. (2004) 2 of 2 Published Female undergrads 68 0.015 No No
85 Schneeberger & Williams (2003)
1 of 1 Unpublished Female undergrads 61 0.74 Yes No
86 Schultz et al. (n.d.) 1 of 2 Unpublished Hispanic American undergrads
44 ⫺0.533 Yes No
87 Schultz et al. (n.d.) 2 of 2 Unpublished Hispanic American undergrads
40 0.44 Yes No
88 Seagal (2001) 6 of 6 Unpublished African American and Latino undergrads
101 ⫺0.71 Yes No
89 Sekaquaptewa & Thompson (2002)
1 of 1 Published Female undergrads 80 0.27 Yes No
90 C. E. Smith & Hopkins (2004)
1 of 1 Published African American undergrads
160 0.11 No No
91 J. L. Smith & White (2002) 1 of 2 Published White undergrads (male) 47 0.045 No No 92 J. L. Smith & White (2002) 2 of 2 Published Female undergrads 23 ⫺0.78 No No 93 S. J. Spencer et al. (1999) 2 of 3 Published Female undergrads 30 ⫺0.78 Yes Yes
94 S. L. Spencer (2005) 1 of 1 Unpublished Female undergrads 40 ⫺0.38 No No
95 Spicer (1999) 2 of 2 Unpublished African American undergrads
39 ⫺0.3 No Yes
96 Spicer (1999) 2B of 2 Unpublished African American undergrads
39 ⫺0.7 No Yes
97 Steele & Aronson (1995) 1 of 4 Published African American undergrads
38 ⫺1.7 Yes No
98 Steele & Aronson (1995) 2 of 4 Published African American undergrads
20 ⫺1.51 Yes No
99 Steele & Aronson (1995) 4 of 4 Published African American undergrads
22 ⫺0.32 Yes No
100 Sternberg et al. (n.d.) 1 of 2 Unpublished Female high school students
27 ⫺0.45 Yes No
101 Sternberg et al. (n.d.) 2 of 2 Unpublished Female high school students
96 0.03 Yes No
102 Stricker & Ward (2004) 1 of 2 Published African American high school students
122 ⫺0.52 Yes No
103 Stricker & Ward (2004) 1B of 2 Published Female high school students
730 ⫺0.66 Yes No
104 Stricker & Ward (2004) 2 of 2 Published African American undergrads
468 ⫺0.04 Yes No
105 Tagler (2003) 1 of 1 Unpublished Female undergrads 136 0.27 Yes No
106 van Dijk et al. (n.d.) 1 of 1 Unpublished Female undergrads (Dutch)
38 ⫺0.79 Yes No
107 van Dijk et al. (n.d.) 1B of 1 Unpublished Female undergrads (Dutch)
38 ⫺0.57 Yes No
108 von Hippel et al. (2005) 4 of 4 Published White undergrads (Australian)
56 ⫺0.38 No No
109 Walsh et al. (1999) 2 of 2 Published Female undergrads (Canadian)
96 ⫺0.62 Yes No
110 Walters (2000) 1 of 2 Unpublished African American undergrads
49 ⫺0.10 No Yes
111 Wicherts et al. (2005) 1 of 3 Published Minority high school students (Dutch)
138 ⫺0.95 Yes No
112 Wicherts et al. (2005) 3 of 3 Published Female undergrads (Dutch)
95 ⫺1.11 Yes No
113 Wout et al. (n.d.) 1 of 4 Unpublished African American undergrads
57 ⫺0.12 No No
114 Wout et al. (n.d.) 2 of 4 Unpublished African American undergrads
29 ⫺0.67 No No
115 Wout et al. (n.d.) 3 of 4 Unpublished African American undergrads
24 ⫺0.11 No No
116 Wout et al. (n.d.) 4 of 4 Unpublished African American undergrads
26 0.54 No No
Note. Studies presented in bold font (k⫽24) are those that overlap with Walton and Cohen’s (2003) data set. DI⫽domain identification.
aPublished articles are those that appeared in peer-reviewed journal articles, including those in press; unpublished articles refer to dissertations, theses,
studies mainly aimed at examining race-based stereotype threat effects, only the effect sizes as a function of race/ethnicity and stereotype threat activation contributed data points to the overall meta-analytic data set.3
Treatment of Studies With Large Sample Sizes
There were a few studies with substantially larger sample sizes than those in the majority of other studies in the meta-analysis (e.g., Anderson, 2001; Stricker & Ward, 2004, Studies 1 and 2). Meta-analytic results with and without the estimates of effect sizes from these studies were similar so we report findings including all studies.4
Coding of Studies
We coded levels of test difficulty (e.g., difficult, easy) and domain identification based on investigators’ description and/or evidence in source reports. When test takers’ domain identification was on a continuous scale in some reports (e.g., Bailey, 2004; Edwards, 2004; Ployhart, Ziegert, & McFarland, 2003), we did not find sufficient statistical information to convert the data into cat-egorical subgroup data.
For the type of stereotype threat-activation cues, we coded the data on three levels: blatant, moderately explicit, and subtle (see Table 1). A similar coding practice was used for the moderator of stereotype threat-removal strategies (see Table 2). We coded the condition of a cognitive ability test without any special directions as a control condition, following Fisher’s (1925) definitions of research groups.
Studies were also coded for demographic characteristics of samples, such as whether the stereotype activated was based on race or gender. Because stereotype threat manipulation and test takers’ race/ethnicity or gender were correlated in many studies, a series of hierarchical moderator analyses was needed to assess the potential impact of confounding on the moderator analyses. To accomplish this, we first broke down the stereotype threat effect estimates for manipulation conditions by test takers’ race/ethnicity or by gender, and then we undertook a moderator analysis by the race/ethnicity of test takers (minorities vs. Whites) or by gender (women vs. men) within the stereotype threat manipulation con-ditions.
Coders and Agreement
Three coders (Hannah-Hanh D. Nguyen and two trained assis-tants) coded target variables; each study was coded by at least two coders and periodically cross-checked. Objective statistics and continuous variables coded include sample size, variable cell means and standard deviations,t-test values, and/orF-test values. When there was insufficient statistical information to compute the estimate of effect size for a study, coders tried to contact source authors for additional information before marking the data as missing. The interrater agreement rates for continuous and objec-tive variables were between 91% and 100%; disagreements were discussed and resolved. For categorical variables, we computed a series of interrater agreement index kappas following Landis and Koch’s (1977) rules. Kappa values ranged from 0.49 to 0.95, indicating moderately good to very satisfactory interrater
agree-ment levels. The lower kappa values were associated mainly with the classification of stereotype threat conditions given how re-searchers might differ in labeling these conditions in the primary studies (e.g., an STR condition might be referred to as a control group). Disagreements were discussed and resolved.
Meta-Analytic Procedure
We employed the meta-analysis procedure of Hunter and Schmidt (1990, 2004) and conducted an overall meta-analysis to cumulate findings across studies, as well as conducting separate meta-analyses with subsets of studies to examine moderator ef-fects. Specifically, we cumulated the average population effect size␦(corrected for measurement error) and computed variance
var(␦) across studies, weighted by sample size, using the
Meta-Analysis of d-Values Using Artifact Distributions software pro-gram (Schmidt & Le, 2005).
We converted descriptive statistics, t-test estimates, or F-test estimates into the effect size Cohen’s d (i.e., mean difference between cell means in standard score form) using Thalheimer and Cook’s (2002) software program, which was based on Rosnow and Rosenthal’s (1996) and Rosnow, Rosenthal, and Rubin’s (2000) formulas. Reliability information on cognitive ability tests was sporadically reported in the source reports; therefore, study effect sizes could not be corrected individually for measurement error; we used artifact distributions instead.
Following Hunter and Schmidt’s (1990, 2004) recommendation, to judge whether substantial variation due to moderators exists, we used the standard deviation,SD␦, estimated from var(␦) to
con-struct the 90% credibility intervals (CrI) around␦as an index of
true variance due to moderators (Whitener, 1990). When the credibility intervals were large (e.g., greater than 0.11; Koslowsky & Sagie, 1993) and overlapped zero, we interpreted them as indicating the presence of true moderators and inconclusive meta-analytic findings. V%, or the ratio of sampling error variance to the observed variance in the corrected effect size, was also calculated. When most of the observed variance is due to sampling error (i.e., V% ⬎75%), it is less likely that a true moderator exists and
explains the observed variance in effect sizes. Following recent meta-analytic practices (e.g., Roth, Bobko, & McFarland, 2005; Zhao & Seibert, 2006), we also reported 95% confidence intervals (CI; the likely amount of error in an estimate of a single value of mean effect size due to sampling error) in our meta-analyses. The interpretation of 95% CI excluding zero means that we can be 95% confident that mean␦is not zero.
3Stricker and Ward (2004, Study 1) was an exception to this rule, as the
stereotype threat cues were both race-based and gender-based (i.e., race and gender inquiries prior to tests). Therefore, it was conceptually sound to code the outcomes of this study separately as a function of race or gender; that means the study contributed some nonindependent estimates of effect size to the data set. However, the proportion of these nonindependent data points was not large in the data set (i.e., 842 data points altogether, or 10.7%).
4The results from meta-analytic data sets without large sample-size
Testing for Publication Bias
Our meta-analysis database consisted of a relatively balanced number of published and unpublished reports (54.8% and 45.2%, respectively). Nevertheless, fail-safeNanalyses were conducted to test a potential file-drawer bias in each meta-analysis. Hunter and Schmidt (1990) provided a formula to calculate fail-safeN, which indicates the number of missing studies with zero-effect size that would have to exist to bring the mean effect size down to a specific level. In the present review, mean dcritical was arbitrarily set to 0.10, which constitutes a negligible effect size (see J. Cohen, 1988). In the interest of space, we discussed file-drawer analyses only where potential problems were indicated.
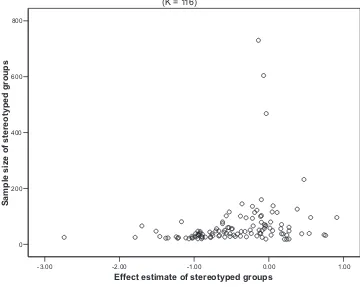
Additionally, we used Light and Pillemer’s (1984) “funnel graph” technique of plotting sample sizes versus effect sizes. In the absence of bias, the plot should resemble a symmetrical inverted funnel. There may be a problem of publication bias when there is a cutoff of small effects for studies with a small sample size. In other words, because only large effects reach statistical signifi-cance in small samples, a publication bias or other types of location biases are present when only large effects are reported by studies with a small sample size (i.e., an asymmetrical and skewed shape). On the contrary, there are no biases if an exclusion of null results is not visible on the funnel graph.
Results
Within-Group Stereotype Threat Effects
Overall effect. Tables 4 and 5 present the results of our hier-archical moderating meta-analyses. The overall effect size was mean d⫽ |.26| (K ⫽ 116,N⫽ 7,964; see Table 4), which was
comparable to the finding of meand⫽|.29| in Walton and Cohen’s
(2003) study. However, the variance of effect sizes was nonzero (V% was about 26%) and the CrI shows that there was a 90% probability that the true effect size was between ⫺0.85 and
0.29 —a range ofdvalues overlapping zero. These values indicate that true moderators existed.
Group-based stereotypes. We separately analyzed the mean effect sizes for studies with an ethnic/racial group-based stereotype of intellectual inferiority and studies with a gender-based stereo-type of mathematical ability inferiority, something not considered in Walton and Cohen (2003). Lines 3 and 4 in Table 4 show differential stereotype threat effects in that the mean effect size was greater in the ethnicity/race-based stereotype subset than in the gender-based stereotype subset (mean ds ⫽ |.32| and |.21|,
respectively). The nonoverlapping 95% CIs indicate reliable ef-fects. Although the subset variance values decreased compared with the variance of the entire set of d values, they were still
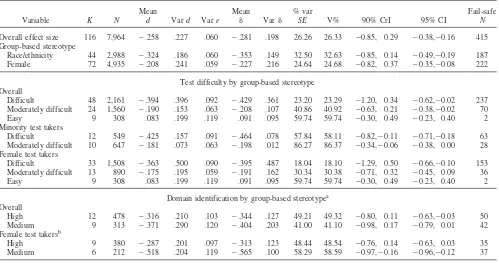
Table 4
Hierarchical Moderator Analyses of Domain Identification and Test Difficulty
Variable K N
Mean
d Vard Vare Mean
␦ Var␦
% var
SE V% 90% CrI 95% CI
Fail-safe N
Overall effect size 116 7,964 ⫺.258 .227 .060 ⫺.281 .198 26.26 26.33 ⫺0.85, 0.29 ⫺0.38,⫺0.16 415 Group-based stereotype
Race/ethnicity 44 2,988 ⫺.324 .186 .060 ⫺.353 .149 32.50 32.63 ⫺0.85, 0.14 ⫺0.49,⫺0.19 187 Female 72 4,935 ⫺.208 .241 .059 ⫺.227 .216 24.64 24.68 ⫺0.82, 0.37 ⫺0.35,⫺0.08 222
Test difficulty by group-based stereotype Overall
Difficult 48 2,161 ⫺.394 .396 .092 ⫺.429 .361 23.20 23.29 ⫺1.20, 0.34 ⫺0.62,⫺0.02 237 Moderately difficult 24 1,560 ⫺.190 .153 .063 ⫺.208 .107 40.86 40.92 ⫺0.63, 0.21 ⫺0.38,⫺0.02 70
Easy 9 308 .083 .199 .119 .091 .095 59.74 59.74 ⫺0.30, 0.49 ⫺0.23, 0.40 2
Minority test takers
Difficult 12 549 ⫺.425 .157 .091 ⫺.464 .078 57.84 58.11 ⫺0.82,⫺0.11 ⫺0.71,⫺0.18 63 Moderately difficult 10 647 ⫺.181 .073 .063 ⫺.198 .012 86.27 86.37 ⫺0.34,⫺0.06 ⫺0.38, 0.00 28 Female test takers
Difficult 33 1,508 ⫺.363 .500 .090 ⫺.395 .487 18.04 18.10 ⫺1.29, 0.50 ⫺0.66,⫺0.10 153 Moderately difficult 13 890 ⫺.175 .195 .059 ⫺.191 .162 30.34 30.38 ⫺0.71, 0.32 ⫺0.45, 0.09 36
Easy 9 308 .083 .199 .119 .091 .095 59.74 59.74 ⫺0.30, 0.49 ⫺0.23, 0.40 2
Domain identification by group-based stereotypea
Overall
High 12 478 ⫺.316 .210 .103 ⫺.344 .127 49.21 49.32 ⫺0.80, 0.11 ⫺0.63,⫺0.03 50 Medium 9 313 ⫺.371 .290 .120 ⫺.404 .203 41.00 41.10 ⫺0.98, 0.17 ⫺0.79, 0.01 42 Female test takersb
High 9 380 ⫺.287 .201 .097 ⫺.313 .123 48.44 48.54 ⫺0.76, 0.14 ⫺0.63, 0.03 35
Medium 6 212 ⫺.518 .204 .119 ⫺.565 .100 58.29 58.59 ⫺0.97,⫺0.16 ⫺0.96,⫺0.12 37
Note. K⫽Number of effect sizes (dvalues);N⫽total sample size; meand⫽sample size weighted mean effect size; vard⫽sample size weighted observed variance ofdvalues; vare⫽variance attributed to sampling error variance; mean␦ ⫽mean true effect size; var␦ ⫽true variance of effect sizes; % varSE⫽percent variance in observeddvalues due to sampling error variance; V%⫽percent variance accounted for in observeddvalues due to all corrected artifacts; 90% CrI⫽90% of mean␦(credibility interval); 95% CI⫽95% of mean␦(confidence interval); fail-safeN⫽number of missing studies averaging null findings that would be needed to bring meanddown to .10, from Hunter and Schmidt’s (1990) effect size file-drawer analysis.
aDomain identification levels:High⫽strongly identified with academic or cognitive ability domains;Medium⫽moderately identified. bOnly the
nonzero. There was a 90% probability that the true mean effect size of the race-based subset was between a zero-included range of
⫺0.85 and 0.14, whereas there was a 90% probability that the true
mean effect size of the gender-based subset was between a zero-included range of⫺0.82 and 0.37. Subset V% values were 33%
and 25% for minorities and women subsets, respectively. Taken together, these values suggested further moderator meta-analyses. Test difficulty. We next meta-analyzed test difficulty as a moderator across stereotypes. Table 4 shows that stereotype-threatened minorities performed more poorly than did nonthreat-ened minorities when cognitive ability tests were highly difficult (meand⫽|.43|, a reliable effect with a nonoverlapping 95% CI)
than when tests were moderately difficult (meand⫽|.18|,
zero-included 95% CI). (There were no studies using easy tests to investigate stereotype threat effects among minority test takers.) The credibility intervals did not overlap zero, meaning that these findings were conclusive.
Similar to ethnic minority test takers, women underperformed when a math test was highly difficult (meand⫽ |.36|), more so
than when a math test was moderately difficult (meand⫽|.18|).
However, when the test was easy, women tended to improve their test performance slightly (mean d⫽ |.08|). The nonoverlapping
95% CIs indicate that only the high difficulty finding was reliable. The V% and zero-included 90% CrIs indicate that true moderators still existed. The smaller file-drawer N values indicate that the findings on medium and low difficulty levels were not conclusive. Domain identification. As shown in Table 4, there were no discernible differences in stereotype threat effects between highly and moderately domain-identified samples (meands⫽ |.32| and
|.37|,ks⫽12 and 9, respectively). The results were inconsistent
with those in Walton and Cohen’s (2003) meta-analysis (i.e., mean ddomain-identified⫽ |.68| vs. meandnot-identified⫽ |.29|). However,
our hierarchical meta-analyses with studies on gender-based ste-reotypes showed a different pattern of findings: Highly math-identified women experienced smaller stereotype threat effects (meand⫽ |.29|,k⫽ 9) than did moderately low math-identified
women (meand⫽|.52|,k⫽6). The nonoverlapping 95% CIs show
that only the result for the moderate domain identification subset was reliable. Smaller V% values and zero-included CrIs indicate that these findings were inconclusive because of other moderators that may explain the variance in the data over and above study artifacts. Furthermore, lower fail-safe N values show that these meta-analytic findings might not be conclusive. There were only three studies of ethnic minorities in each level, so the analyses for minority subsets were not conducted (see Arthur, Bennett, Edens, & Bell, 2003).
Stereotype threat relevance: Threat-activating cues. Table 5 shows that stereotype threat-activating cues affected minority test takers’ test performance (meand⫽|.30|) more than that of women
(meand⫽|.21|). However, Table 5 shows that when the negative
stereotype was based on race, the largest mean effect size was produced for moderately explicit threat-activating cues (meand⫽
|.64|) compared with other types of threat-activating cues (blatant cues: meand⫽|.41|; subtle cues: meand⫽|.22|). As the V% and
CI values in Table 5 indicate, the findings for the race-based subset for blatant cue conditions were conclusive, but for the subtle cues subset further moderator analyses were still needed.
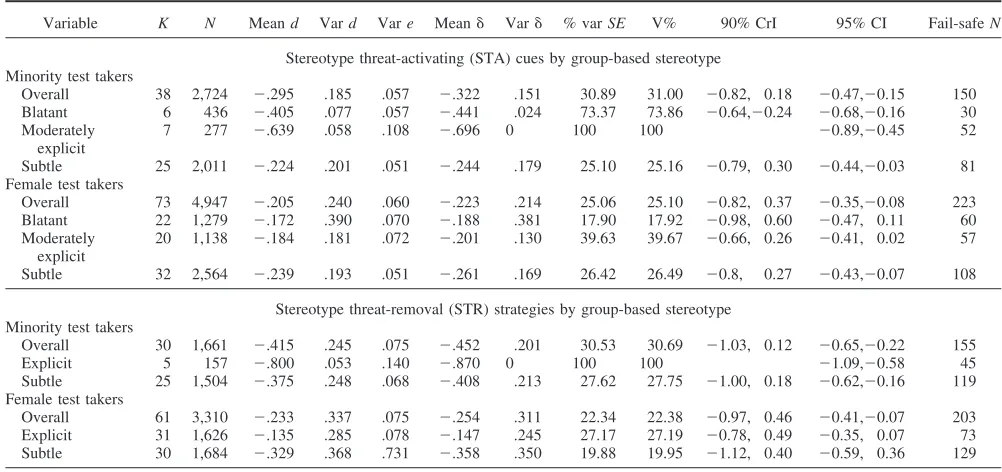
Table 5
Hierarchical Moderator Analyses of Stereotype Threat Relevance (Activation and Removal)
Variable K N Meand Vard Vare Mean␦ Var␦ % varSE V% 90% CrI 95% CI Fail-safeN
Stereotype threat-activating (STA) cues by group-based stereotype Minority test takers
Overall 38 2,724 ⫺.295 .185 .057 ⫺.322 .151 30.89 31.00 ⫺0.82, 0.18 ⫺0.47,⫺0.15 150 Blatant 6 436 ⫺.405 .077 .057 ⫺.441 .024 73.37 73.86 ⫺0.64,⫺0.24 ⫺0.68,⫺0.16 30 Moderately
explicit
7 277 ⫺.639 .058 .108 ⫺.696 0 100 100 ⫺0.89,⫺0.45 52
Subtle 25 2,011 ⫺.224 .201 .051 ⫺.244 .179 25.10 25.16 ⫺0.79, 0.30 ⫺0.44,⫺0.03 81 Female test takers
Overall 73 4,947 ⫺.205 .240 .060 ⫺.223 .214 25.06 25.10 ⫺0.82, 0.37 ⫺0.35,⫺0.08 223 Blatant 22 1,279 ⫺.172 .390 .070 ⫺.188 .381 17.90 17.92 ⫺0.98, 0.60 ⫺0.47, 0.11 60 Moderately
explicit
20 1,138 ⫺.184 .181 .072 ⫺.201 .130 39.63 39.67 ⫺0.66, 0.26 ⫺0.41, 0.02 57
Subtle 32 2,564 ⫺.239 .193 .051 ⫺.261 .169 26.42 26.49 ⫺0.8, 0.27 ⫺0.43,⫺0.07 108
Stereotype threat-removal (STR) strategies by group-based stereotype Minority test takers
Overall 30 1,661 ⫺.415 .245 .075 ⫺.452 .201 30.53 30.69 ⫺1.03, 0.12 ⫺0.65,⫺0.22 155
Explicit 5 157 ⫺.800 .053 .140 ⫺.870 0 100 100 ⫺1.09,⫺0.58 45
Subtle 25 1,504 ⫺.375 .248 .068 ⫺.408 .213 27.62 27.75 ⫺1.00, 0.18 ⫺0.62,⫺0.16 119 Female test takers
Overall 61 3,310 ⫺.233 .337 .075 ⫺.254 .311 22.34 22.38 ⫺0.97, 0.46 ⫺0.41,⫺0.07 203 Explicit 31 1,626 ⫺.135 .285 .078 ⫺.147 .245 27.17 27.19 ⫺0.78, 0.49 ⫺0.35, 0.07 73 Subtle 30 1,684 ⫺.329 .368 .731 ⫺.358 .350 19.88 19.95 ⫺1.12, 0.40 ⫺0.59, 0.36 129
As shown in Table 5, the negative stereotype concerning wom-en’s mathematical ability yielded a different pattern of findings from the race-based stereotype. Studies using moderately explicit cues yielded a comparable mean effect size (meand⫽|.18|) to that
in studies using blatant cues (meand⫽ |.17|). The zero-included
95% CIs indicate nonreliable effects. Studies employing subtle stereotype threat cues yielded the largest mean effect size (mean d⫽ |.24|), and the nonoverlapping 95% CI indicates a reliable
effect. (The effect size differences among these subsets were trivial though.) V% values and the 90% CrIs suggest that other moder-ators would further explain the variance in thesedvalues to reach conclusive findings. Our findings show a more complex pattern than the results in Walton and Cohen’s (2003) meta-analysis: Walton and Cohen had found that overall, explicit stereotype threat activation produced a greater effect size (meand⫽|.57|) than when
the activation was not explicit (meand⫽|.27|). Their findings were
consistent with those found for minorities in the present study but inconsistent with those found for female test takers.
Stereotype threat relevance: Threat-removal strategies. Table 5 shows that stereotype threat-removal strategies differentially affected minority test takers (meand⫽|.42|, nonoverlapping 95%
CI) and female test takers’ performance (meand⫽|.23|,
nonover-lapping 95% CI). Stereotype threat-removal strategies seemed to work better on women’s math test performance than on minorities’ test performance, at least at the mean level.
Hierarchical meta-analyses showed that minority test takers seemed to benefit more from subtle or indirect threat-removal strategies than from direct, explicit ones (i.e., smaller stereotype threat effects: mean d⫽ |.38| and mean d⫽ |.80|, respectively).
Study artifacts explained all variance in the explicit-removal strat-egy subset ofdvalues, indicating that this finding of interest was conclusive, although one should be cautious about generalizing this finding because there was a smaller fail-safeNof 45. How-ever, study artifacts explained only 28% of the variance in the subtle removal-strategy subset of d values, and the 90% CrI overlapped zero, indicating true moderators and inconclusive find-ings.
Table 5 also reveals that female test takers benefited more from explicit stereotype threat-removal strategies (meand⫽|.14|,
zero-included 95% CI) than from subtle strategies (mean d ⫽ |.33|,
nonoverlapping 95% CI). Low V% values and zero-overlapping 90% CrIs indicate the effects of other true moderators. Again, the pattern of Walton and Cohen’s (2003) meta-analytic findings was more consistent with our result pattern for minorities than with that for women (i.e., Walton and Cohen found that studies explicitly removing stereotype threat produced greater stereotype threat, meand⫽.45, than studies that did not, meand⫽.20).
Supplemental Bias Analysis
As shown in Figure 1, the funnel plot for the full meta-analytic data set resembles a relatively symmetrical inverted funnel, indi-cating the absence of publication bias in the data set. Further, the relationship between effect size estimates and study sample sizes was positive and statistically significant (r⫽.23,p⬍.05). When
four primary studies, each with a sample size larger than 200, were excluded from the data set (Anderson, 2001; Dinella, 2004; Stricker & Ward, 2004, Study 1B & Study 2), a similar pattern of findings was also found.
One additional question is whether studies that yielded either positive effect size estimates or estimates clustering around the zero point (k⫽29, 25% of the data set) have differential
charac-teristics from studies where thedvalues supported the hypothesis of performance interference (i.e., a negative effect size). Examin-ing the general characteristics of samples in subsets of studies at different levels of effect size estimates, we found no clearly defining characteristics that might distinguish studies that found no stereotype threat effects or positive effects from studies that found the effects.5
Between-Group Stereotype Threat Effects
As shown in Table 6, the overall between-group effect values increased from a mean effect size d⫽ |.44| in test-only, control
conditions to a mean effect size d⫽ |.53| in stereotype
threat-activated conditions. When interventions or threat-removal strate-gies were implemented, stereotyped test takers underperformed on cognitive ability tests compared with reference test takers (mean d⫽|.28|). The nonoverlapping 95% CIs indicate reliable effects.
The 90% CrI values and V% estimates indicate true moderator effects. The zero-included CrIs for meands in stereotype threat-activated conditions and stereotype threat-removed conditions mean that these findings were not conclusive. The credibility interval for mean d in control conditions did not overlap zero, however.
Subsequent hierarchical meta-analyses across group-based ste-reotypes were conducted. As shown in Table 6, in control condi-tions, ethnic minority test takers underperformed compared with majority test takers: The between group mean d is |.56|. The nonoverlapping 95% CI indicates a reliable effect. On the average, ethnic minority test takers’ test scores were approximately at the 30th percentile of majority groups’ mean test scores, which is relatively consistent with the literature (e.g., the overall mean standardized differences forgare 1.10 for the Black–White com-parison and 0.72 for the Latino–White comcom-parison; Roth, Bevier, Bobko, Switzer, & Tyler, 2001). Note that study artifacts ex-plained all observed variance in thedvalues in this subset, sug-gesting that no further moderator analyses should be conducted for this subset.
Table 6 also reveals that, in control conditions, women under-performed compared with men on mathematical ability tests; the between-group mean effect size was mean d⫽ |.26|, which is
consistent with the literature (see a review by Halpern et al., 2007). The nonoverlapping 95% CI indicates a reliable effect. On aver-age, women’s mean math test scores were approximately at the 40th percentile of men’s mean math test scores. Study artifacts explained all of the variance in d values, suggesting no other moderators for this subset. Although the fail-safeNvalue was not very large (47), similar overall gender differences in math test
5Whereas there was only one non-American sample in the “non-effect”
performance were observed in the testing literature; therefore, a file-drawer problem was possible but not plausible.
In stereotype threat-activated conditions, ethnic minority test takers underperformed compared with majority test takers, and the between-group mean effect size was meand⫽|.67|. The
nonover-lapping 95% CI indicates a reliable effect. When stereotype threat was activated, on average, ethnic minority test takers’ mean scores were approximately at the 25th percentile of majority groups’ mean test scores, which was worse than the results in control conditions. Study artifacts explained about 62% of the observed variance in d values, suggesting that further moderator effects should be investigated for this subset. The 90% CrI did not overlap zero, indicating a conclusive result.
Also in stereotype threat-activated conditions, women underper-formed compared with men on mathematical ability tests, and the between-group mean effect was meand⫽|.39|. The
nonoverlap-ping 95% CI indicates a reliable effect. In other words, when stereotype threat was activated, women’s mean math test scores were approximately at the 34th percentile of men’s mean scores. Study artifacts explained only 26% of the variance ind, suggesting other true moderator effects. The zero-included credibility interval indicates an inconclusive finding.
In stereotype threat-removed conditions, ethnic minority test takers underperformed compared with majority test takers; the between-group mean effect size was mean d⫽ |.38|, a reliable
effect based on the nonoverlapping 95% CI value. On average, when stereotype threat effects were removed, ethnic minority test takers’ mean test scores were approximately at the 34th percentile
of majority groups’ mean test scores. However, study artifacts explained about 38% of the observed variance in thedvalues in the subset findings, suggesting moderator effects. The zero-included 90% CrI indicates that this finding was not conclusive.
Furthermore, in stereotype threat-removal conditions, women underperformed compared with men on mathematical ability tests, and the between-group mean effect size was mean d⫽ |.23|, a
reliable effect based on the nonoverlapping 95% CI value. On the average, women’s math test scores were approximately at the 41st percentile of men’s mean math scores when stereotype threat-removal strategies were implemented. Study artifacts explained 73% of the variance indvalues,suggesting no other moderators. The 90% CrI did not include zero, indicating a meaningful effect.
Discussion
In integrating more than 10 years of experimental research on stereotype threat effects on stereotyped test takers’ cognitive abil-ity test performance, we found that the overall performance of stereotyped test takers might suffer from a situational stereotype threat: Our overall effect size of |.26| was consistent with the finding in Walton and Cohen (2003). However, there was consid-erable variability in the effect sizes (i.e., one fourth of studies in our data set showed zero or positive effects); therefore we exam-ined several conceptual moderators (test difficulty, domain iden-tification, and the activation or removal of stereotype relevance), each of which was analyzed separately for race-based and
gender--3.00 -2.00 -1.00 0.00 1.00
Effect estimate of stereotyped groups
0 200 400 600 800
Sample size of st
ereotyped groups
(K = 116)