Data Comparison on Fumes Local Exhaust Ventilation: Examination and
Testing Compliance to USECHH Regulation 2000
1
Nor Halim Hasan, 2Mohd Radzai Said, 3Abdul Mutalib Leman, 4B.Norerama D.Pagukuman and 5Jaafar Othman 1,2
Faculty of Mechanical, Universiti Teknikal Melaka, Malaysia 3,4
Faculty of Engineering Technology, Universiti Tun Hussien Onn, Malaysia 5
LCMS Consultancy Sdn Bhd
Abstract
The paper focused on the examination and testing of local exhaust ventilation (LEV) systems at one of Electrical Company to check the transport velocity whether it meet the recommended American Governmental Industrial Hygienist (ACGIH) Standard. The industrial hygiene approaches, AREC (Anticipating, Recognize, Evaluate and Control) were adopted in this study. This is to ensure that the LEV system installed has the optimum efficiency to extract out the contaminants from the workstation. Objective of this study is to make comparison with previous and current monitoring data. The efficiency and the other parameter measured will be the main source to analyze for the particular applications. The differential of data was discussed and several recommendations are proposed to make sure the LEV system performance is excellent.
Keywords: Local Exhaust Ventilation (LEV), USECHH Regulation 2000, Contaminants,Occupational
Safety and Health.
1. Introduction
Worker in Electronics Company are exposed to hazardous chemical (chemical hazard) and physical hazard. (Koh, Chan, & Yap, 2004). They are suggested significant measures is the application of ventilation and enclosure systems where ineffective removal of chemicals and recycling of air could result in its stagnation and concentration. A regularly assess levels of selected substances to ensure engineering controls are implementation Workforce increases in electronics industries and a requirement to the management to recognize possible hazards, and to implement appropriate control measures to workers on occupational health effects.
Meanwhile study by (Bluff, 1997) found that training on safety and health was less commonly provided and for better control measures implemented on personal protective measures and administrative controls, rather than on measures which control chemical exposures at source. Areas for improvement in the management of hazardous chemicals were identified and baseline information was obtained against which the impact of proposed regulatory reforms to control workplace hazardous substances can be evaluated.
A local ventilation design solution for the mould casting area was designed (Kulmala, Hynynen, Welling, & Saamanen, 2007) and dimensioned with the aid of computational fluid dynamic (CFD) calculations. The prototype of the push–pull ventilation system was built and tested in actual operation at the foundry. The capture efficiency of the prototype was determined by the tracer gas method varied between 40 and 80%.
Push-pull ventilation design was developed as an alternative. Tested in laboratory that the systems capture efficiency was carried out using nitrous oxide tracer gas and capture efficiency was generally greater than 90% (Watson, Cain, Cowie, & Cherrie, 2001). Without the push airflow, capture efficiency decreased sharply with increasing distance from the exhaust hood (between 38 and 58% at 420 mm from the front of the exhaust hood with the same exhaust airflow used by the push-pull system). Only a small amount of soldering was carried out both the in-house and push-pull systems in their study suggested that the in-house systems were relatively inefficient.
a. Compliance to Legislations
b. ACGIH recommendation
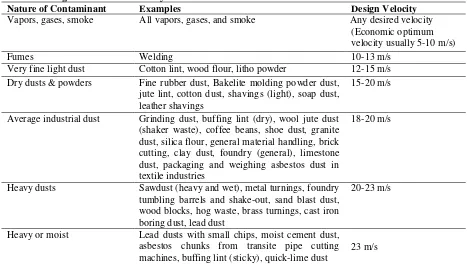
American Conference of Governmental Industrial Hygienist (ACGIH) (American Conference of Govenrnmental Industrial Hygienists, 2009) on 23rd Edition used as a references to get the range of minimum velocity for capture velocity and face velocity as a baseline in this study to obtain compliance of these guidelines.
Table 1: Range of Minimum Velocity
Nature of Contaminant Examples Design Velocity
Vapors, gases, smoke All vapors, gases, and smoke Any desired velocity (Economic optimum velocity usually 5-10 m/s)
Fumes Welding 10-13 m/s
Very fine light dust Cotton lint, wood flour, litho powder 12-15 m/s Dry dusts & powders Fine rubber dust, Bakelite molding powder dust,
jute lint, cotton dust, shavings (light), soap dust, leather shavings
15-20 m/s
Average industrial dust Grinding dust, buffing lint (dry), wool jute dust (shaker waste), coffee beans, shoe dust, granite dust, silica flour, general material handling, brick cutting, clay dust, foundry (general), limestone dust, packaging and weighing asbestos dust in textile industries
18-20 m/s
Heavy dusts Sawdust (heavy and wet), metal turnings, foundry tumbling barrels and shake-out, sand blast dust, wood blocks, hog waste, brass turnings, cast iron boring dust, lead dust
20-23 m/s
Heavy or moist Lead dusts with small chips, moist cement dust, asbestos chunks from transite pipe cutting machines, buffing lint (sticky), quick-lime dust
23 m/s
Source: Table 3-2, American Conference of Governmental Industrial Hygienist (ACGIH) – 23rd Edition.
Table 2 : Range Of Capture Velocities
Condition of Dispersion of Contamination Examples Capture Velocity, m/s
Released with practically no velocity into quite air.
Evaporation from tanks, degreasing, etc.
0.25 – 0.50 m/s
Released at low velocity into moderately still air.
Active generation into zone of rapid air motion.
Spray painting in shallow booths; barrel filling; conveyor loading; crusher
1.0 – 2.5 m/s
Released at high initial velocity into zone at very rapid air motion.
Grinding; abrasive blasting; tumbling.
2.5 – 10.0 m/s
Source: Table 3-1, American Conference of Governmental Industrial Hygienist (ACGIH) – 23rd Edition.
For low-activity radioactive laboratory work, a laboratory fume hood may be acceptable. For such hoods, an average face velocity of 0.4 -0.5 m/s is recommended (Section 3.7.2, ACGIH). When significant quantities of heat are transferred to the air above and around the process by conduction and convection, a thermal draft is created which causes an upward air current with air velocities as high as 2 m/s. (Section 3.9,ACGIH)
Objective of this study is to make comparison with previous and current monitoring data. The efficiency and the other parameter measured will be the main source to analyze for the particular applications. The differential of data was discussed and several recommendations are proposed to make sure the LEV system performance is excellent.
c. Case study description
The purposed of examination and testing of an LEV System to identify the effectiveness of the LEV as an engineering control measure so as to reduce the exposure of employees to chemical hazardous to health to below the permissible exposure limits or it is at the lowest practicable exposure level. The others purpose of examination and testing an LEV system is to prepare a periodic data for comparing it with the last monitoring data to determine the effectiveness of the LEV system by a hygiene technician at appropriate intervals of not more than 12 months after the last periodic monitoring.
The diagram 1 and 2 of LEV System in the plant show below are to remove welding fume. The number indicated the data measurement taken from 1 until number 52. Only 1 (one) enclosure fan is used and apply to the system located at point 1.
2. Research Methodology
Preparation of a periodic data for comparison with the baseline examination and testing data, by the hygiene technician and check if the design is according to an approved standard by a registered professional engineer and constructed according to the design specifications. At last check if a registered professional engineer has tested the LEV system after construction and installation to demonstrate that the equipment meets with the design specifications.
a. Apparatus
The equipment used in the course of this study, namely as recommended in the ACGIH guidelines. Explanations of the use of each instrument are as follows. Airflow Meter is used for airflow measurements. Thermal Anemometer is used for airflow and temperature. Smoke Tube is used for identifying the direction of airflow and duct leakages. Thermo hygrometer is used to measure temperature and humidity. Tachometer is used for determining the fan and motor speed (rpm).
Vane anemometer is used for airflow measurements. A measuring tape is used to measure the length and distance. To cover-up the holes on the duct, Adhesive Tape are used. Pitot tube is used for pressure measurements. Clamp Meter to measure current and voltage. Manometer is used for airflow measurements.
Diagram 2: Sketch diagram for LEV system (No indicated the measurement position from no 15 to 26 and no 31 to 52)
b. Inspection and Testing Pre-preparation
Identify or tracing the LEV systems in the plant according to the drawing and physical examination and the operating characteristic of the systems. A walk through survey is carried out to determine the number of points to be tested along the hood, ducting, suction fan and exhaust stack.
Hood Measurement and Monitoring
Observation was made around the hood with respect to the following factors such as the physical condition of the hood, type of hood installed and its suitability for the process and condition of the work area around the hood, e.g. accumulation of the dust, cross drought etc. Hood velocity measurement (face/capture velocity) was carried out using smoke tubes and anemometer (to determine the average flow rate of the hood). Hood static pressure measurement was carried out (where possible) using anemometer.
Duct Measurement and Monitoring
Observation was made along the ducting system with respect to the physical condition of the ducting, unnecessary losses along the systems and location of the dampers or blast gates. Location for static pressure testing was determined for the purpose of baseline measurement. Static pressure measurement was conducted by using anemometer. Location for the velocity pressure testing was determined for the purpose of baseline/annual measurement. Velocity pressure measurement was conducted by using anemometer.
Traverse measurement (to measure velocity pressure and air velocity) was conducted on the identified points by using pitot tube and anemometer.
Air Cleaner Measurement and Monitoring
Inlet and outlet static pressure of the air cleaners were determined by using pitot tube and anemometer. Fan Measurement and Monitoring
Inlet and outlet static/velocity pressure (and the exhaust flow rate) of the fan by using pitot tube and anemometer. Non-contact tachometer was used to determine RPM of the motor.
3. Results Current measurement against ACGIH Standard
Hood (Face Velocity and Capture Velocity)
Measurements for face velocity are taken at all point of workstation shown in diagram 1 and diagram 2.
All measurement for face velocity at working area are above std setting in ACGIH. Average of hood face velocity is 1.06 m/s. 3 type of hood size measured i.e. size 813x356mm at location 10/11, size 813x533mm at location 39/40/44/45 and other location size are 150x100mm. Measurement shown in graph is fluctuate but over standard setting at min 0.5m/s.
Trend of graph for capture velocity almost the same with face velocity. Average of capture velocity is 0.81m/s. Measurement shown in graph is fluctuate but over standard setting at min 0.5m/s
Ducting
Using the thermal Anemometer to measure direct reading of velocity at position shown in Diagram 1 and Diagram 2 for the whole system of Local Exhaust Ventilation at the plant.
All measurement for face velocity at working area are above std setting in ACGIH. Average of ducting velocity is 10.11 m/s. Measurement shown in graph is fluctuate but over standard setting at range 10 m/s to 13 m/s.
Fan
The static pressure, velocity pressure and flowrate are measure for inlet and outlet position at fan for Local Exhaust Ventilation System at plant the table below shown the data taken.
Table 3: Static Pressure (Sp), Velocity Pressure (Vp) and Flow rate at fan.
Point Static Pressure (Sp) Velocity Pressure (Vp) Flow rate
(Pa) (Pa) (m3 / hr.) cfm
Calculation of Brake Horse Power (BHP) shown as formula below:
(3)
Where ME = 0.65
Table 4: Comparison Design Value and Test Value difference years i.e. 2008, 2009 and 2011.
Measurements are taken at location of working area from position 5 to 52. Data measured are comparing for ducting velocity shown for the year 2008, 2009 and 2011. Standard are used refer to ACGIH on fume. As a result velocity data taken for the year 2008 are below the Standard requirement. Improvement of the Local Exhaust Ventilation system are made by the management and the result measured in the year 2009 shows the increment compare previous years and position between the standard of ACGIH. In the year of 2011 the result taken slightly lower compare to 2009 but the system of LEV are between the standard settings.
4. Recommendations
Improvement on velocity is to maintain for better performance of Local Exhaust Ventilation system. For those data are above and within standard recommended to maintain transport velocity to the existing system by having a periodical inspection and any further tapping / connecting need to recalculate the efficiency on the respective systems.
It is also recommended to the management to conduct schedule inspection and maintenance to improve or maintain the overall exhaust ventilation system required under USECHH Regulation 2000. Generally the low transport velocity and pressure losses could be due to several factors such as; clog in the ducting system, duct friction losses, duct losses in elbows, contraction, expansion, and orifice, entry losses in branch entries or cleaner entries, hood entry losses due to turbulence, shock losses and vena contract. Special fitting losses such as blast gates, valves, orifices, and exhaust cap and exhaust stack losses.
Computerized Fluid Dynamic (CFD) software is recommended for future work to verify and validate the data from measurement and compare with simulations.
2008, 2.97
5. Conclusions
The airflow measurements, visual assessment and other tests conducted, the overall performance of the local exhaust ventilation System was found to be satisfactory. At this present working condition, the system was effective to remove chemical contaminants from workplace. Therefore, the workplace was clean and safe for the workers to work for longer hours without any serious exposure to the chemical hazardous to health.
The airflow performance of the LEV system was quite lower as compared to the last monitoring but still within the range of standard of ACGIH. The management is advised to practice the following steps to maintain/ improve the systems performance. The LEV system shall be serviced regularly to maintain / improve its performance. Maintenance and servicing schedules should be followed regularly to maintain the performance and detect early sign of deterioration of the systems. Yearly evaluation of LEV system by any DOSH Registered Hygiene Technician and the management must kept the LEV report for 5 years for any further action.
As a result with both fan measured and compare with previous data and design calculation show that LEV system performance are good and remove the contaminant at workplace. Measurement and monitoring showed that the LEV system are comply with both regulation enforced by the Department of Occupational Safety and Health Malaysia such as on engineering control equipment, design, construction and commissioning of local exhaust ventilation equipment and records of engineering control equipment USECHH Regulation 2000 and followed according to the American Conference of Governmental Industrial Hygienists (ACGIH) Guidelines.
Some defect observed during inspection and observation and possible lead to performance of local exhaust ventilation system at plant. The flexible ducting hose found too many bent (photo 1) and flexible duct dented (photo 2). Improve of the ducting are recommended to improve the airflow and velocity for better capture of fume at workstation.
Photo 1: Too many bent along flexible ducting (may cause many loses).
Photo 2: Flexible ducting was dented.
6. Acknowledgement
7. References
American Conference of Govenrnmental Industrial Hygienists. (2009). Industrial Ventiltion: A Manual of Recommended Practice for Operation and Maintenance. Cincinnati: ACGIH.
Bluff, E. (1997). The Use and Management of Hazardous Chemicals in South Australian Workplaces. Safety Science , 25 (1-3), 123-136.
Dept. of Occupational Safety and Health Malaysia. (2006). Occupational Safety and Health (Use and Standards of Exposure of Chemicals Hazadrous to Health, Regulation 2000. Kuala Lumpur: MDC.
Koh, D., Chan, G., & Yap, E. (2004). World at work: The electronics industry. Occupational Environment Medicine , 61, 180-183.
Kulmala, I., Hynynen, P., Welling, I., & Saamanen, A. (2007). Local Ventilation Solution for Large, Warm Emission Sources. Annal Occupational Hygiene , 51 (1), 35-43.