ii
THE RELATIONSHIP BETWEEN PLANT STEROLS INTAKE AND
TOTAL BLOOD CHOLESTEROL LEVEL IN BOGOR RURAL AREA
Atikah Bararah1,2, Nuri Andarwulan1,3 1
Department of Food Science and Technology, Faculty of Agricultural Technology, Bogor Agricultural University, Darmaga, Bogor, West Java, Indonesia
2
email: [email protected], [email protected]
ABSTRACT
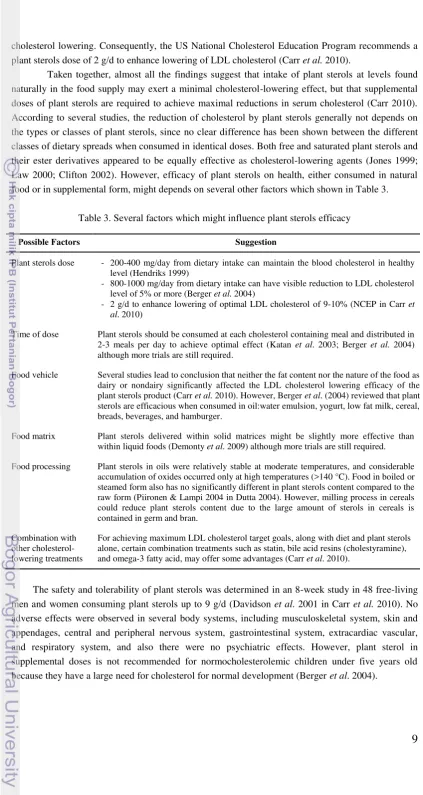
Coronary heart disease (CHD) is the most common cause of death in Indonesia. Lowering cholesterol level is currently one of the most efficient and effective way to prevent or reduce the risk of CHD and other cardiovascular disease (CVDs). One of the compounds that have the cholesterol-lowering ability is plant sterols. To further research about plant sterol efficacy for health and its application as functional food ingredient in Indonesia, an up-to-date data about plant sterols dietary intake is required. The study was conducted with a cross sectional design to estimates the plant sterols (PS) intake and its relationship with total blood cholesterol level in Bogor rural area. Data of plant sterols level in food obtained by secondary data and calculation of recipe. Based on the results, the level of plant sterols intake of total respondent was averagely 223.80 mg/day with no statistical difference between male and female intake (t(98) = - .036, p > 0.05). The plant sterols intake in all respondents was mostly contributed by cereals and cereals product (37.46%), followed by legumes and legume products (24.41%). According to Pearson correlation test, there was no association between daily intake of plant sterols and total blood cholesterol (P > 0.05), which mean that the intake level not yet have visible effect in lowering or raising total blood cholesterol levels in respondents with health nutritional status, but presumed maintain normal blood cholesterol levels in respondents.
iii
Atikah Bararah. F24080076. The Relationship between Plant Sterols Intake and Total Blood Cholesterol Level in Bogor Rural Area. Under supervision of Nuri Andarwulan. 2013.SUMMARY
Coronary heart disease (CHD) is the most common cause of death in Indonesia, representing 26.4% of death in 2001 (Sarimawar, Irianto, & Mulyono 2003). The major risk factor of CHD is the raised blood cholesterol as the impact of perennially unhealthy lifestyle and diet. Lowering cholesterol level is currently one of the most efficient and effective way to prevent or reduce the risk of CHD and other CVDs (Normen, Frohlich, & Trautwein 2004). One of the compounds that have the cholesterol-lowering ability is plant sterols. To further research about plant sterol efficacy for health and its application as functional food ingredient in Indonesia, an up-to-date data about plant sterols dietary intake is required. This study was conducted to obtain daily plant sterols intake, determine the consumption pattern of food containing plant sterols, and examine the relationship between the plant sterols intake and blood cholesterol levels in Bogor rural area. The results of this research were expected to be a part of the cardiovascular disease prevention in Indonesia, particularly coronary heart disease, by using plant sterols as functional food ingredients.
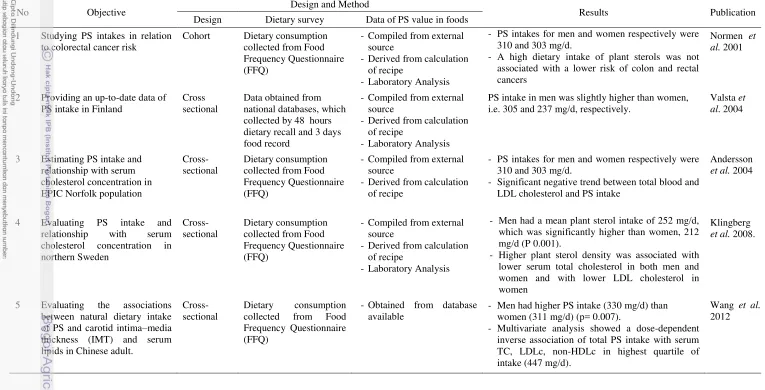
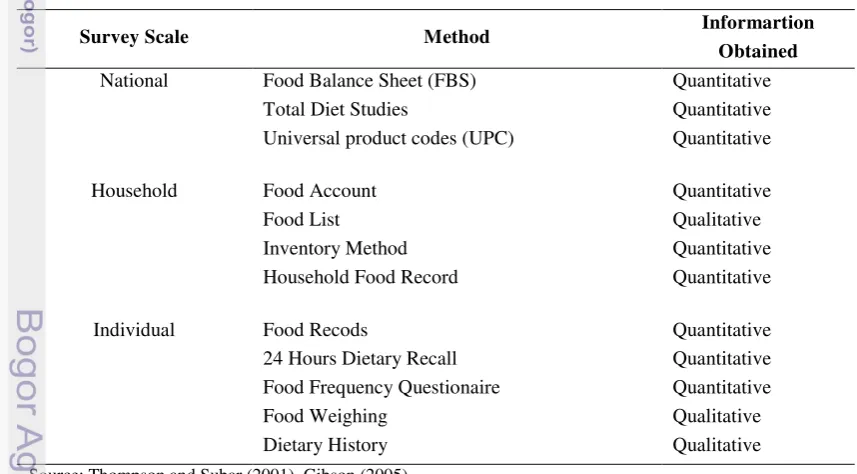
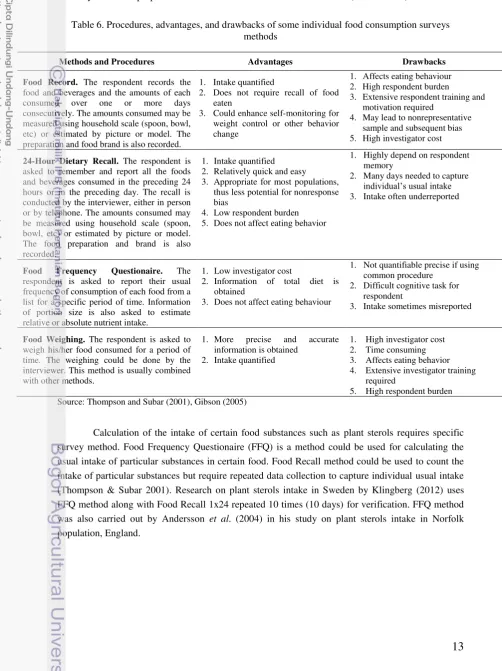
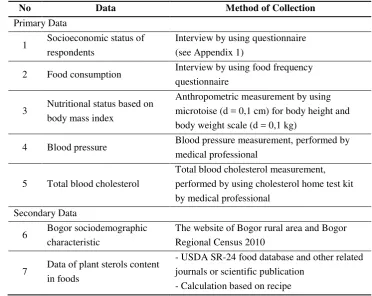
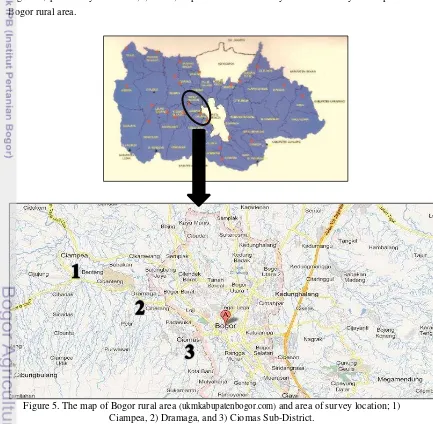
The research was conducted in Bogor rural area, which began in June 2012 and was completed in November 2012. The research was conducted with a Cross Sectional design, with 100 respondents (50 males and 50 females) participated. Data about respondent characteristics was obtained with interview by using a set of questionnaire. Consumption data from individual subject was collected by using Food Frequency Questionnaire methods. Meanwhile, food composition database of plant sterol content was mainly obtained from secondary data to determine the plant sterols content in every food eaten. The daily plant sterols intake of respondent then counted. Once the intake of plant sterols obtained, the score between the groups (male and female) was statistically compared by Independent Sample T-Test. The relationship between daily plant sterols intake and total blood cholesterol were analyzed using Pearson correlation test.
The characteristics of respondents are divided into socioeconomic and nutritional status of respondents. Most of the respondents were in the range of 25-35 years (46% in male and 44% in female), with mostly complete their education at the primary school (50% male and 44% female), junior high school (20% male and 24% female), and senior high school (16% male and 16% female). The majorities of male respondents (40%) worked as a labor, while 80% of female respondents were unemployed and mostly a housewife. The results also showed that the majority of respondents from both groups of men (44%) and women (50%) had a family size ≤ 4 (small family) while their income per capita was still below the poverty line is as much as 48% of male respondents and 56% of women.
iv
blood cholesterol level, more than half of respondents (66% male and 90% female) had cholesterol levels <200 mg/dL, thus in desirable level of blood cholesterol.In this study, food item predicted to contain plant sterols were categorized into 12 groups based on the dominant type of raw material; (1) beverages, (2) cereals and cereal products, (3) egg and egg products, (4) fish and fish products, (5) fruits and fruit product, (6) herbs, spices, and condiments, (7) meat and poultry products, (8) legumes and legume products including nut, (9) plant sterols fortified products, (10) snack foods, (11) supplements, (12) vegetables and vegetable products. There were several sub groups in each group, based on process and main raw material. The average level of food consumption in all respondents amounted to 886.14 g/capita/day, male respondents of 862.91 g/capita/day, and female respondents at 909.37 g/capita/day. Based on consumption per-eater only, all respondents consumed cereals and cereal products predicted to contain plant sterols, followed by legumes and legume products and vegetable and vegetables product at same level (99% eater).
Based on food consumption survey, there were 265 food items which consumed by respondents which categorized into 12 groups. Each groups contained several sub-groups which divided based on the processing and main raw material used. The data of food plant sterols level used was compiled from publications of scientific journals and USDA food database. As done in the previous study, the plant sterol content of all products of pure animal origin was set at zero, as was that of the following products: soft drinks, tea, coffee, cocoa drinks, sugar, honey, syrup, soy sauce, and local herbal drinks. The compilation result showed the three highest plant sterols contained sub-groups were all in legumes group, i.e. legumes, other; legumes, peanut based; and red bean soup. Animal based product, i.e. egg, fish, and meat also contained noticeable amount of plant sterols, probably due to their added ingredients.
47
Appendix 1. Questionaire of respondent characteristics
FORM A. KUESIONER KARAKTERISTIK RESPONDEN
ASUPAN FITOSTEROL DARI PANGAN PADA MASYARAKAT
DI WILAYAH BOGOR
1. Nomor Responden : ________________________
2. Nama Lengkap Responden : ________________________ 3. Jenis Kelamin Responden : _______________________
4. Alamat Rumah : Jl. _______________ No. ______ RT______ RW______ Kelurahan _____________ Kecamatan______________
5. Wilayah : 1. Kota 2. Kabupaten
6. Nomor Hp/Telpon : _______________________
7. Tanggal Wawancara : _______________________2012
8. Enumerator : _______________________
9. Tanda Tangan Enumerator : _______________________ 10. Bersedia diambil darah (dari ujung jari) : 1. Ya 2. Tidak
A.
Karakteristik Responden dan Keluarga
1 No Responden :
2 NamaResponden :
3 UmurResponden :
4 Pendidikan Terakhir Responden : (tertutup)
5 PekerjaanResponden : (tertutup), jelas
6 NamaSuami/Isteri*) :
7 UmurSuami/Isteri*) :
8 PendidikanTerakhirSuami/Isteri*) :
9 Pekerjaansuami/Isteri*) :
10 Jumlah AnggotaKeluarga :
11
PendapatanIstri (Rp/bln) : PendapatanSuami (Rp/bln) :
PendapatanKeluargaLainnya :
48
12 Pengeluaran Total (Rp/bln) :
*)
Coret yang tidak perlu
B.
Keadaan Kesehatan Responden
1. Antropometri
Berat badan : ……… Kg Tinggi badan : ……… Cm
2. Tekanan Darah : ………
3. Riwayat penyakit sekarang:
No Jenis Penyakit Ya Tidak Jenis Pengobatan Ket.
1 Tekanan darah tinggi 2 Jantung
3 Kolesterol tinggi 4 Diabetes/kencing manis 5 Sakit ginjal
6 Sakit liver/sakit kuning 7 Asam urat
8
4. Riwayat penyakit dahulu
No JenisPenyakit Ya Tidak Jenis Pengobatan* Ket**.
1 Serangan jantung 2 Stroke
3 Sakit liver 4 Sakit ginjal 5
6 7 8
*nama obat yang diberikan (termasuk obat atau terapi tradisional), sejak kapan **pernah dirawat? Operasi? jenis spesifik penyakit
5. Riwayat penyakit keluarga
No JenisPenyakit Ya Tidak Hubungan kekeluargaan Ket**.
1 Tekanan darah tinggi 2 Jantung
3 Kolesterol tinggi 4 Diabetes 5 Sakit ginjal 6 Kegemukan 7
49
6. Minuman/ makanan yang dikonsumsi untuk tujuan kesehatan……..
7. Minuman/ makanan yang dipantang/dibatasi untuk tujuan kesehatan…….
C.
Kebiasaan Merokok dan Minum AlkoholJawaban yang sesuai diberi tanda check list (√) dan lingkari jawaban yang benar pada kolom frekuensi
No Kebiasaan Ya Tidak Jumlah/Frekuensi Jenis/merk Sejak kapan
1 Merokok a. Filter/……….
50
Appendix 2. Food Frequency Questionaire
FORM B. KUESIONER FREKUENSI PANGAN
ASUPAN FITOSTEROL DARI PANGAN PADA MASYARAKAT DI WILAYAH BOGOR
1. Nomor Responden
: ________________________2. Nama Lengkap Responden : ________________________ 3. Jenis Kelamin Responden : _______________________
4. Alamat Rumah : Jl. _______________ No. ______ RT______ RW______ Kelurahan _____________ Kecamatan______________
5. Wilayah : 1. Kota 2. Kabupaten
6. Nomor Hp/Telpon : _______________________
7. Tanggal Wawancara : _______________________2012
8. Enumerator : _______________________
9. Tanda Tangan Enumerator : _______________________
51
Makanan
1membeli
3(tempat/ merek)
memasak
4(cara mengolah)
(kali/minggu
atau
kali/bulan)
urt
6gram
7A
Biji-bijian dan Olahannya
Nasi putih
Beras putih
air
Ditanak
90x/bln
2 ctg nasi :
1 gls
2 gls
100
200
B
Umbi-umbian dan Olahannya
Perkedel kentang
kentang
telur
seledri
garam
minyak
digoreng
3x/minggu
2 bh sdg :
2 bh sdg
1 sdm
2 lbr
½ sdt
3 sdm
50
10
2
2.5
30
C
Kacang-kacangan dan Olahannya
Kacang
tanah
goreng sangrai
kacang tanah
garam
sangrai
4x/bulan
2 genggam
1 sdt
100
5
D
Sayuran dan Olahannya
Sayu bayam
bening
bayam
jagung manis
bawang merah
garam
direbus
10x/bln
1 mgk :
1 genggam
1 sdm
2 siung
1 sdt
52
Kode
0Nama
Makanan
1Komposisi
2
Asal Pangan
Frekuensi
5(kali/minggu
atau
kali/bulan)
Porsi
membeli
3(tempat/ merek)
memasak
4(cara mengolah)
urt
6
gram
7air
1 gelas
200
E
Buah-buahan dan Olahannya
Apel
Membeli
-
3x/bulan
1 bh sedang
150
F
Bumbu, Rempah, dan Minyak
Sambal
Cabe rawit
Bawang merah
Bawang putih
Garam
Tomat
digoreng
5x/minggu
1 sdm :
2 siung
1 siung
½ sdt
1 bh kecil
7
3
2.5
5
G
Manisan dan Minuman
Coklat
Cokelat hitam
silver queen dark
53
Kode
0Nama
Makanan
1Komposisi
2
Asal Pangan
Frekuensi
5(kali/minggu
atau
kali/bulan)
Porsi
membeli
3(tempat/ merek)
memasak
4(cara mengolah)
urt
6
gram
7H
Produk fortifikasi fitosterol
Susu
Susu
air
Tropicana Slim
non fat fitosterol
dilarutkan ke air
panas
7x/minggu
2 sdm
1 gls
20
200
I
Suplemen
J
Gorengan
Tempe
tepung
goreng
Tempe
tepung
garam
minyak
Membeli
3x/minggu
2 ptg sdg:
2 ptg sdg
1 sdm
1 sdt
2 sdm
30
10
5
20
K
Kue-kue
Biskuit
Khong Guan
2x/minggu
3 keping
30
L
Makanan berkuah kacang/saus kacang
Gado-gado
Bayam
Labu siam
Wortel
Toge
Membeli
3x/bulan
1 bgks :
1 sdm
1 sdm
1 sdm
1 sdm
54
Kode
0Nama
Makanan
1Komposisi
2
Asal Pangan
Frekuensi
5(kali/minggu
atau
kali/bulan)
Porsi
membeli
3(tempat/ merek)
memasak
4(cara mengolah)
urt
6
gram
7Bumbu kacang
Kecap
lontong
3 sdm
1 sdm
10 ptg kecil
30
10
100
M
Sayur Campuran
Soto ayam
bening
Ayam
Minyak
Tomat
Seledri
Garam
air
membeli
4x/bln
1 mgk:
1 ptg kcl
0.5 sdm
2 iris
2 lbr
¼ sdt
1 gls
55
Appendix 3. List of food used in food frequency interview
Code Food Name
A Cereals and products
1 White rice 2 Whole rice 3 Brown rice 4 Sticky rice 5 Black rice 6 Corn 7 Oatmeal
8 Noodles (fried, dried, raw) 9 Rice noodles
10 Pasta (sphagetti, macaroni, etc) 11 Breakfast cereal
B Legumes and products
1 Potato 2 Cassava
3 Yam
4 Sweet potato 5 Potato Chips 6 Cassava chips 7 Yam chips
8 Mashed potato with egg
C Legumes, nuts, and products
1 Peanut 2 Fava bean 3 Mung bean 4 Soybean 5 Kidney bean
6 Pea
7 Cashew 8 Tempeh 9 Tofu 10 Oncom 11 Soy milk 12 Mung bean milk 13 Peanut butter
D Vegetables and products
2 Katuk leaf 3 Water spinach 4 Tomato 5 Carrot 6 Bamboo shot 7 Chayote 8 Buncis
Code Food Name
9 Cassava leaves 10 Sawi
11 Lettuce 12 Cabbage 13 Cauliflowerl 14 Broccoli 15 Basil leaves 16 Bell pepper 17 Cucumber 18 Sprout 19 Eggplant 20 Mushroom
E Fruits and products
1 Avocado 2 Grapes 3 Apple 4 Durian 5 Orange 6 Lime
7 Mango
8 Pineapple 9 nutmeg (flesh) 10 Papaya 11 Banana 12 Rambutans 13 Water melon 14 Soursop 15 Strawberry 16 Melon 17 Pear 18 Persimmon
F Spices, oil, and condiments
56
Code Food Name
G Sweets and beverages
1 Chocolate 2 Jelly 3 Coffee 4 syrup
H Plant sterols fortified product
1 TROPICANA SLIM non fat fitosterol 2 Nutrive BENECOL
I Suplements
1 NATROLTM CH Balance
J Fried dishes
1 Tempeh 2 Tofu
3 Tofu fill with vegetable 4 Vegetable and flour snack 5 Croquettes
6 Fried chicken 7 Fried egg 8 Fried banana
K Mixed dishes
1 Mix vegetables sour soup 2 Mix all vegetables, soup 3 Capcay
4 Salad 5 Soto
Code Food Name
6 Rice cake with vegetables and soup 7 Meatball with noodle and vegetable in soup 8 Mix all fruits, served with ice
L Cake and snack
1 Biscuit 2 Bread
3 Bread with filling 4 Cake
5 Cookies 6 Pancake
7 traditional cake, rice flour with palm sugar, fried (cucur)
8 Traditional cake, rice flour, steamed (Kue Apem)
9 Traditional cake, rice flour and grated coconut, pan fried (Kue Pancong) 10 Cassava, mashed, steamed (Getuk) 11 etc
M Food served with peanut sauce
1 mix all vegetables, served with peanut sauce (Gado-gado)
2 wheat flour snacks, dim sum, served with peanut sauce (siomay)
3 mix all fruits, served with peanut sauce (Rujak)
57
Appendix 4. Socioeconomic and nutrinional status of respondents
Characteristics
Gender (%)
Total Male Female
n = 50 n = 50 Age
25 - 35 years 23(46,0) 22(44,0) 45(45,0)
36 - 45 years 7(14,0) 12(24,0) 19(19,0)
46 - 55 years 13(26,0) 11(22,0) 24(24,0)
56 - 65 years 7(14,0) 5(10,0) 12(12,0)
Education Level
Uneducated 3(6,0) 7(14,0) 10(10,0)
Primary school 25(50,0) 22(44,0) 47(47,0)
Junior High School 10(20,0) 12(24,0) 22(22,0)
Senior High School 8(16,0) 8(16,0) 16(16,0)
Diploma 1(2,0) 0(0,0) 1(1,0)
College 2(4,0) 1(2,0) 3(3,0)
Bachelor Degree 1(2,0) 0(0,0) 1(1,0)
Type of Job
Government Official 4(8,0) 0(0,0) 4(4,0)
Private Official 4(8,0) 0(0,0) 4(4,0)
Business 12(24,0) 0(0,0) 12(12,0)
Farmer 2(4,0) 1(2,0) 3(3,0)
Labour 20(40,0) 4(8,0) 24(24,0)
Seller 2(4,0) 5(10,0) 7(7,0)
Others 6(12,0) 0(0,0) 6(6,0)
No Job 0(0,0) 40(80,0) 40(40,0)
Household Member
Small (≤ 4 persons) 22(44,0) 28(56,0) 50(50,0)
Medium (5-6 persons) 19(38,0) 17(34,0) 36(36,0)
Large (≥ 7 persons) 9(18,0) 5(10,0) 14(14,0)
Income Per Capita
< 216.610 24(48,0) 28(56,0) 52(52,0)
216.610 - 500.000 17(34,0) 16(32,0) 33(33,0)
500.000 - 1.000.000 6(12,0) 6(12,0) 12(12,0)
58
Characteristics
Gender (%)
Total Male Female
n = 50 n = 50 Body Mass Index
16 - 18,5 6(12,0) 4(8,0) 10(10,0)
18,5 - 24,9 43(86,0) 39(78,0) 82(82,0)
25,0 - 27,0 1(2,0) 7(14,0) 8(8,0)
Blood Pressure
<130/<85 35(70,0) 37(74,0) 72(72,0)
130-139/85-89 15(30,0) 12(24,0) 27(27,0)
≥140/≥90 0(0,0) 1(2,0) 1(1,0)
Blood Cholesterol Level
< 200 33(66,0) 0(0,0) 12(12,0)
200 - 239 16(32,0) 0(0,0) 4(4,0)
59
Appendix 5
a
. Average of food consumption per-capita and per-eater only in all respondent
No Food Groups
Consumption Per-Capita (g/cap/day)
% Total Consumption
Consumption Per-Eater Only (g/cap/day) Num. of
Eater (N=100)
% Eater (N=100)
Mean ± S.D. 95%
tile Min - Max Mean ± S.D.
95%
tile Min - Max
1 Beverages 16.65 ± 27.71 75.35 0.00 - 152.67 1.88 28.22 ± 31.27 83.85 0.13 - 152.67 59 59.0
2 Cereals and Cereal Products
378.01 ± 164.85 692.77 39.02 - 1046.50 42.66 378.01 ± 164.85 692.77 39.02 - 1046.50 100 100.0
3 Egg and Egg Product 8.58 ± 15.60 41.47 0.00 - 88.00 0.97 25.24 ± 17.23 49.20 7.70 - 88.00 34 34.0
4 Fish and Fish Product 1.37 ± 3.63 8.13 0.00 - 24.43 0.15 5.94 ± 5.55 13.33 0.80 - 24.43 23 23.0
5 Fruits and Fruit Products
103.04 ± 106.28 323.93 0.00 - 504.07 11.63 105.14 ± 106.33 327.00 5.60 - 504.07 98 98.0
6 Herbs, Spices, and Condiments
11.91 ± 20.22 56.95 0.00 - 119.00 1.34 13.09 ± 20.84 57.13 0.43 - 119.00 91 91.0
7 Meat and Poultry Products
22.52 ± 32.62 85.58 0.00 - 214.73 2.54 30.84 ± 34.68 90.03 1.82 - 214.73 73 73.0
8 Legumes and Legume Products
85.26 ± 63.89 208.73 0.00 - 385.72 9.62 86.12 ± 63.63 209.63 12.71 - 385.72 99 99.0
9 Plant sterols Fortified Products
0.04 ± 0.30 0.00 0.00 - 2.67 0.00 2.00 ± 0.94 2.60 1.33 - 2.67 2 2.0
10 Snack Fooods 99.07 ± 91.71 253.45 0.00 - 584.55 11.18 101.09 ± 91.53 257.51 0.93 - 584.55 98 98.0
11 Supplements 0.05 ± 0.50 0.00 0.00 - 5.00 0.01 2.50 ± 3.54 4.75 0.00 - 5.00 2 2.0
12 Vegetables and Vegetable Products
159.64 ± 112.93 396.02 0.00 - 575.37 18.02 161.26 ± 112.34 396.57 2.43 - 575.37 99 99.0
60
Appendix 5b. Average of food consumption per-capita and per-eater only in male respondent
No Food Groups
Consumption Per-Capita (g/cap/day)
% Total Consumption
Consumption Per-Eater Only (g/cap/day) No. of Eater (N=50)
% Eater (N=50)
Mean ± S.D. 95%
tile Min - Max Mean ± S.D.
95%
tile Min - Max
1 Beverages 21.88 ± 32.39 79.13 0.00 - 152.67 2.54 32.18 ± 34.87 89.23 0.13 - 152.67 34 68.0
2 Cereals and Cereal Products
377.68 ± 163.24 683.51 39.02 - 798.85 43.77 377.68 ± 163.24 683.51 39.02 - 798.85 50 100.0
3 Egg and Egg Product 6.19 ± 12.03 31.90 0.00 - 49.20 0.72 22.12 ± 12.88 43.87 7.70 - 49.20 14 28.0
4 Fish and Fish Product 1.18 ± 2.91 7.14 0.00 - 13.30 0.14 5.88 ± 3.92 12.11 0.80 - 13.30 10 20.0
5 Fruits and Fruit Products 92.23 ± 103.58 318.65 0.00 - 456.53 10.69 94.12 ± 103.79 322.47 5.60 - 456.53 49 98.0
6 Herbs, Spices, and Condiments
8.79 ± 11.89 30.33 0.00 - 52.00 1.02 10.71 ± 12.33 30.60 1.30 - 52.00 41 82.0
7 Meat and Poultry Products
19.10 ± 27.95 63.50 0.00 - 157.81 2.21 28.08 ± 30.00 71.45 3.42 - 157.81 34 68.0
8 Legumes and Legume Products
78.47 ± 58.21 195.55 0.00 - 289.37 9.09 80.07 ± 57.69 196.91 12.77 - 289.37 49 98.0
9 Plant sterols Fortified Products
0.05 ± 0.38 0.00 0.00 - 2.67 0.01 2.67 ± 0.00 2.67 2.67 - 2.67 1 2.0
10 Snack Fooods 109.72 ± 114.96 340.61 0.00 - 584.55 12.71 111.96 ± 115.04 342.14 0.93 - 584.55 49 98.0
11 Supplements 0.00 ± 0.00 0.00 0.00 - 0.00 0.00 0.00 ± 0.00 0.00 0.00 - 0.00 0 0.0
12 Vegetables and Vegetable Products
147.63 ± 111.32 363.38 0.00 - 456.13 17.11 150.64 ± 110.39 366.94 2.43 - 456.13 49 98.0
61
Appendix 5c. Average of food consumption per-capita and per-eater only in female respondent
No Food Groups
Consumption Per-Capita (g/cap/day)
% Total Consumption
Consumption Per-Eater Only (g/cap/day) No. of Eater (N=50)
% Eater (N=50)
Mean ± S.D. 95%
tile Min - Max Mean ± S.D.
95%
tile Min - Max
1 Beverages 11.42 ± 21.12 47.61 0.00 - 96.00 1.26 22.84 ± 25.28 76.04 0.13 - 96.00 25 50.0
2 Cereals and Cereal Products
378.34 ± 168.09 663.01 134.22 - 1046.50 41.60 378.34 ± 168.09 663.01 134.22 - 1046.50 50 100.0
3 Egg and Egg Product 10.97 ± 18.31 49.20 0.00 - 88.00 1.21 27.42 ± 19.74 51.14 10.27 - 88.00 20 40.0
4 Fish and Fish Product 1.56 ± 4.25 8.92 0.00 - 24.43 0.17 5.99 ± 6.70 17.77 0.80 - 24.43 13 26.0
5 Fruits and Fruit Products 113.84 ± 108.88 315.10 0.00 - 504.07 12.52 116.17 ± 108.75 315.91 7.60 - 504.07 49 98.0
6 Herbs, Spices, and Condiments
15.04 ± 25.79 62.47 0.43 - 119.00 1.65 15.04 ± 25.79 62.47 0.43 - 119.00 50 100.0
7 Meat and Poultry products 25.93 ± 36.67 90.09 0.00 - 214.73 2.85 33.25 ± 38.53 91.55 1.82 - 214.73 39 78.0
8 Legumes and Legume Products
92.05 ± 69.03 211.35 12.71 - 385.72 10.12 92.05 ± 69.03 211.35 12.71 - 385.72 50 100.0
9 Plant sterols Fortified Products
0.03 ± 0.19 0.00 0.00 - 1.33 0.00 1.33 ± 0.00 1.33 1.33 - 1.33 1 2.0
10 Snack Fooods 88.42 ± 59.54 200.10 0.00 - 251.42 9.72 90.23 ± 58.76 200.39 12.45 - 251.42 49 98.0
11 Supplements 0.10 ± 0.71 0.00 0.00 - 5.00 0.01 5.00 ± 0.00 5.00 5.00 - 5.00 1 2.0
12 Vegetables and Vegetable Products
171.66 ± 114.36 395.75 6.33 - 575.37 18.88 171.66 ± 114.36 395.75 6.33 - 575.37 50 100.0
62
Appendix 6. Plant sterols content in every food items consumed by respondents
No Group Sub-Group Food Name
PS content (mg/100 g
food)
Data*) source
1 Beverages - coffee, black 0.00 h
2 Beverages - coffee, with milk 0.00 h
3 Beverages - syrup 0.00 h
4 Beverages -
ENERGEN, instant cereal drink,
chocolate or other flavor 0.00 a
5 Beverages - milk, chocolate, powder 0.00 h
6 Beverages - milk, full cream, powder 0.00 h
7 Beverages - milk, liquid 0.00 a
8 Beverages - sweet condensed milk 0.00 h
9 Beverages - soft drinks 0.00 h
10 Beverages -
syrup ice, served with condensed milk,
black rice, and jackfruit (es doger) 2.49 e
11 Beverages - tea, plain 0.00 h
12 Beverages - tea, prepared with sugar 0.00 h
13 Cereals and cereal p. cereal product, brown rice based rice, brown, boiled 26.80 b
14 Cereals and cereal p. cereal product, corn based corn, grilled 28.50 c**
15 Cereals and cereal p. cereal product, corn based corn, steamed 28.50 c**
16 Cereals and cereal p. cereal product, corn based
corn, steamed, served with grated
coconut 22.13 e
17 Cereals and cereal p. cereal product, oat based oatmeal 44.00 b
18 Cereals and cereal p. cereal product, processed instant, noodle, drained 20.61 e
19 Cereals and cereal p. cereal product, processed instant, noodle, soup 20.61 e
20 Cereals and cereal p. cereal product, rice based rice, black, steamed 26.80 b
21 Cereals and cereal p. cereal product, rice based rice, sticky, fried 43.71 e
22 Cereals and cereal p. cereal product, rice based
rice, sticky, steamed, served with
grated coconut 35.80 e
23 Cereals and cereal p. cereal product, rice based rice, white, boiled 22.50 b
24 Cereals and cereal p. cereal product, rice flour based
rice noodle, with vegetable and soy
sauce, boiled 22.50 a
25 Cereals and cereal p. cereal product, rice flour based
rice noodle, with vegetable and soy
sauce, fried 26.21 e
26 Cereals and cereal p. cereal product, wheat flour based pasta 28.10 b
27 Cereals and cereal p. cereal product, wheat flour based
wheat flour based, chocolate breakfast
cereal 0.00 a
28 Cereals and cereal p. composite food, rice based chicken rice porridge 120.19 e
29 Cereals and cereal p. composite food, rice based rice cake with oncom filling 26.89 e
30 Cereals and cereal p. composite food, rice based
Rice cake with vegetable and coconut
milk soup 35.51 e
31 Cereals and cereal p. composite food, rice based fried rice 20.17 e
32 Cereals and cereal p. composite food, rice based
rice, in coconut milk, served with side
63
No Group Sub-Group Food Name
PS content (mg/100 g
food)
Data*) source
33 Cereals and cereal p. composite food, rice flour based
river rice noodles, with vegetable and
soy sauce, fried 31.81 e
34 Cereals and cereal p.
composite food, wheat flour based
noodle, with vegetable and soy sauce,
fried 25.45 e
35 Cereals and cereal p.
composite food, wheat flour
based noodle, with vegetable soup 14.98 e
36
Cereals and cereal p. dishes with peanut sauce, rice based
rice cake, rice noodles, and tofu, steamed, served with peanut sauce and vegetables
37.91 e
37 Cereals and cereal p.
dishes with peanut sauce, rice
based rice cake, served with peanut sauce 44.91 e
38 Cereals and cereal p.
dishes with peanut sauce, wheat flour based
wheat flour snacks, dim sum, served
with peanut sauce 50.56 e
39 Egg and egg p. fried dishes, egg Egg, whole, cooked, fried 8.00 a
40 Egg and egg p. fried dishes, egg Egg, whole, cooked, omelet 10.00 a
41 Fish and fish p. - carp fish, prepared with spices, fried 18.33 e
42 Fish and fish p. - tilapia fish, prepared with spices, fried 18.33 e
43 Fish and fish p. - fish, salted, fried 6.45 e
44 Fish and fish p. - tuna fish, salted, fried 20.20 e
45 Fruits and fruit p. composite food, mix fruit mix all fruits, served with ice 22.64 e
46 Fruits and fruit p. composite food, mix fruit mix all fruits, served sour soup 9.33 e
47 Fruits and fruit p.
dishes with peanut sauce, mix fruits
mix all fruits, served with peanut sauce
(Rujak) 59.17 e
48 Fruits and fruit p. fruits, processed, dried candied fruit 62.00 a
49 Fruits and fruit p. fruits, raw apples, raw 12.00 a
50 Fruits and fruit p. fruits, raw avocados, raw 83.00 a
51 Fruits and fruit p. fruits, raw avocados, raw, with sugar 83.00 a
52 Fruits and fruit p. fruits, raw bananas, raw 16.00 a
53 Fruits and fruit p. fruits, raw bengkuang, yambeans, raw 10.00 a
54 Fruits and fruit p. fruits, raw coconuts, flesh 47.00 a
55 Fruits and fruit p. fruits, raw custard apple, soursops, raw n.a n.a
56 Fruits and fruit p. fruits, raw
custard apple, soursops, raw, with
sugar n.a n.a
57 Fruits and fruit p. fruits, raw durian n.a n.a
58 Fruits and fruit p. fruits, raw guavas, raw, with sugar n.a n.a
59 Fruits and fruit p. fruits, raw jackfruits, raw n.a n.a
60 Fruits and fruit p. fruits, raw longans, raw n.a n.a
61 Fruits and fruit p. fruits, raw persimmons, raw 4.00 a
62 Fruits and fruit p. fruits, raw rambutans, raw n.a n.a
63 Fruits and fruit p. fruits, raw sapodillas, raw n.a n.a
64 Fruits and fruit p. fruits, raw snakeskin, salak fruits, raw n.a n.a
65 Fruits and fruit p. fruits, raw grapes, raw 4.00 a
66 Fruits and fruit p. fruits, raw guavas, raw n.a n.a
67 Fruits and fruit p. fruits, raw mangos, raw n.a n.a
64
No Group Sub-Group Food Name
PS content (mg/100 g
food)
Data*) source
69 Fruits and fruit p. fruits, raw oranges, raw 22.80 c**
70 Fruits and fruit p. fruits, raw papayas, raw n.a n.a
71 Fruits and fruit p. fruits, raw pears, raw 8.00 a
72 Fruits and fruit p. fruits, raw pineapples, raw 6.00 a
73 Fruits and fruit p. fruits, raw rose apples, raw n.a n.a
74 Fruits and fruit p. fruits, raw strawberries, raw 12.00 a
75 Fruits and fruit p. fruits, raw strawberries, raw, with sugar 10.00 c**
76 Fruits and fruit p. fruits, raw tomatoes, sliced, prepared with sugar 7.00 a
77 Fruits and fruit p. fruits, raw watermelons, raw 2.00 a
78
Herbs, spices, and
condiments condiments chilli sauce 7.00 a
79
Herbs, spices, and
condiments condiments margarine 146.00 a
80
Herbs, spices, and
condiments condiments
chilli and nut paste, prepared with
spices 200.11 e
81
Herbs, spices, and
condiments condiments
chilli and soy sauce, prepared with
spices 29.88 e
82
Herbs, spices, and
condiments condiments
chilli paste, prepared with spices, stir
fried 33.87 e
83
Herbs, spices, and
condiments condiments soy sauce 0.00 h
84
Herbs, spices, and
condiments condiments soybean paste n.a n.a
85
Herbs, spices, and
condiments condiments tomato sauce 7.00 a
86
Herbs, spices, and
condiments condiments turmeric, raw 82.00 a
87
Herbs, spices, and
condiments condiments vinegar 0.00 a
88
Herbs, spices, and
condiments traditional herbal drinks galangal, extract, drinking liquid 0.00 h
89
Herbs, spices, and
condiments traditional herbal drinks ginger, extract, drinking liquid 0.00 h
90
Herbs, spices, and
condiments traditional herbal drinks Indonesian hot spiced drink 0.00 h
91
Herbs, spices, and
condiments traditional herbal drinks mix herbs, extract, drinking liquid 0.00 h
92
Herbs, spices, and
condiments traditional herbal drinks
sour and turmeric, extract, drinking
liquid 0.00 h
93 Legumes and legume p. composite food, oncom based oncom, steamed and spiced 0.00 h
94 Legumes and legume p. composite food, oncom based oncom based, stir fried 1.71 e
95 Legumes and legume p. composite food, peanut based peanut, with salted fish, fried 131.76 e
96 Legumes and legume p. composite food, red bean soup Kidney bean soup 127.00 a
97 Legumes and legume p. composite food, tempe based tempeh, fried 148.23 e
98 Legumes and legume p. composite food, tempe based tempeh, in soy sauce soup, fried 123.14 e
99 Legumes and legume p. composite food, tempe based tempeh, with soy sauce soup 135.18 e
65
No Group Sub-Group Food Name
PS content (mg/100 g
food)
Data*) source
101 Legumes and legume p. composite food, tempe based tempeh in chilli sauce 87.05 e
102 Legumes and legume p. composite food, tofu based
fried tofu, served with spice and sour
sauce 45.64 e
103 Legumes and legume p. composite food, tofu based tofu in red pepper sauce 14.47 e
104 Legumes and legume p. composite food, tofu based tofu, fried 9.49 e
105 Legumes and legume p. composite food, tofu based tofu, in soy sauce soup, fried 11.11 e
106 Legumes and legume p. composite food, tofu based
tofu, steamed and spiced, wrapped in
banana leaf 10.89 e
107 Legumes and legume p. composite food, tofu based tofu, stir fried 0.82 e
108 Legumes and legume p. composite food, tofu based tofu, with soy sauce soup 4.28 e
109 Legumes and legume p. legumes, mung bean based mung bean milk 6.90 a
110 Legumes and legume p. legumes, mung bean based mung bean porridge 15.41 e
111 Legumes and legume p. legumes, other bean, kidney, boiled 127.00 a
112 Legumes and legume p. legumes, other bean, pea, fried 135.00 a
113 Legumes and legume p. legumes, other cashew, roasted 158.00 a
114 Legumes and legume p. legumes, other sunflower seed 534.00 a
115 Legumes and legume p. legumes, peanut based soy bean 50.00 a
116 Legumes and legume p. legumes, peanut based peanut butter 102.00 a
117 Legumes and legume p. legumes, peanut based peanut, fried 205.52 e
118 Legumes and legume p. legumes, peanut based peanut, steamed 220.00 a
119 Legumes and legume p. legumes, soy based soy bean 50.00 a
120 Legumes and legume p. legumes, soy based soy milk 5.56 e
121
Meats and meat p.
including poultry composite food, meat based
meatball with noodle and vegetable in
soup 11.07 e
122
Meats and meat p.
including poultry composite food, meat based spiced meat/meat offal soup 3.77 e
123
Meats and meat p.
including poultry composite food, meat based
spiced meat/meat offal with coconut
milk soup 4.63 e
124
Meats and meat p.
including poultry composite food, meat based spiced noodle soup 8.87 e
125
Meats and meat p.
including poultry composite food, poultry based
chicken, boiled, with coconut milk and
spices soup 2.57 e
126
Meats and meat p.
including poultry composite food, poultry based spiced chicken/chicken offal soup 10.93 e
127
Meats and meat p.
including poultry composite food, poultry based
spiced chicken/chicken offal with
coconut mik soup 7.91 e
128
Meats and meat p. including poultry
dishes with peanut sauce, meat or poultry based
lamb satai, grilled, served with peanut
sauce 61.68 e
129
Meats and meat p. including poultry
dishes with peanut sauce, meat or poultry based
chicken satai, grilled, served with
peanut sauce 63.07 e
130
Meats and meat p.
including poultry fried dishes, meat based
meat, prepared with spices, fried,
steamed 5.55 e
131
Meats and meat p.
including poultry fried dishes, poultry based
chicken, prepared with spices and
flour, fried, steamed 16.97 e
132
Meats and meat p.
including poultry fried dishes, poultry based
chicken, prepared with spices, fried,
steamed 15.58 e
66
No Group Sub-Group Food Name
PS content (mg/100 g
food)
Data*) source
134 Snack food biscuits biscuits, common 30.00 a
135 Snack food biscuits biscuits, with cheese cream 30.00 a
136 Snack food biscuits biscuits, with fruit jam 30.00 a
137 Snack food biscuits biscuits, with peanut butter 49.00 a
138 Snack food biscuits cracker 30.00 a
139 Snack food bread bread, beef floss filling 0.00 a
140 Snack food bread bread, cheese cream filling 0.00 a
141 Snack food bread bread, chocolate filling 0.00 a
142 Snack food bread bread, fruit jam filling 0.00 a
143 Snack food bread
bread, margarine and chocolate rice
filling 0.00 a
144 Snack food bread bread, mung bean filling 0.00 a
145 Snack food dessert cheese sauce 11.00 a
146 Snack food dessert pudding 0.00 a
147 Snack food fried snacks, plantain based chips, plantain, fried 21.78 e
148 Snack food fried snacks, plantain based plantain, wheat flour, fried 23.69 e
149 Snack food fried snacks, rice flour based rice flour, fried 6.87 e
150 Snack food fried snacks, rice flour based rice, fried 59.16 e
151 Snack food fried snacks, rice flour based snacks, flour based, deep fried 35.63 e
152 Snack food fried snacks, rice flour based
traditional cake, rice flour with palm
sugar, fried (kue cucur) 33.79 e
153 Snack food fried snacks, soy based oncom based, with wheat flour, fried 100.23 e
154 Snack food fried snacks, soy based tempeh based, wheat flour, fried 133.53 e
155 Snack food fried snacks, soy based
tofu based, wheat flour, filled with
sprout and vegetables, fried 12.98 e
156 Snack food fried snacks, soy based tofu based, wheat flour, fried 11.54 e
157 Snack food fried snacks, tuber based
cassava cake with oncom and spices,
fried 6.87 e
158 Snack food fried snacks, tuber based cassava cake, fried 6.21 e
159 Snack food fried snacks, tuber based cassava, fried 38.95 e
160 Snack food fried snacks, tuber based chips, cassava, fried 12.00 a
161 Snack food fried snacks, tuber based taro, fried 24.43 e
162 Snack food fried snacks, tuber based
traditional snack, cassava cake with
palm sugar, fried 6.87 e
163 Snack food fried snacks, tuber based chips, potato, fried 34.00 a
164 Snack food fried snacks, tuber based french fries 0.00 a
165 Snack food fried snacks, tuber based chips, sweet potato, fried 12.00 a
166 Snack food fried snacks, tuber based sweet potato cake, fried 18.01 e
167 Snack food fried snacks, tuber based sweet potato, fried 18.85 e
168 Snack food fried snacks, tuber based chips, taro, fried 20.64 e
169 Snack food fried snacks, wheat flour based
bread, with chocolate or fruit jam
filling, fried 10.70 e
170 Snack food fried snacks, wheat flour based
fried mix vegetable, with wheat flour,
67
No Group Sub-Group Food Name
PS content (mg/100 g
food)
Data*) source
171 Snack food fried snacks, wheat flour based
doughnut, fried, served with margarine
and chocolate rice topping 48.36 e
172 Snack food fried snacks, wheat flour based
snacks, flour based, prepared with
peanut, deep fried 131.74 e
173 Snack food fried snacks, wheat flour based
snacks, flour based, prepared with
salted fish, deep fried 18.97 e
174 Snack food fried snacks, wheat flour based traditional snack, wheat flour, fried 53.07 e
175 Snack food fried snacks, wheat flour based
wheat flour based, banana and
chocolate rice, fried 31.64 e
176 Snack food fried snacks, wheat flour based
wheat flour based, egg and vegetables,
fried 37.02 e
177 Snack food fried snacks, wheat flour based
wheat flour based, filled with rice
noodle and vegetables, fried 10.09 e
178 Snack food fried snacks, wheat flour based
wheat flour based, filled with
vegetables or egg, fried 24.28 e
179 Snack food fried snacks, wheat flour based wheat flour based, sweet corn, fried 33.09 e
180 Snack food other bakery wares cake, common 28.00 b
181 Snack food other bakery wares cookies 0.00 a
182 Snack food other bakery wares
pancake, with cheese and condensed
milk 42.65 e
183 Snack food other bakery wares
pancake, with peanut, chocolate rice,
and sugar 73.96 e
184 Snack food other bakery wares
pancake, with sticky rice and
condensed milk 66.75 e
185 Snack food other bakery wares wafers, chocolate 37.20 b
186 Snack food other bakery wares pancake, plain 1.58 e
187 Snack food sweets chocolate rice 59.00 a
188 Snack food sweets milk chocolate 59.00 a
189 Snack food traditional cake and snacks
traditional cake, cassava based,
steamed (Ketimus) 0.00 e
190 Snack food traditional cake and snacks
traditional cake, cassava, mashed,
steamed (Getuk) n.a n.a
191 Snack food traditional cake and snacks
traditional cake, rice flour and grated
coconut, pan fried (Kue Pancong) 31.21 e
192 Snack food traditional cake and snacks
traditional cake, rice flour based,
steamed (Kue Lopis) 31.32 e
193 Snack food traditional cake and snacks
traditional cake, rice flour, steamed
(Kue Apem) 14.80 e
194
Snack food traditional cake and snacks
traditional cake, pie, mung bean/chocolate/black bean filling (Kue Pia)
18.80 e
195 Snack food traditional cake and snacks
traditional cake, spekkoek, layer cake
(Lapis Legit) 68.45 e
196 Snack food traditional cake and snacks
traditional cake, wheat flour and
banana, steamed (Nagasari) 8.00 e
197 Snack food traditional cake and snacks
traditional cake, wheat flour pan fried
(Kue Ape) 13.55 e
198 Supplements - chlorophyll drink 0.00 h
68
No Group Sub-Group Food Name
PS content (mg/100 g food) Data*) source 200 Vegetables and vegetable p.
composite food, mix vegetables
soup mix all vegetables soup, soup only 6.61 e
201
Vegetables and vegetable p.
composite food, mix vegetables
soup mix all vegetables, served sour soup 28.72 e
202
Vegetables and vegetable p.
composite food, mix vegetables
soup mix all vegetables, soup 12.83 e
203
Vegetables and vegetable p.
composite food, mix vegetables
soup mix vegetables in coconut milk soup 44.83 e
204
Vegetables and vegetable p.
composite food, mix vegetables soup
mix vegetables soup, with
chicken/meat/meatball added 9.10 e
205
Vegetables and vegetable p.
composite food, mix vegetables
soup Mixed vegetables sour soup 41.12 e
206
Vegetables and vegetable p.
composite food, mix vegetables soup
rice noodle and sprout spicy soup, with or without chicken/prawn/meat/egg added (laksa)
10.68 e
207
Vegetables and vegetable p.
composite food, mix vegetables soup
mix all vegetables, served with vinegar
and onion 19.75 e
208
Vegetables and vegetable p.
composite food, mix vegetables, steamed
mix all vegetables, steamed, served
with grated coconut 7.83 e
209
Vegetables and vegetable p.
composite food, mix vegetables,
stir fried mix all vegetables, stir fried 10.83 e
210
Vegetables and vegetable p.
dishes with peanut sauce, mix vegetable
mix all vegetables, served with peanut
sauce (Gado-gado) 34.80 e
211
Vegetables and vegetable p.
dishes with peanut sauce, mix vegetable
mix all vegetables, served with peanut
sauce (Karedok) 41.25 e
212
Vegetables and vegetable p.
dishes with peanut sauce, mix vegetable
mix all vegetables, served with peanut
sauce (Pecel) 61.04 e
213
Vegetables and
vegetable p. vegetables, processed, fermented cassava, fermented 0.00 h
214
Vegetables and
vegetable p. vegetables, processed, fried
potato in chilli sauce, with or without
chicken oval 5.49 e
215
Vegetables and
vegetable p. vegetables, processed, fried
potato, mashed, battered with egg,
fried 9.51 e
216
Vegetables and
vegetable p. vegetables, processed, fried sweet potato, mashed, fried 28.22 e
217
Vegetables and
vegetable p. vegetables, processed, steamed sweet potato, steamed 12.00 a
218
Vegetables and vegetable p.
vegetables, processed, steamed or boiled
jackfruit, boiled, with coconut milk
soup 2.15 e
219
Vegetables and vegetable p.
vegetables, processed, steamed
or boiled oyong, soup 18.16 e
220
Vegetables and vegetable p.
vegetables, processed, steamed
or boiled cucumbers, stir fried 21.96 e
221
Vegetables and vegetable p.
vegetables, processed, steamed
or boiled cassava leaves, with soup 0.44 e
222
Vegetables and vegetable p.
vegetables, processed, steamed
or boiled chinese cabbage, boiled, with soup 11.41 e
223
Vegetables and vegetable p.
vegetables, processed, steamed
or boiled katuk leaf, soup 8.30 e
224
Vegetables and vegetable p.
vegetables, processed, steamed
69
No Group Sub-Group Food Name
PS content (mg/100 g food) Data*) source 225 Vegetables and vegetable p.
vegetables, processed, steamed or boiled
spinach, boiled, with soup,
with/without corn added 8.20 e
226
Vegetables and vegetable p.
vegetables, processed, steamed
or boiled bamboo shoots, stir fried 10.82 e
227
Vegetables and vegetable p.
vegetables, processed, steamed
or boiled cassava, steamed n.a n.a
228
Vegetables and vegetable p.
vegetables, processed, steamed or boiled
cassava, steamed, mashed, served with
grated coconut 3.36 e
229
Vegetables and vegetable p.
vegetables, processed, steamed
or boiled potato, steamed 5.00 a
230
Vegetables and vegetable p.
vegetables, processed, steamed
or boiled taro, steamed 19.00 a
231
Vegetables and vegetable p.
vegetables, processed, steamed or boiled
taro, steamed, mashed, served with
grated coconut 20.19 e
232
Vegetables and vegetable p.
vegetables, processed, steamed
or boiled cassava, boiled, with soy sauce soup 8.15 e
233
Vegetables and vegetable p.
vegetables, processed, steamed or boiled
sweet potato, boiled with palm sugar
and coconut milk 6.42 e
234
Vegetables and
vegetable p. vegetables, processed, stir fried bitter gourd, stir fried 1.74 e
235
Vegetables and
vegetable p. vegetables, processed, stir fried eggplant in chilli sauce 15.62 e
236
Vegetables and
vegetable p. vegetables, processed, stir fried eggplants, stir fried 6.47 e
237
Vegetables and
vegetable p. vegetables, processed, stir fried paprika, stir fried 175.00 a
238
Vegetables and
vegetable p. vegetables, processed, stir fried brassica leaves, stir fried 23.35 e
239
Vegetables and
vegetable p. vegetables, processed, stir fried brocolli, stir fried 24.46 e
240
Vegetables and
vegetable p. vegetables, processed, stir fried cabbage, stir fried 11.26 e
241
Vegetables and
vegetable p. vegetables, processed, stir fried cauliflower, stir fried 12.71 e
242
Vegetables and
vegetable p. vegetables, processed, stir fried fern leaves, stir fried 1.80 e
243
Vegetables and
vegetable p. vegetables, processed, stir fried water spinach, stir fried 17.01 e
244
Vegetables and
vegetable p. vegetables, processed, stir fried yellow velvetleaf, stir fried 2.15 e
245
Vegetables and
vegetable p. vegetables, processed, stir fried beans, broadbeans, steamed 35.00 a
246
Vegetables and
vegetable p. vegetables, processed, stir fried beans, broadbeans, green, stir fried 39.60 e
247
Vegetables and
vegetable p. vegetables, processed, stir fried beans, longbean, stir fried 27.15 e
248
Vegetables and
vegetable p. vegetables, processed, stir fried sprout, stir fried 11.08 e
249
Vegetables and
vegetable p. vegetables, processed, stir fried chayote, steamed 12.00 a
70
No Group Sub-Group Food Name
PS content (mg/100 g
food)
Data*) source
vegetable p.
251
Vegetables and
vegetable p. vegetables, processed, stir fried chayote, stir fried 13.67 e
252
Vegetables and
vegetable p. vegetables, raw carrot, raw 12.00 i**
253
Vegetables and
vegetable p. vegetables, raw cucumbers, raw 14.00 a
254
Vegetables and
vegetable p. vegetables, raw eggplants, raw 7.00 a
255
Vegetables and
vegetable p. vegetables, raw tomatoes, raw 7.00 a
256
Vegetables and
vegetable p. vegetables, raw allspice, raw n.a n.a
257
Vegetables and
vegetable p. vegetables, raw bamboo shoots, raw 19.00 a
258
Vegetables and
vegetable p. vegetables, raw basil leaves, raw 106.00 a
259
Vegetables and
vegetable p. vegetables, raw brocolli, raw 36.70 c**
260
Vegetables and
vegetable p. vegetables, raw cabbages, raw 11.00 a
261
Vegetables and
vegetable p. vegetables, raw Lettuce, green leaf, raw 38.00 a
262
Vegetables and
vegetable p. vegetables, raw cassava leaves, steamed n.a n.a
263
Vegetables and
vegetable p. vegetables, raw chinese cabbage, steamed 13.00 c**
264
Vegetables and
vegetable p. vegetables, raw papaya leaves, steamed n.a n.a
265
Vegetables and
vegetable p. vegetables, raw water spinach, steamed 9.00 a
*) note:
a = USDA SR-24 b = Normen et al. 2002 c = Piironen et al. 2003
d = http://cholesterol.about.com/od/dietitiansadvice/a/spices.htm e = calculation based on recipe
f = commercial product available in the market h = considered contained zero phytosterol i = Piironen and Lampi 2004 in Dutta 2004 n.a = data not available
**) note:
71
Appendix 7. Plant sterols content based on calculation of recipe
No Food
Group Sub-Group Food Item Composition
PS Content (mg/100 g)
% composition in food item
Estimated PS content (mg/100 g food item) 1 BEVERAGES
- syrup ice, served with condensed milk, black rice, and jackfruit (es doger)
syrup 0 43.02 2.49
sweetened condensed milk 0 9.3
syrup 0 5.81
water 0 23.26
fermented cassava 0 9.3
black rice 26.8 9.3
2 CEREALS AND CEREAL PRODUCT cereal product,
corn based
corn, steamed, served
with grated coconut sweet corn 28.5 66.67 22.13
sugar 0 26.67
coconut 47 6.67
cereal product, rice based
rice, sticky, fried glutinous rice 35.5 86.21 43.71
cooking oil 95 13.79
rice, sticky, steamed, served with grated coconut
glutinous rice 35.5 97.4 35.8
coconut 47 2.6
cereal product, rice flour based
rice noodle, with vegetable and soy sauce,
fried rice noodle 22.5 61.59 26.21
seasoning 12.61 29.29
cooking oil 95 9.12
composite food, rice based
fried rice eggs 0 22.48 20.17
white rice 35.5 44.95
fried rice seasoning 11.03 31.84
cooking oil 95 0.74
rice cake with oncom
filling oncom 0 24.24 26.89
white rice 35.5 75.76
Rice cake with vegetable
and coconut milk soup rice cake soup seasoning 15.85 35.5 60.49 14.76 35.51
chayote 12 13.75
condiment 38.82 2.29
crackers 35.63 6.42
fried onions 299.98 2.29
rice, in coconut milk,
served with side dishes rice 35.5 38.22 16.83
seasoning 0.74 48.91
rice noodle 22.5 12.87
chicken rice porridge rice porridge 17.75 62.96 120.19
chicken porridge soup 9.04 38.3
fried onions 299.98 3.44
fried soybean 161 14.27
shredded chicken 0 53.24
celery 6 8.9
crackers 35.63 54.69
chilli sauce 38.82 43.1
rice cake 35.5 100
composite food, rice flour based
river rice noodles, with vegetable and soy sauce, fried
kwetiaw 28.1 33.18 31.81
cooking oil 95 14.93
cabbage 14.8 5.31
chinese cabbage 13 6.97
salt 0 0.14
72
No Food
Group Sub-Group Food Item Composition
PS Content (mg/100 g)
% composition in food item
Estimated PS content (mg/100 g food item)
chili 83 7.96
eggs 0 9.12
composite food, wheat flour based
noodle, with vegetable
and soy sauce, fried dried noodles 20.61 73.1 25.45
leeks 19.4 4.39
cesim 13 7.31
cabbage 14.8 7.31
cooking oil 95 7.89
noodle, with vegetable
soup dried noodles 20.61 53.86 14.98
eggs 0 29.62
pepper 92 2.69
sugar 0 2.69
salt 0 0.36
chinese cabbage 13 10.77
dishes with peanut sauce, rice based
rice cake, rice noodles, and tofu, steamed, served with peanut sauce and vegetables
rice noodle 22.5 11.61 37.91
rice cake 35.5 13.55
tofu #N/A 13.55
bean sprouts 15 19.36
crackers 35.63 3.87
peanut sauce 68.84 38.06
rice cake, served with
peanut sauce rice cake 35.5 71.77 44.91
peanut sauce 68.84 28.23
dishes with peanut sauce, wheat flour based
wheat flour snacks, dim sum, served with peanut sauce
what flour snacks, dim
sum, fried 28.1 44.86 50.56
peanut sauce 68.84 55.14
3 FISH AND FISH PRODUCTS
- carp fish, prepared with
spices, fried carp fish 3 83.33 18.33
cooking oil 95 16.67
fish, salted, fried salted fish 3 96.25 6.45
cooking oil 95 3.75
tilapia fish, prepared with
spices, fried Tilapia 3 83.33 18.33
cooking oil 95 16.67
tuna fish, salted, fried tuna 3 81.3 20.2
cooking oil 95 18.7
4 FRUIT AND FRUIT PRODUCTS
composite food, mix fruit
mix all fruits, served sour
soup cucumber 14 25.37 9.33
pineapple 6 23.79
yam beans 10 23.79
guava #N/A 23.79
pickled soup 60.36 3.27
mix all fruits, served with
ice jackfruit #N/A 15.5 22.64
jelly powder 0 10.65
avocado 83 21.79
coconut 47 9.69
mango #N/A 9.69
seaweed #N/A 32.69
dishes with peanut sauce, mix fruits
mix all fruits, served with
peanut sauce (Rujak) cucumber 14 21.62 59.17
guava #N/A 21.62
mango #N/A 10.81
yam beans 10 10.81
73
No Food
Group Sub-Group Food Item Composition
PS Content (mg/100 g)
% composition in food item
Estimated PS content (mg/100 g food item)
peanut sauce 200.11 27.03
5 HERBS, SPICES, AND CONDIMENTS condiments chilli and nut paste,
prepared with spices peanuts 220 86.34 200.11
cayenne pepper 83 5.74
cayenne pepper 83 6.48
garlic 1 1.44
chilli and soy sauce,
prepared with spices cayenne pepper 83 36 29.88
soy sauce 0 64
chilli paste, prepared
with spices, stir fried cayenne pepper red cayenne pepper 83 83 27.96 8.26 33.87
garlic 1 4.14
red onion 5 20.7
tomatoes 7 38.94
6 MEATS AND MEAT PRODUCTS INCLUDING POULTRY AND GAME composite food,
meat based
meatball with noodle and
vegetable in soup Meatball 0 55.94 11.07
fried onions 299.98 1.12
rice noodle 22.5 11.19
yellow noodles 20.61 11.19
mustard 13 8.39
celery 6 0.56
meatball soup 15.68 3.22
bean sprouts 15 8.39
spiced meat/meat offal soup
soto soup 11.67 19.76 3.77
chicken oval 0 32.75
potato 5 10.92
tomatoes 7 8.73
celery 6 0.55
coconut milk 1 27.29
spiced meat/meat offal
with coconut milk soup spicy soup 11.67 18.26 4.63
beef 0 30.27
gnetum gnemon cracker 35.63 2.52
celery 6 0.5
potato 5 15.14
tomatoes 7 8.07
coconut milk 1 25.23
spiced noodle soup soto soup 11.67 19.23 8.87
kikil 0 26.57
raw noodle 20.61 21.25
lumpia 7.66 15.94
tomatoes 7 7.97
potato 5 7.97
celery 6 1.06
composite food, poultry based
spiced chicken/chicken
offal soup spicy soup 11.67 31.7 10.93
chicken 0 30.65
fried onions 299.98 1.75
potato 5 26.27
tomatoes 7 8.76
celery 6 0.88
spiced chicken/chicken offal with coconut mik soup
spicy soup 11.67 22.05 7.91
coconut milk 1 30.45
chicken 0 21.32
74
No Food
Group Sub-Group Food Item Composition
PS Content (mg/100 g)
% composition in food item
Estimated PS content (mg/100 g food item)
potato 5 18.27
tomatoes 7 6.09
celery 6 0.61
chicken, boiled, with coconut milk and spices soup
chicken 0 54.31 2.57
seasoning 5.62 45.69
dishes with peanut sauce, meat or poultry based
lamb satai, grilled, served
with peanut sauce mutton 3 10.88 61.68
peanut sauce 68.84 89.12
chicken satai, grilled,
served with peanut sauce chicken 0 8.39 63.07
peanut sauce 68.84 91.61
fried dishes, meat based
meat, prepared with
spices, fried, steamed beef 0 94.16 5.55
cooking oil 95 5.84
fried dishes, poultry based
chicken, prepared with spices and flour, fried, steamed
chicken 0 68.49 16.97
fried chicken seasoning 40.08 6.57
cooking oil 95 10.96
wheat 28.1 13.98
chicken, prepared with
spices, fried, steamed chicken 0 78.31 15.58
fried chicken seasoning 40.08 9.16
cooking oil 95 12.53
7 LEGUMES AND LEGUME PRODUCT composite food,
oncom based
oncom based, stir fried oncom 0 73.31 1.71
stir-fry seasoning 5.36 26.42
basil 106 0.27
composite food, peanut based
peanut, with salted fish, fried
peanuts 220 54.46 131.76
anchovy 3 34.04
cooking oil 95 11.5
composite food, tempe based
tempeh in chilli sauce tempeh 161 43.15 87.05
Balado spice 21.88 49.82
cooking oil 95 7.03
tempeh, fried tempeh 161 80.65 148.23
cooking oil 95 19.35
tempeh, in soy sauce
soup, fried tempeh 161 75.06 123.14
seasoning sauce 9.21 24.94
tempeh, with soy sauce soup
tempeh 161 81.68 135.18
flavoring stews 20.05 18.32
tempeh, with soy sauce,
stir fried red onion 5 16.09 24.1
garlic 1 2.76
cayenne pepper 83 2.48
galangal 0 2.48
bay leaves 0 0
soy sauce 0 9.93
cooking oil 95 8.31
tempeh 7.1 57.95
composite food, tofu based
fried tofu, served with
spice and sour sauce tofu #N/A 33.71 45.64
peanut sauce 68.84 66.29
tofu in red pepper sauce tofu #N/A 42.73 14.47
spicy seasoning 21.88 54.62
cooking oil 95 2.65
75
No Food
Group Sub-Group Food Item Composition
PS Content (mg/100 g)
% composition in food item
Estimated PS content (mg/100 g food item)
cooking oil 95 9.99
tofu, in soy sauce soup,
fried tofu #N/A 65.65 11.11
seasoning sauce 9.21 25.09
cooking oil 95 9.26
tofu, steamed and spiced,
wrapped in banana leaf tofu #N/A 56.89 10.89
spiced seasoning 25.27 43.11
tofu, stir fried tofu #N/A 84.73 0.82
stir-fry seasoning 5.36 15.27
tofu, with soy sauce soup tofu #N/A 78.65 4.28
flavoring stews 20.05 21.35
legumes, mung bean based
mung bean porridge green bean 23 23.58 15.41
coconut milk 1 33.75
black rice 26.8 36
white bread 0 6.66
legumes, peanut based
peanut, fried
peanuts 220 88.42 205.52
cooking oil 95 11.58
8 SNACK FOOD fried snacks, plantain based
chips, plantain, fried banana 16 92.68 21.78
cooking oil 95 7.32
plantain, wheat flour,
fried banana 16 75.02 23.69
wheat 28.1 18
cooking oil 95 6.98
fried snacks, rice flour based
rice flour, fried rice flour 0 92.76 6.87
cooking oil 95 7.24
rice, fried glutinous rice 35.5 60.24 59.16
cooking oil 95 39.76
snacks, flour based, deep
fried composite flour 0 62.5 35.63
cooking oil 95 37.5
traditional cake, rice flour with palm sugar, fried (kue cucur)
wheat 28.1 12.2 33.79
cornflour 22.5 73.17
cooking oil 95 14.63
fried snacks, soy based
oncom based, with wheat
flour, fried oncom 0 60.31 100.23
fried flour dough 9.29 56.27
cooking oil 95 100
tempeh based, wheat
flour, fried tempeh 161 68.62 133.53
spices fried tempeh 17.44 8.72
cooking oil 95 22.66
tofu based, wheat flour, filled with sprout and vegetables, fried
tofu #N/A 54.35 12.98
fried flour dough 9.29 10.87
bean sprouts 15 17.39
carrots 12 8.7
cabbage 14.8 8.7
cooking oil 95 7.4
tofu based, wheat flour,
fried tofu #N/A 75.97 11.54
wheat 28.1 16.88
cooking oil 95 7.15
fried snacks, tuber based
cassava cake with oncom
and spices, fried cassava #N/A 63.47 6.87
76
No Food
Group Sub-Group Food Item Composition
PS Content (mg/100 g)
% composition in food item
Estimated PS content (mg/100 g food item)
cooking oil 95 7.24
cassava cake, fried cassava #N/A 93.46 6.21
cooking oil 95 6.54
cassava, fried cassava #N/A 59 38.95
cooking oil 95 41
chips, taro, fried taro 19 97.85 20.64
cooking oil 95 2.15
sweet potato cake, fried sweet potato 12 92.76 18.01
cooking oil 95 7.24
sweet potato, fried sweet potato 12 91.74 18.85
cooking oil 95 8.26
taro, fried taro 19 92.85 24.43
cooking oil 95 7.15
traditional snack, cassava cake with palm sugar, fried
cassava #N/A 77.3 6.87
brown sugar 0 15.46
cooking oil 95 7.24
fried snacks, wheat flour based
bread, with chocolate or
fruit jam filling, fried white bread strawberry jam 12 0 80 10 10.7
cooking oil 95 10
doughnut, fried, served with margarine and chocolate rice topping
wheat 28.1 74.21 48.36
margarine 146 11.13
meses 59 7.42
cooking oil 95 7.24
fried mix vegetable, with
wheat flour, fried cabbage 14.8 20.06 17.39
carrots 12 20.06
leeks 19.4 2.51
fried flour dough 9.29 50.14
cooking oil 95 7.24
snacks, flour based, prepared with peanut, deep fried
peanuts 220 40.14 131.74
wheat 28.1 20.07
cooking oil 95 39.8
snacks, flour based, prepared with salted fish, deep fried
wheat 28.1 47.85 18.97
anchovy 3 47.85
cooking oil 95 4.31
traditional snack, wheat
flour, fried wheat 28.1 35.71 53.07