EFFECT OF MICROWAVE HEATING POWER ON PECTIN EXTRACTION
OF SUGAR PALM SEED (Arenga westerhoutii Griff.)
Taufiq Rais1, Sedarnawati Yasni1, Phunsiri Suthiluk2
1Departement of Food Science and Technology, Faculty of Agricultural Technology, Bogor Agricultural
University, IPB Darmaga Campus, PO. BOX 220, Bogor, West Java, Indonesia
2School of Agro-Industry, Mae Fah Luang University, Muang, Chiang Rai 57100, Thailand
ABSTRACT
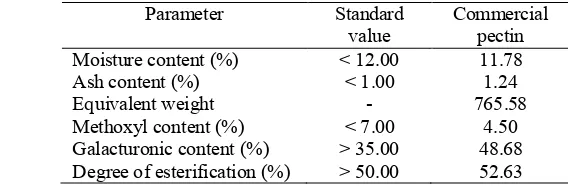
Microwave-Assisted Extraction (MAE) has been employed as the new method to improve quality and yield of extracted pectin. Pectin is a polysaccharide, also known as a water-soluble fiber. The major use of pectin is as a gelling, stabilizing, and thickening agent in food systems. Each year, South East Asia countries have to import pectin because of the lack ability to produce pectin. Sugar palm seed is abundant in South East Asia and contain a large amount of dietary fiber, but the utilization of this commodity is still limited. The objective of this research is to determine the optimum extraction condition using microwave assisted extraction in relation to yield and quality of pectin. In this research, pectin extraction was performed using young sugar palm seed as raw materials. The effect of microwave power and extraction time on the yield of pectin was investigated. It was found that the yield of pectin ranged between 20.50-39.31%. The highest yield of extraction obtained from pectin with microwave power 800 W for 7 minutes and the lowest yield obtained on extraction with microwave power 600 W for 3 minutes. Moreover, moisture content of pectin ranged between 9.58-11.83% and ash content ranged between 0.74-0.94% which is still meet the standard of pectin (less than 12% and 1%, respectively). The equivalent weight and methoxyl content of extracted pectin ranged between 847.95-1431.69 and 4.07-6.43%, respectively. The extracted pectin from sugar palm seed was categorized as Low Methoxyl Pectin (LMP) because its methoxyl content was below 7%. Other characteristics were galacturonic content and degree of esterification which is ranged between 34.64-57.11% and 63.93-72.97%, respectively. The comparison between extracted pectin and commercial pectin showed that characteristics of extracted pectin from sugar palm seed were better than commercial low methoxyl pectin. The methoxyl content of commercial low methoxyl pectin was 4.50%, so the extracted pectin was still better because it had methoxyl content below commercial pectin. It can be concluded that pectin from sugar palm seed had a good quality and had a potential to be developed become commercial pectin.
Taufiq Rais. F24080055. Effect on Microwave Heating Power on Pectin Extraction of Sugar Palm Seed (Arenga westerhoutii Griff.). Supervised by Sedarnawati Yasni, Phunsiri Suthiluk. 2013
SUMMARY
Pectin is natural polymer in all plants, which have been discovered in the 18th century (Whister and Miller 1997). The major use of pectin is as a gelling, stabilizing, and thickening agent in food systems such as jams and jellies, confectionery, and fruit juice. Each year, Thailand has to import at least 200 million baht valued-pectin because the production of pectin in the country is not enough (Rungrodnimitchai et al. 2008). Moreover, Indonesia in 2008 imported 670.410 tons of pectin (BPS North Sumatera 2010). So it must be concerned that development of pectin from raw material that indigenous in South East Asia can be an alternative for reducing the import of pectin.
Sugar palm is commonly found growing wild in primary and secondary forests in Southeast Asia, but the utilization of this commodity is still limited. Based on research that conducted by Suthiluk et al. (2011), the manufacture of sugar palm seed jam does not require addition of pectin. This gave us the idea that there would be plenty of pectin in sugar palm seed. Recently, dielectric heating or microwave heating becomes attractive technique for improving extraction yield and quality of pectin from various source (Kratchanova et al. 2004). Microwave-assissted extraction (MAE) led to higher pectin yield and higher values for degree of esterification (DE) and gel strength compared with the no-pretreated samples (Kratchanova et al. 1994). So the objectives of this research were to determine the optimum extraction condition using microwave assisted extraction in relation to yield and quality of pectin and to examine the quality of extracted pectin compared to commercial pectin.
Main ingredient that used in this research was sugar palm (Arenga westerhoutii Griff.) seed that stored in -20 oC. This research was divided into two parts. The first part was extraction of pectin from raw
material (young endosperm of sugar palm seed) using microwave-assisted extraction. The second part was characterization of pectin including determination of moisture content, ash content, equivalent weight, galacturonic acid content, degree of esterification, and comparison of extracted pectin to commercial pectin. Microwave power used in this study was 600 W and 800 W, while the extraction time used in this study was 3 minutes, 5 minutes, and 7 minutes.
The yield of pectin from young sugar palm seed of Arenga westerhoutii Griff. ranged between 20.50-39.31%. The highest yield obtained from extraction with microwave power of 800 W for 7 minutes and the lowest yield obtained in the extraction with microwave power of 600 W for 3 minutes. The improvements in yield were proportional to the power and duration of microwave heating. The longer contact between the material and solvent will provide greater opportunities to hydrolyze protopectin contained in the material so as to increase the yield of pectin. The higher microwave power would effect on increasing extraction temperature and kinetics of protopectin hydrolysis reaction increased so the resulting pectin yield also increases.
The value of moisture content ranged from 9.58-11.83%. Moisture content of the samples are still in the range of values that are allowed by The Council of European Communities (1998) that it should not be more than 12%. The higher microwave power and the longer extraction time will increase the amount of water which evaporates during the extraction process thus simplifying the drying process resulted in the low levels of moisture content inside the pectin. Ash content of pectin powder obtained ranged between 0.74-0.94%. Ash content of pectin extracted from sugar palm seed were still below the maximum values by The Council of European Communities (1998) that it should not be more than 1%. The improvements in ash content were proportional to the power and duration of microwave heating. This is caused by ability of acid to dissolve the natural mineral materials that increase concentrations of acid, temperature, and reaction time. Dissolved minerals will also precipitate and mixed with pectin in precipitation step with alcohol.
temperature. The range of methoxyl content from this pectin was 4.07-6.90% which below than 7%, so pectin from sugar palm seed could be categorized as Low Methoxyl Pectin (LMP).
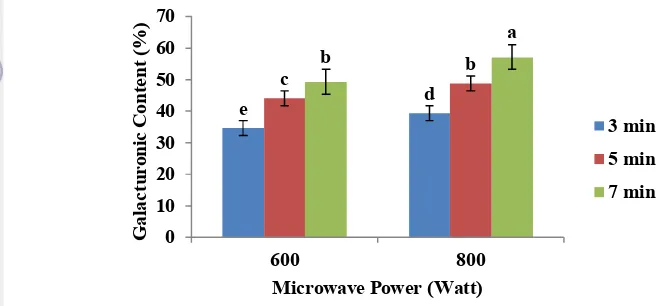
Galacturonic acid content of extracted pectin ranged from 35.43-59.96%. The results showed that the galacturonic content will increase when microwave power and extraction time are increased. This is due to the length of the protopectin hydrolysis reaction, so that the galacturonic levels produced are also increase. Esterification degree of pectin showed ranged from 64.12-69.03%. The high temperature (microwave power) and the length of the extraction process could cause degradation of methyl ester group in pectin to become a carboxyl acid by the acid.
29 Appendix 1a. Result of effect of microwave power and extraction time to yield analysis
Microwave
Power Extraction time 1 Yield (%) 2 3 Means 600 Watt 3 minutes 20.28 20.63 20.60 20.50 ± 0.20d
600 Watt 5 minutes 30.40 29.82 29.40 29.87 ± 0.50bc
600 Watt 7 minutes 31.94 32.20 32.02 32.05 ± 0.14b
800 Watt 3 minutes 26.20 25.80 26.20 26.07 ± 0.23c
800 Watt 5 minutes 31.27 31.00 31.35 31.21 ± 0.18bc
800 Watt 7 minutes 39.53 39.04 39.36 39.31 ± 0.24a
- The same letter means it is not different significantly (α=0.05)
Appendix 1b. Analysis of variance of yield
Tests of Between-Subjects Effects Dependent Variable:Yield
Source Type III Sum of Squares df Mean Square F Sig.
Model 16565.956a 6 2760.993 348.841 .000
Power 102.150 1 102.150 12.906 .004
Time 459.404 2 229.702 29.022 .000
Power * Time 26.833 2 13.417 1.695 .225
Error 94.977 12 7.915
Total 16660.933 18
a. R Squared = .994 (Adjusted R Squared = .991)
Appendix 1c. Post-hoc analysis effect of extraction time to yield Duncana,,b
Time N
Subset
1 2 3
3minutes 6 23.3200
5minutes 6 30.4117
7minutes 6 35.6483
Sig. 1.000 1.000 1.000
Means for groups in homogeneous subsets are displayed. Based on observed means.
30 Appendix 2a. Result of effect of microwave power and extraction time to moisture content analysis
Microwave
Power Extraction time 1 Moisture content (%) 2 3 Means 600 Watt 3 minutes 12.15 11.45 1.66 11.75 ± 0.36a
600 Watt 5 minutes 11.46 11.72 11.63 11.60 ± 0.13a
600 Watt 7 minutes 11.08 11.00 10.95 11.01 ± 0.07b
800 Watt 3 minutes 12.11 11.65 11.74 11.83 ± 0.24a
800 Watt 5 minutes 10.90 10.73 10.98 10.87 ± 0.23b
800 Watt 7 minutes 9.48 9.60 9.68 9.58 ± 0.10c
- The same letter means it is not different significantly (α=0.05)
Appendix 2b. Analysis of variance of moisture content
Tests of Between-Subjects Effects Dependent Variable:Moisture
Source Type III Sum of Squares df Mean Square F Sig.
Model 2232.261a 6 372.044 9433.419 .000
Power 2.156 1 2.156 54.674 .000
Time 6.851 2 3.425 86.853 .000
Power * Time 1.699 2 .849 21.537 .000
Error .473 12 .039
Total 2232.735 18
31 Appendix 2c. Post-hoc analysis effect of extraction time to moisture content
Duncana,,b
Time N
Subset
1 2 3
7minutes 6 10.2983
5minutes 6 11.2367
3minutes 6 11.7933
Sig. 1.000 1.000 1.000
Means for groups in homogeneous subsets are displayed. Based on observed means.
The error term is Mean Square(Error) = .039. a. Uses Harmonic Mean Sample Size = 6.000. b. Alpha = .05.
Appendix 2d. Graph of interaction between microwave power and extraction time in relation to moisture content
5 6 7 8 9 10 11 12 13
600 W 800 W
M
oi
st
ur
e
C
on
te
nt
(%
)
Microwave Power
32 Appendix 3a Result of effect of microwave power and extraction time to ash content analysis
Microwave
Power Extraction time 1 Ash content (%) 2 3 Means 600 Watt 3 minutes 0.74 0.77 0.70 0.74 ± 0.03d
600 Watt 5 minutes 0.82 0.81 0.78 0.80 ± 0.02 c
600 Watt 7 minutes 0.85 0.87 0.90 0.87 ± 0.02 b
800 Watt 3 minutes 0.90 0.86 0.91 0.89 ± 0.03 b
800 Watt 5 minutes 0.93 0.90 0.91 0.91 ± 0.02 ab
800 Watt 7 minutes 0.94 0.92 0.96 0.94 ± 0.02 a
- The same letter means it is not different significantly (α=0.05)
Appendix 3b. Analysis of variance of ash content
Tests of Between-Subjects Effects Dependent Variable:Ash
Source Type III Sum of Squares df Mean Square F Sig.
Model 13.382a 6 2.230 3683.073 .000
Power .054 1 .054 89.917 .000
Time .026 2 .013 21.587 .000
Power * Time .006 2 .003 4.651 .032
Error .007 12 .001
Total 13.389 18
33 Appendix 3c. Post-hoc analysis effect of extraction time to ash content
Duncana,,b
Time N
Subset
1 2 3
3minutes 6 .8133
5minutes 6 .8583
7minutes 6 .9067
Sig. 1.000 1.000 1.000
Means for groups in homogeneous subsets are displayed. Based on observed means.
The error term is Mean Square(Error) = .001. a. Uses Harmonic Mean Sample Size = 6.000. b. Alpha = 0.05.
Appendix 3d. Graph of interaction between microwave power and extraction time in relation to ash content
0,5 0,550,6 0,650,7 0,750,8 0,850,9 0,951
600 W 800 W
A
sh
C
on
te
nt
(%
)
Microwave Power (W)
34 Appendix 4a. Result of effect of microwave power and extraction time to equivalent weight analysis
Microwave
Power Extraction time 1 Equivalent weight 2 3 Means 600 Watt 3 minutes 1428.57 1515.15 1351.35 1431.69 ± 81.94a
600 Watt 5 minutes 1190.48 1190.48 1282.05 1221.00 ± 52.87b
600 Watt 7 minutes 925.93 980.39 909.09 938.47 ± 37.27d
800 Watt 3 minutes 1219.51 1250.00 1111.11 1193.54 ± 73.00 bc
800 Watt 5 minutes 1041.67 1086.96 1162.79 1097.14 ± 61.20c
800 Watt 7 minutes 833.33 833.33 877.19 847.95 ± 25.32d
- The same letter means it is not different significantly (α=0.05)
Appendix 4b. Analysis of variance of equivalent weight Tests of Between-Subjects Effects Dependent Variable:Equivalent
Source Type III Sum of Squares df Mean Square F Sig.
Model 2.331E7 6 3884292.225 1130.595 .000
Power 102393.209 1 102393.209 29.803 .000
Time 540317.070 2 270158.535 78.635 .000
Power * Time 17983.918 2 8991.959 2.617 .114
Error 41227.407 12 3435.617
Total 2.335E7 18
a. R Squared = .998 (Adjusted R Squared = .997)
Appendix 4c. Post-hoc analysis effect of extraction time to equivalent weight Duncana,,b
Time N
Subset
1 2 3
7minutes 6 893.2100
5minutes 6 1159.0717
3minutes 6 1312.6150
Sig. 1.000 1.000 1.000
Means for groups in homogeneous subsets are displayed. Based on observed means.
35 Appendix 5a. Result of effect of microwave power and extraction time to methoxyl content analysis
Microwave
Power Extraction time 1 Methoxyl content (%) 2 3 Means 600 Watt 3 minutes 4.09 3.97 4.15 4.07 ± 0.09f
600 Watt 5 minutes 5.64 5.77 5.58 5.66 ± 0.09d
600 Watt 7 minutes 6.26 6.32 6.26 6.28 ± 0.04b
800 Watt 3 minutes 4.65 4.71 4.59 4.65 ± 0.06e
800 Watt 5 minutes 6.08 6.01 6.14 6.08 ± 0.06c
800 Watt 7 minutes 6.51 6.39 6.39 6.43 ± 0.09a
- The same letter means it is not different significantly (α=0.05)
Appendix 5b. Analysis of variance of methoxyl content
Tests of Between-Subjects Effects Dependent Variable:Methoxyl
Source Type III Sum of Squares df Mean Square F Sig.
Model 563.910a 6 93.985 17807.677 .000
Power .654 1 .654 123.841 .000
Time 12.991 2 6.495 1230.698 .000
Power * Time .141 2 .071 13.359 .001
Error .063 12 .005
Total 563.973 18
36 Appendix 5c. Post-hoc analysis effect of extraction time to methoxyl content
Methoxyl Duncana,,b
Time N
Subset
1 2 3
3minutes 6 4.3600
5minutes 6 5.8700
7minutes 6 6.3550
Sig. 1.000 1.000 1.000
Means for groups in homogeneous subsets are displayed. Based on observed means.
The error term is Mean Square(Error) = .005. a. Uses Harmonic Mean Sample Size = 6.000. b. Alpha = 0.05.
Appendix 5d. Graph of interaction between microwave power and extraction time in relation to methoxyl content
0 1 2 3 4 5 6 7
600 W 800 W
M
et
ho
xy
l C
on
te
tn
(%
)
Microwave Power (W)
37 Appendix 6a. Result of effect of microwave power and extraction time to galacturonic content analysis
Microwave
Power Extraction time 1 Galacturonic content (%) 2 3 Means 600 Watt 3 minutes 34.36 33.68 35.87 34.64 ± 1.12e
600 Watt 5 minutes 43.42 43.51 45.34 44.09 ± 1.08c
600 Watt 7 minutes 50.45 48.96 48.32 49.25 ± 1.09b
800 Watt 3 minutes 38.43 40.21 39.43 39.36 ± 0.89d
800 Watt 5 minutes 48.34 49.43 48.75 48.84 ± 0.55b
800 Watt 7 minutes 57.13 56.32 57.87 57.11 ± 0.77a
- The same letter means it is not different significantly (α=0.05)
Appendix 6b. Analysis of variance of galacturonic content Tests of Between-Subjects Effects Dependent Variable:Galacturonic
Source Type III Sum of Squares df Mean Square F Sig.
Model 38291.991a 6 6381.998 7190.939 .000
Power 150.222 1 150.222 169.263 .000
Time 792.824 2 396.412 446.659 .000
Power * Time 9.787 2 4.894 5.514 .020
Error 10.650 12 .888
Total 38302.641 18
38 Appendix 6c. Post-hoc analysis effect of extraction time to galacturonic content
Duncana,,b
Time N
Subset
1 2 3
3minutes 6 36.9967
5minutes 6 46.4650
7minutes 6 53.1750
Sig. 1.000 1.000 1.000
Means for groups in homogeneous subsets are displayed. Based on observed means.
The error term is Mean Square(Error) = .888. a. Uses Harmonic Mean Sample Size = 6.000. b. Alpha = 0.05.
Appendix 6d. Graph of interaction between microwave power and extraction time in relation to galacturonic content
0 10 20 30 40 50 60
600 W 800 W
G
al
ac
tu
ro
ni
c C
on
te
nt
(%
)
Microwave Power (W)
39 Appendix 7a. Result of effect of microwave power and extraction time to degree of esterification analysis
Microwave
Power Extraction time 1 Degree of Esterification (%) 2 3 Means 600 Watt 3 minutes 67.58 66.92 65.69 66.73 ± 0.96bc
600 Watt 5 minutes 73.75 72.29 69.87 72.97± 2.79a
600 Watt 7 minutes 70.45 73.29 73.55 72.43± 1.72a
800 Watt 3 minutes 68.70 66.50 66.09 67.10± 1.40b
800 Watt 5 minutes 71.41 69.03 71.51 70.65± 1.40a
800 Watt 7 minutes 64.69 64.42 62.93 63.93± 1.08c
- The same letter means it is not different significantly (α=0.05)
Appendix 7b. Analysis of variance of degree of esterification Tests of Between-Subjects Effects Dependent Variable:Esterification
Source Type III Sum of Squares df Mean Square F Sig.
Model 85813.425a 6 14302.237 5109.108 .000
Power 54.601 1 54.601 19.505 .001
Time 77.502 2 38.751 13.843 .001
Power * Time 61.964 2 30.982 11.068 .002
Error 33.592 12 2.799
Total 85847.017 18
40 Appendix 7c. Post-hoc analysis effect of extraction time to degree of esterification
Duncana,,b
Time N
Subset
1 2
3minutes 6 66.9133
7minutes 6 68.1817
5minutes 6 71.8100
Sig. .214 1.000
Means for groups in homogeneous subsets are displayed.
Based on observed means.
The error term is Mean Square(Error) = 2.799. a. Uses Harmonic Mean Sample Size = 6.000. b. Alpha = 0.05.
Appendix 7d. Graph of interaction between microwave power and extraction time in relation to degree of esterification
58 60 62 64 66 68 70 72 74
600 W 800 W
D
eg
re
e o
f E
st
er
ifi
ca
tio
n
(%
)
Microwave Power (W)
41 Appendix 8. Characterization of Low Methoxyl Commercial Pectin
Parameter 1 Replication 2 3 Means
Moisture content (%) 11.65 11.90 11.78 11.78 ± 0.13
Ash content (%) 1.26 1.25 1.22 1.24 ± 0.12
Equivalent weight 781.25 769.23 746.27 765.58 ± 17.77
Methoxyl content (%) 4.59 4.46 4.46 4.50 ± 0.07
1
I. INTRODUCTION
A. Background
Pectin is natural polymer that found in all plants, which have been discovered in the 18th century (Whister and Miller 1997). Pectin is a polysaccharide and also known as a water-soluble fiber. The major use of pectin is as a gelling, stabilizing, and thickening agent in food systems such as jam and jelly, confectionery, and fruit juice. The most important market application of pectin is in jelly product with high sugar content, but it is also used in the dental and cosmetic industries for its gellifying properties (Endress 1991). Pectin is also used in pharmaceutical industry, suggested to reduce heart disease and gallstones (Baghenian et al. 2011). Each year, Thailand has to import at least 200 million baht valued-pectin because it is not able to produce valued-pectin in the country (Rungrodnimitchai et al. 2008). Meanwhile, Indonesia in 2008 imported 670.410 tons of pectin (BPS 2010). So it must be concerned that development of pectin from raw material that indigenous in South East Asia can be an alternative way for reducing pectin import.
Sugar palm is commonly found growing wild in primary and secondary forests in South East Asia. Five species are distributed, the one that most widely spread in north Thailand is Arenga westerhoutii Griff. while in Indonesia there are so many Arenga pinnata trees. The seed of sugar palm is quite rich in protein and crude fiber. It also has an ability of being good source of calcium (Suthiluk et al. 2009). But the utilization of this commodity is still limited. Economic studies of Arenga westerhoutii Griff. in Thailand had revealed that the young endosperms is the main use of A. westerhoutii Griff. in northern Thailand. The endosperms, which are collected in the gelatinous stage are consumed as a dessert or for ice cream topping (Pongsattayapipat and Barfod 2005). Based on research that conducted by Suthiluk et al. (2011), the manufacture of sugar palm seed jam does not require pectin addition. This gave us the idea that there would be plenty of pectin contained in sugar palm seed.
Conventionally, pectin is extracted in a hot dilute mineral acidic solution. The time needed depends on some factors like raw material and the type of pectin desired, and varies from one manufactures to another, but generally, this process is time consuming (May 1990). This condition leads to pectin degragation, so conventional method is not appropriate for both quantity and quality of the pectin extraction. Various methods for extraction of pectin have already been investigated. Recently, dielectric heating or microwave heating becomes an attractive technique for improving extraction yield and quality of pectin from various source (Kratchanova et al. 2004). Microwave-assissted extraction (MAE) led to higher pectin yield and higher values for degree of esterification (DE) and gel strength compared with the no-pretreated samples (Kratchanova et al. 1994).
There are little data dealing with the study of pectin extraction from sugar palm seed. The aims of this study were to determine the optimum extraction condition using microwave-assissted extraction and analyze the quality of extracted pectin.
B. Objectives
2
II. LITERATURE REVIEW
A. Sugar Palm
Sugar palm is used as collective term for plant species of Arenga. The genus Arenga is distributed in South China, the Ryukyu Islands and Taiwan in the north to Christmast Island in the south and from India in the west to Queensland, Australia in the east. The greatest diversity is found in Sumatra, Penninsular Malaysia, and Borneo (Dransfield and Mogea 1984). In his recent revision of the genus, Mogea (1999) described 22 species, two subspecies and four varieties. Five species are distributed in Thailand (Hodel 1998) of which three are arborescent, which are A. obtusifolia, A. pinnata, and A. westerhoutii. The identification of the latter two species, which are both solitary, is often confused. They both are single-stemmed palms and similar in stem diameter and have persistent leaf sheats to the ground that split in coarse (Pongsattayapipat and Barfod 2005). A. pinnata and A. westerhoutii are separated based on their leaf morphological characters in the identification keys.
In this research, we focused on the Arenga westerhoutii Griff. Sugar-palm or Tao (Arenga westerhoutii Griff.) is an economical fruit tree in the Palmaceae family of Nan Province in northern Thailand (Hoare et al. 1998). In Indonesia, sugar palm is used to make wine, sugar, and starch (sago), but in Thailand, sugar palm’s endosperm is processed either as a dessert syrup, called “loog tao” or “loog chid” (“loog” means fruit in Thai). Moreover, the young pith in its stem makes a delicious dish (Chantaraboon et al. 2010).
The sugar palm seed takes about 4 to 20 months to germinate. Its germination rate is 65 percent (Chantaraboon 1998). During its first to third year sugar palm grows very slowly, taking about 15 to 18 years from seeding to fruiting stage. The fallen mature seed can grow naturally into many seedlings under their mother trees, but not all grown seedlings survive because of their high density plot. A sugar palm tree produces 5 to 6 clusters. When the last cluster is senescent, the tree will die. This is known as a hapaxanthic tree (Pongsattayapipat and Barford 2005). This palm has 12-30 leaves that are gathered in a rather loose crown. Leaf dimensions depend on the age of the palm (varies from 6 to 15 meters). The leaflets of A. westerhoutii are regularly arranged and arised from the leaf rachis in one, rarely several planes. The color of its flower is yellow and has a wide shape.
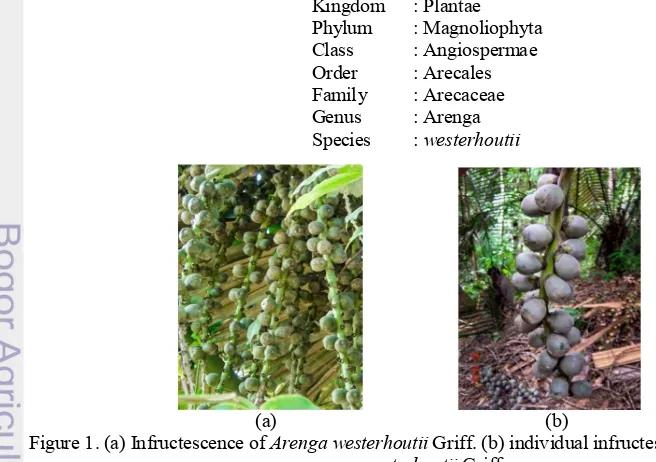
Kingdom : Plantae Phylum : Magnoliophyta Class : Angiospermae Order : Arecales Family : Arecaceae Genus : Arenga Species : westerhoutii
(a) (b)
Figure 1. (a) Infructescence of Arenga westerhoutii Griff. (b) individual infructescence of Arenga westerhoutii Griff.,
3 The distribution of A. westerhoutii are widespread in evergreen and semi-evergreen forests in Penninsular Malaysia and Thailand (Zakaria et al. 1999), where they occur from sea level to 900 on elevation. Very little information is available on the utilization of A. westerhoutii mainly because its identity has been confused with A. pinnata. Tao is not grown for commercial purpose in Thailand. In addition, sugar palm is valued as a non-timber forest product (Chantaraboon 1998). Therefore, tao is mainly consumed troughout Thailand as a dessert or for ice cream topping.
The sugar palm (Arenga westehoutii Griff.) seed are rounded, obovoid to oblong-turbirate, approximately 4 cm both in length and in width. They are light bluish green when immature and bluish green or dark green when ripening (Pongsattayapipat and Barfod 2005). There are two or three seeds inside sugar palm fruit. The seeds (young endosperms) are good source of dietary fiber and calcium. According to Suthiluk et al. (2009), the nutritional composition of sugar palm seed are listed as below.
Table 1. Nutritional value of sugar palm seed (A. westerhoutii Griff.) Composition Content
Moisture 86.71 %
Protein 3.04 %
Fat 0.07 %
CHO 9.81 %
Ash 0.36 %
Crude Fiber 7.63 % Total Dietary Fiber 8.59% Calcium 965.07 mg/kg Phosphorus 270.71 mg/kg
Figure 2. Fruit and cross section of Arenga westerhoutii Griff., (taken by Phunsiri Suthiluk 2007)
B. Pectin
1. Definition and source of pectin
4 The word pectin comes from the Latin "pectos" that means thickener or something that make things hard/solid. Pectin was founded by Vauquelin in fruit juice about 200 years ago. In 1790, pectin was not yet to be named. Pectin name was first used in 1824, when Braconnot had continued a research that was begun by Vauquelin. Braconnot called such gelling substances as pectic acid (Herbstreith and Fox 2005).
Pectin that used in food is polymer of galacturonic acid unit (at least 65%). That acid group can be found in the form of free acid, methyl ester, sodium, potassium, calcium or ammonium compound and the amide groups of pectin (IPPA 2002). Composition of protopectin, pectin and pectic acid inside the fruit varies greatly depend on the maturity degree of the fruit. Generally, soluble protopectin is more abundant inside immature fruits (Winarno 1997). Pectin generally presents in the primary cell wall of plants, particularly on the sidelines between cellulose and hemicellulose. Pectin serves as an adhesive between the cell wall with each other.
Pectin content in plants varies widely, both by types of plants or by parts of its tissues. For example, the skin and albedo of citrus fruits contain more pectin than the tissues from its parenchime (Winarno 1997). Table 2 shows the yield of pectin produced from several kinds of fruits.
Table 2. Yield of pectin from several kind of fruit source (Herbstreith and Fox 2005) Source Pectin content
Apple 10-15%
Beet sugar 10-20% Sunflower 15-25% Sugar peel 20-35%
2. Structure and chemical composition of pectin
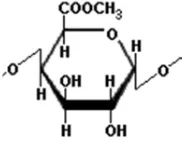
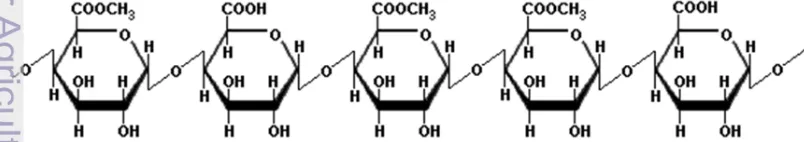
In 1924, Smolenski was the first to assume that pectin is galacturonic acid polymer. In 1930, Meyer and Mark found the chains formation of pectin molecules, and in 1937, Schneider and Bock formed the formula (Herbstreith and Fox 2005). Pectin molecules are composed by galacturonic acid with β-(1-4)-glycoside binding to form polygalacturonic acid. Carboxyl groups partially esterified with methyl groups and partially acylated with secondary alcohol groups (Herbstreith and Fox 2005). Figure 3 below shows chemical structure of α-galacturonic acid.
Figure 3. Chemical structure of α-galacturonic acid (Zamora 2012)
According to Hoejgaard (2004), pectin is a polygalacturonic acid that contains methyl ester. Pectin is commercially extracted from the skin of the orange fruit and apples in acidic conditions. Each ring is a molecule of galacturonic acid, and there are 300-1000 such rings in a typical pectin molecule, which are connected by a linear chain.
5 Depends on their methoxyl content, pectin is commonly categorized as high methoxyl pectin (HMP) or low methoxyl pectin (LMP), with methoxyl content is >7% and <7%, respectively. HMP can form a gel under acidic conditions in the presence of high sugar concentration (Evangliou et al. 2000). On the other hand, LMP forms gel by interaction with divalent cations, particularly Ca2+, according to the “egg box”
model (Durand et al. 1990). Figure 5 and 6 below show molecular structure of high methoxyl and low methoxyl pectin.
Figure 5 Chemical structure of high methoxyl pectin (HMP) (Taranathan 2003)
Figure 6. Chemical structure of low methoxyl pectin (LMP) (Taranathan 2003)
Pectin consists of galacturonic acid monomers that form a long-chain molecule. The main chain is interrupted by a rhamnose group with branched chain assembling neutral sugars (arabinose, galactose). Carboxyl groups (acid groups) of galacturonic acid can be esterified or amidated (IPPA 2002). In addition to D-galacturonic acid as the main component, pectin also has D-galactose, L-arabinose, and L-rhamnose in various amounts. The chemical composition of pectin varies greatly depends on the source and the conditions that is used in insulation (Willats et al. 2006).
3. Pectin characteristic
Committee on Food Chemical Codex (1996), states that the pectin is mostly composed of methyl esters of polygalacturonic acid and sodium, potassium, calcium or ammonium salts. Pectin is a coarse to fine powder which is white, yellow, grey or brown and abundant in mature fruits and vegetables. Glicksman (1969) stated that dry pectin that has been purified will forms white crystals with solubility varies according to its methoxyl content. The physical properties of pectin depend on its chemical characteristics (Guichard et al. 1991). Factors affecting the rate of gel formation, plasticity and gel strength are pH, pectin concentration, temperature, calcium ion, and sugar (Chang and Miyamoto 1992). Viscosity of pectin solution has a fairly wide range depends on the concentration of pectin, salt, and size of polygalacturonic acid chains (Rouse 1977).
6 According to May (1990), pectin is a negatively charged polygalacturonic acid. Pectin reacts to positively charged macromolecule. Gel formation can occur rapidly at low pH, but this reaction can be inhibited by the addition of salt. According to Rouse (1977), pectin degradation and decomposition can be caused by the oxidation reaction. Rate of degradation depends on temperature, pH, and concentration of oxidizing agent.
4. Production of pectin
Stages in the pectin manufacture are material preparation, extraction, concentration, washing, and drying. The method used to extract pectin from plant tissues is various. But generally pectin extraction is done using acid extraction. Several types of acid can be used in the pectin extraction. According Kertesz (1951), the acids that usually used in the extraction pectin are tartaric acid, malic acid, citric acid, lactic acid, acetic acid, phosphoric acid. But there is a tendency to use a cheap mineral acid such as sulfuric acid, hydrochloric acid, and nitric acid. Some current article suggested that using hydrochloric acid (Kalapathy and Proctor 2001; Hwang et al. 1998; Dinu 2001) and nitric acid (Pagan et al. 2001).
Extraction using mineral acids produce higher yield than organic acids. The used of mineral acid at low pH is better than at high pH (Rouse and Crandal 1978). The role of acid in the extraction of pectin is to separate polyvalent ions, break the bonds between the amino pectinic cellulose, hydrolyzing protopectin into smaller molecules and hydrolyzing methyl ester pectin (Kertesz 1951). High temperatures during the extraction can increase pectin yield. Higher temperature will help the diffusion of solvent into the plant tissue and can increase the activity of the solvent in hydrolyzing pectin (Towle and Christensen 1973). The used of extraction temperature that is too high will result in pectin that is not clear, so the gel obtained will be cloudy and reduced gel strength (Kertesz 1951).
Pectin in many plant tissues usually forms a protopectin that insoluble in water. The acidic solution with a low pH conditions makes hydrolyzing protopectin become pectin easier. Extraction of pectin from vegetables and fruits is done on pH range between 1.5 to 3.0 with the heating temperature of 60-100 oC
during half an hour to an hour and a half (Towle and Christensen 1973). If the extraction time is too long will result in hydrolysis of pectin becomes galacturonic acid. In acidic conditions, methyl ester bond of pectin tend to be hydrolyze become unesterified galacturonic acid (Smith and Bryant 1968).
Pectin precipitation process is a process of pectin separation from the solution. Pectin is a negatively charged hydrophilic colloids (from free carboxyl groups that are ionized) and do not has an isoelectric point like most of colloidal hydrophilic. Pectin is more likely stabilized by its hydration of the particles rather than by its charge. Increasing ethanol can dehydrate the pectin that disrupts the stability of its colloidal solution, and consequently pectin will be coagulated (Rouse 1977). Ranganna (1977) uses 95% concentration ethanol with twice amount of filtrate volume to precipitate the orange peel pectin. West Sumatra Science, Technology and Industry Council (2004) precipitates pectin using 95% ethanol containing 2 mL of concentrated hydrochloric acid every one liter of ethanol as much as 1.5 times of the filtrate volume.
At pectin purification stage, the West Sumatra Science, Technology Industry Council (2004) washing pectin from passion fruit by using 95% alcohol until it becomes chloride-free pectin. Suradi (1984) washing pectin from orange peels with 80% alcohol until becomes chloride free. One of the goals is to wash pectin and eliminates chloride in pectin. The final stage of the pectin extraction is drying the pectin. Ranganna (1977) recommends drying is done at low pressure so the pectin is not degraded. According to the West Sumatra Science, Technology Industry Council (2004), drying passion fruit pectin can be done using the oven at a temperature of 40-60 oC for 6-10 hours.
5. Pectin application
7 Pectin has a good potential in the pharmaceutical field. Towle and Christensen (1973) stated that it is been a long time pectin used in treating diarrhea and reduce total blood cholesterol. Pectin that flow through the blood vessels can shorten the blood coagulation time and useful to control bleeding from injuries. In the pharmaceutical industry, pectin used as an emulsifier for the liquid and syrups preparate, diarrhea medicine for infants and children, the antidote of metals toxic, and as a material to lower the absorption of various drugs. In addition, pectin also serves as a combination of hormones and work to extend antibiotics and injection materials to prevent bleeding (Hoejgaard 2004).
Quality of commercial pectin is determined by the physical properties of pectin. The physical properties are color and flavor, the solubility (for solid pectin), the degree of gelation, freezing rate, and does not contain materials or substances hazardous to health. The physical properties are influenced by the chemical properties of pectin (IPPA 2002).
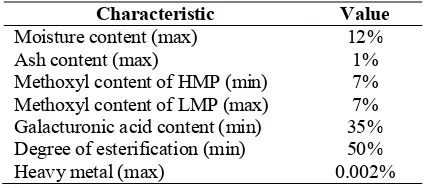
Table 3. Quality specification of commercial pectin (FDA of Thailand 1996) Characteristic Value
Moisture content (max) 12%
Ash content (max) 1%
Methoxyl content of HMP (min) 7% Methoxyl content of LMP (max) 7% Galacturonic acid content (min) 35% Degree of esterification (min) 50%
Heavy metal (max) 0.002%
C. Microwave-Assisted Extraction
In the past 20 years, the microwave oven has become an essential appliance in most of kitchen. Faster cooking times and energy savings over conventional methods are the primary benefits. Altough the use of microwaves for cooking food is widespread, the application of this technology to the extraction process is a relatively new development. The use of microwave energy for processing materials has the potential to offer similar advantages in reduced processing times and energy saves (Thontenson and Chou 1999).
Microwave belongs to the portion of the electromagnetic spectrum with wavelengths from 1 mm to 1 m with corresponding frequencies between 300 MHz and 300 GHz. Within this portion of the electromagnetic spectrum there are frequencies that used for cellular phones, radar, and television satellite communications. For microwave heating, two frequencies, reserved by the Federal Communications Commission (FCC) for industrial, scientific, and medical (ISM) purposes that commonly using microwave heating. The two most commonly used frequencies are 0.915 and 2.45 GHz. Recently, microwave furnaces that allow processing at variable frequencies from 0.9 to 18 GHz have been developed for material processing (Lauf et al. 1993).
In conventional thermal processing, energy is transferred to the material trough convection, conduction, and radiation of heat from the surface of the material. In contrast, microwave energy is delivered directly to materials trough molecular interaction with the electromagnetic field. In heat transfer, energy is transferred due to thermal gradients, but microwave heating is the transfer of electromagnetic energy to thermal energy and energy conversion, rather than heat transfer. This difference in the way energy is delivered can result in many potential advantages of using microwaves for food processing. Because of microwave can penetrate materials and deposit energy, heat can be generated throughout the volume of the material. The transfer of energy does not rely on diffusion of heat from the surfaces, and it is possible to achieve rapid and uniform heating of thick material (Thontenson and Chou 1999).
8 increase in the capillary-porous characteristic and the water absorption capacity of the plant material. The heating inactivated the pectin-esterase activity in the oranges. These changes in the plant tissues after a microwave pretreatment gave an opportunity for the considerable increase in the yield of extractable pectin and improvement of its parameters (e.g. DE, molecular mass, and gel strength). Zhandong et al. (2005) also found that the time required for the extracting process is reduced from 1 hour of the conventional methods to 5 minutes by microwave method by microwave disintegration processing.
9
III. RESEARCH METHODOLOGY
A.
Materials and Instruments
1.
Materials
Main ingredient that used in this research was sugar palm seed (Arenga westerhoutii Griff.) that stored under -20 oC. Chemical that used in the extraction of pectin were HCl 0.25 N, distilled water, and
ethanol 95%. Chemical that used in the characterization of extracted pectin were ethanol 95%, NaCl, NaOH 0.25 N, NaOH 0.1 N, phenol red indicator, sulphuric acid 98%, carbazol solution, HCl 0.25 N, phenolphtalein, methyl red.
2. Instruments
Instruments that used in this research were blender, pH meter, microwave oven, cheesecloth, vacuum evaporator, Whatman 41 paper, oven, buret, electric furnace, crucible, dessicator, burner, spectrophotometer, beaker glass, flask, volumetric pippet, and viscometer
.
B. Experimental Design
This research was divided into two parts. The first part was extraction of pectin from raw material (young endosperm of sugar palm seed) using microwave-assisted extraction. The second parts were characterization of pectin including determination of moisture content, ash content, equivalent weight, galacturonic acid content, degree of esterification, and comparison of extracted pectin to commercial pectin.
1. Extraction of pectin
Extraction of pectin conducted in order to get pectin for characterization and to determine the combination effect of microwave power and extraction time on the resulting pectin. The stages on pectin production consist of:
a. Sample preparation
Sugar palm seed that stored under -20 oC was thawed using running water. This process usually
took time around 2 hours until the ice was completely gone. b. Extraction
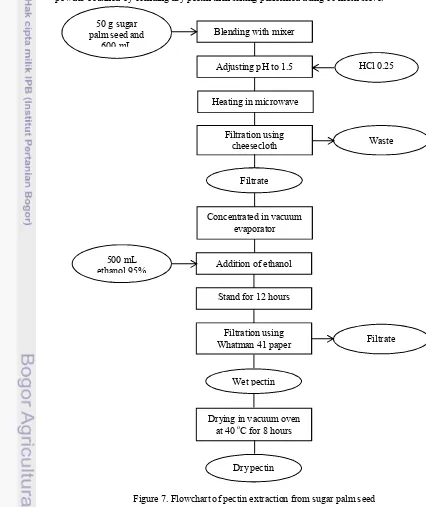
Sugar palm seed was weighed and crushed using blender for 2 min with addition 600 mL of distilled water. Adjustment of pH was done by adding hydrochloride acid 0.25 N until pH reaches 1.5. Extraction was performed on microwave oven with microwave power and time varies as treatments.
Microwave power used in this study was 600 W and 800 W. While the extraction time used in this study was 3 min, 5 min, and 7 min. Extracted solution was filtered by using a thick cheesecloth and was squeezed to separate the filtrate from the pulp. Then the solution was concentrated on rotary evaporator until the volume became half of its original volume by heating at 80 oC.
c. Precipitation (isolation)
10 d. Washing
Pectin sediment was washed by using 95% ethanol until the sediment was free from chloride. Separation of precipitated pectin with ethanol was done using thick filter cloth then squeezed. Determination the presence of chloride was done by adding a few drops of a solution of silver nitrate (AgNO3) in the used washed solution. If chloride was still there, it will form a white
precipitate (AgCl). e. Drying
Drying of wet pectin after washing was done in the vacuum oven in 40 oC for 8 hours. Pectin
powder obtained by blending dry pectin then sifting performed using 60 mesh sieve.
Figure 7. Flowchart of pectin extraction from sugar palm seed Drying in vacuum oven
at 40 oC for 8 hours
Dry pectin Wet pectin Addition of ethanol
Filtration using
Whatman 41 paper Filtrate Filtrate
Concentrated in vacuum evaporator Heating in microwave
500 mL ethanol 95% 50 g sugar palm seed and
600 mL
Blending with mixer
Adjusting pH to 1.5 HCl 0.25 N
Stand for 12 hours Filtration using
11
2. Pectin characterization
Characterization of resulted pectin is done by testing moisture content, ash content, equivalent weight, methoxyl content, galacturonic acid content, and degree of esterification.
a. Moisture content (AOAC 1995)
Moisture content of the samples was determined by drying milled samples (~1 g) for 24 hours at 105±0.5 ⁰C to a constant mass. Analyzes were done in triplicates for statistical purposes. The analysis was done for determination of initial moisture content of fresh bamboo shoots and the drying curve. The average moisture content in dry basis, expressed in percents, was calculated using the following equation:
w % = m − mm ×
where: m1 = mass of samples before drying
m2 = mass of samples after drying
b. Ash content (AOAC 1995)
Crucible with lid was dried in an oven at 105 oC for 15 minutes and then cooled in a desiccator
and weighed. A total of 3-4 grams of sample was put into the crucible. Next, sample was heated over the burner flame until it smokes fade away. Then, sample was ashed in the electric furnace at a temperature 400-600 oC for 4-6 hours or until sample became white ash. Then sample was
cooled in a desiccator and then weighed. The calculation of ash content can be expressed as the percent.
Ash content % =mass of sample ×mass of ash
c. Equivalent weight (EW) (Ranganna 1977)
Pectic substance was weighed 0.5 grams into a 250 mL conical flask and then moistened with 5 mL ethanol. Sodium chloride 1 gram added to sharpen the end point and then 100 mL of carbon dioxide-free distilled water and 6 drops of phenol red indicator was added. Make sure that all the pectic substance had dissolved and that no lumps were retained on the sides of the flask. Titration was done slowly (to avoid possible deesterification) with 0.1 N NaOH until the color of the indicator changed from yellow to pink (pH 7.5), the color change should persist for at least 30 sec. The neutralized solution could be used for methoxyl determination.
Equivalent weight =mL of alkali x Normality of alkalimass of samples x
d. Methoxyl content (Ranganna 1977)
To the neutral solution titrated for equivalent weight, containing 0.5 grams of pectic substance, was added 25 mL of 0.25 N sodium hydroxide and then shook thoroughly and allowed to stand for 30 min at room temperature in a stoppered flask. Add 25 mL of 0.25 N HCl (or an amount equivalent to the based added) and titrated with 0.1 N NaOH to the same end point as before. 3.1 value is derived from molecular weight of methoxyl.
12
e. Galacturonic content (Rungrodnimitchaia 2011)
5 mL of sulfuric acid (98%) was added to 5 mL of 100 ppm of pectin solution. Then 200 μL of 0.1% v/v carbazol solution was added to the sample. The sample was heated at 58-60 oC for 1
hour and cooled down to room temperature. The absorbance was measured at 525 nm against reagent blank. The total galacturonic acid unit content was derived from the calibration curve using standard solution of galacturonic acid at the same condition.
f. Degree of esterification (Schultz 1965)
Degree of esterification could be calculated by resulted methoxyl content and galacturonic content.
Degree of Esterification % =Galacturonic content x 3 x Methoxyl content x
g. Statistical analysis
Data were analyzed by one way ANOVA using the application of SPSS software. Mean value were compared using The Duncan’s Multiple Range Test.
C. Comparison to Commercial Pectin
13
IV. RESULTS AND DISCUSSIONS
A. Extraction of Pectin
In this pectin extraction, two factors were used, which were microwave power and heating time. Microwave power used was 600 W and 800 W. Trial and error were done prior to the determination of these two values of microwave power. At trial and error, the use of microwave power above 800 W which was 1000 W resulted in overheating and very aqueous solution, so the solution could not be filtered using a cheesecloth. Therefore, this research was only used two power alone which was 600 W and 800 W. While another factor, heating time used was 3 minutes, 5 minutes, and 7 minutes. Various studies on the extraction of pectin by microwave heating was using the average time between 2-10 minutes. Therefore, this study used 3, 5, and 7 minutes for the range which was not too narrow and fairly evenly.
In the first step of extraction, sugar palm seed was weighed and crushed using blender for 2 min by adding 600 mL of distilled water (Figure 8a). Adjustment of pH was done by adding hydrochloride acid 0.25 N until pH reaches 1.5 (Figure 8b). Extraction was performed on microwave oven with microwave power and time varies as treatments (Figure 8c). After heating in the microwave, solution then filtrated using cheesecloth. The waste of this solution was separated and was not used for further step (Figure 8d). The filtrate then concentrated using a rotary evaporator. Concentration process was done until the volume of solution became half of the initial volume (Figure 8e). This was necessary because the ethanol would be able to precipitate the polysaccharide inside solution when the solution had a concentration over 80%. Ethanol used also must have a concentration above 85%. Therefore, this study used 95% ethanol solution, and the ratio between solution and ethanol was 1:2. The addition of ethanol could precipitate the polysaccharide inside solution because the ethanol would bind water so that the stability of the water-polysaccharide binding could be disrupted and polysaccharids eventually settled. After addition of ethanol, all types of polysaccharides inside solution would precipitate into fibrous-like clumps (Figure 8f). The precipitate was then filtered, dried, and blended to produce a powdered polysaccharide (Figure 8g). This powder contained various polysaccharide components such as pectin, starch, cellulose, and others.
Extraction of pectin was conducted according to the flowchart on previous section. These are the documentation of pectin extraction.
(a) Sugar palm seed blend with water (b) After adjustment pH into 1.5
14 (e) Waste of filtration (f) After concentration using rotary evaporator
(
[image:31.595.115.492.112.397.2](g) After ethanol addition (h) Dried pectin after drying in hot air oven
Figure 8. Extraction of pectin from sugar palm seed
Pectin is a complex substance belongs to heteropolysaccharides. Like other plant polysaccharides, pectin has varied composition and molecular size so that the chemical structure and molecular weight also has so many varieties. The composition depends on the type of extracted materials, the extraction conditions, the origin location of materials and another environmental factor (Chang et al. 1994). Pectin is obtained from plant tissue by extraction using a solvent, in this case was using water acidified with hydrochloric acid. Yield of pectin produced depends on the type and plant parts that extracted. Before extraction of pectin, it is important to made materials preparations so the contact material with a solution which will be easier.
15 Figure 9. The relationship between microwave power and extraction time to pectin yield
Results of analysis of variance showed that the microwave power and extraction time significantly affect the yield produced, but interaction between microwave power and extraction time was not significantly affect the yield produced (Appendix 1b). On the pectin extraction with treatment microwave power of 600 watt for 3 minutes, the yield is 20.50% and would become higher as the microwave power and extraction time were increased. The improvement in yield was proportional to the power and duration of microwave heating. The longer the contact between the material and solvent, would provide greater opportunities to hydrolyze protopectin contained in the material so it could increase the yield of pectin. The higher the microwave power would effect on increasing extraction temperature, the kinetics of protopectin hydrolysis reaction increased so the resulted pectin yield also increased.
In addition, the quantities in Figure 9 confirm that there was an inverse correlation between the microwave power and required time to achieve the highest yields. In case of weaker microwave powers, longer heating time was needed. For instance the pectin yield in microwave radiation of 600 W and 7 min (32.05%) was close to the one in power of 800 W and 5 min (31.21%).
Bagherian et al. (2011) found that in the conventional method, it took 90 minutes to get a high yield, while using microwave heating, time can be reduced to 2 minutes to extract the same amount of pectin. Theoretically, microwave radiation loosens the cell wall matrix and lead to severing the parenchymal cells (Kratchanova, Pavlova, and Panchev, 2004), thereby the skin tissues are rapidly and extensively opened up by the microwave. This will lead to increased interaction between extracting agent and source material in extraction process. As a result, permeation of the extracting agent will be increased. It leads to effective increase in the yield of pectin extraction.
Pectin yields produced from sugar palm seed (Arenga westerhoutii Griff.) were quite high. When compared to sugar palm seed from species Arenga pinnata, the resulting yield was still higher. Pectin yield of Arenga pinnata seed that extracted using the microwave ranged between 10.80-23.50% (Rungrodnimitchai, 2011). While other sources of pectin which is often used for the extraction like grapefruit produced yield around 28.71% (Bagherian et al., 2011). Based on data reported by Yoeh et al. (2008), the amount of extracted pectin increased with the extraction period, but the increase was gradual. Also, the experimental data obtained by Kratchanova, Pavlova, and Panchev (2004) showed similar trends. Meanwhile, Goycoolea and Adriana (2003) explains that the use of HCl with a concentration of 0.1 N on the extraction of pectin provides the best yield of pectin.
B. Pectin Characterization
The research was done by extracting pectin from fresh and young sugar palm seed (Arenga westerhoutii Griff.). Material extracted with treatment with the variation of microwave power and time of extraction that has been determined. Pectin from each treatment then was determined the characteristics
d
c
bc bc
b a 10,00 15,00 20,00 25,00 30,00 35,00 40,00 45,00 600 800 Y ie ld (% )
Microwave Power (Watt)
16 which including moisture content, ash content, equivalent weight, methoxyl levels, galacturonic content, and degree of esterification.
1. Moisture content
The moisture content of the material will affect the shelf life of the material. The high moisture content in the material causes of vulnerability to microbial activity. As an effort to extend the shelf life, pectin was dried up to a certain limit of moisture content. Drying at low temperature aims to minimize degradation of pectin.
In this study, drying of samples was conducted in hot air oven with temperature 40 °C for 8 hours. The moisture content of the resulted pectin ranged from 9.58-11.83%. Moisture content of the samples was still inside the range of values that are allowed by The Council of European Communities (1998) that the moisture content of pectin should not more than 12%. The relationship between extraction time and microwave power to the moisture content of pectin can be seen in Figure 10. The moisture content of the resulted pectin would lower with increasing microwave power and the length of extraction time.
Figure 10. The relationship between microwave power and extraction time to moisture content
The highest moisture content of pectin obtained at the extraction with microwave power of 800 W for 3 minutes was 11.83%. It was almost the same with moisture content of pectin with microwave power of 600 W for 3 minutes which was 11.75%. While the lowest moisture content obtained in the treatment of extraction microwave power of 800 W for 7 minutes was 9.58%. This suggests that the interaction between temperature and extraction time significantly affect the moisture content of pectin. Results of analysis of variance showed that extraction time and interaction between microwave power and extraction time significantly affected the moisture content of pectin, but the microwave power was not significantly affect the moisture content of pectin (Appendix 2b).
The higher microwave power and the longer extraction time will increase the amount of water which evaporates during the extraction process thus simplifying the drying process and resulted in the low levels of moisture content inside the pectin. The higher microwave power and longer duration of extraction would able to hydrolyze pectin polymers so that the molecular chains become shorter. The shorter the chain of pectin polymer will further made drying process easier because the content of water trapped inside the lower than long chain pectin. But, it can be used as a reference when the temperature and time of drying in the oven is fully controlled. With the oven temperature and drying time are the same in each sample, it will show the influence of microwave power and extraction time on moisture content produced.
The moisture content of extracted pectin is affected by drying rate of wet pectin and storage condition. Drying process of all the wet pectin was subjected on hot air oven with temperature of 40 oC for
8 hours. Ranganna (1977) suggested that drying should be done in low pressure so the pectin is not harmed. Measuring the moisture content of pectin is important to determine actual yield of pectin. If the drying rate is low, the yield obtained is seen higher than actually are.
a a a
b b c 5 6 7 8 9 10 11 12 13 600 800 M oi st ur e co nt en t ( % )
Microwave Power (Watt)
17
2. Ash content
Ash is the inorganic material obtained from the residue or remainder combustion of organic materials. The mineral content of a material can be seen from ash content inside material. Ash content has effects on the purity levels of pectin. The higher ash content inside pectin, the purity of pectin is lower. If the ash content in pectin powder is high, the percentage of pectin content contained inside the pectin powder is lower and purity level of pectin powder is also low. Ash content of pectin is affected by inorganic residues contained on raw materials, methods of extraction and isolation of pectin (Kalapathy and Proctor 2001).
Ash content of obtained pectin powder obtained ranged between 0.74-0.94%. Ash content of pectin powder had a value of less than 1%. Ash content of pectin extracted from sugar palm seed still below the maximum values by The Council of European Communities (1998) that said ash content of pectin should not more than 1%. Results of analysis of variance showed that the microwave power, extraction time, and interaction between microwave power and extraction time significantly affected the ash content of pectin (Appendix 3b). The relationship between microwave power and time of extraction to the ash content of pectin can be seen in Figure 11.
Figure 11. The relationship between microwave power and extraction time to ash content.
The highest ash content in this research was pectin with treatment microwave power 800 W for 7 minutes for 0.94%. The lowest ash contain obtained from the pectin with treatment microwave power 600 W for 3 minutes that is 0.74%. This value were still below the limit of ash content inside pectin from The Council of European Communities (1998) which maximum level is 1%. Ash content of the pectin obtained from sugar palm seed was quite high. It is suggested because of sugar palm seed from Arenga
westerhoutii Griff. tree is contain high amount of minerals such as Calcium (965.07 mg/kg) and
Phosphorus (270.71 mg/kg) (Suthiluk et al. 2009).
The improvements in ash content were proportional to the power and duration of microwave heating. Kalapathy and Proctor (2001) stated that ash content of pectin will increase proportional with acid concentration, temperature, and time required for extraction. This is caused by ability of acid to dissolve the natural mineral materials extracted that increase with increasing concentrations of acid, temperature, and reaction time. Dissolved minerals will also precipitate mixed with pectin in precipitation step with alcohol. The higher the microwave power would effect on increasing extraction temperature, the kinetics of protopectin hydrolysis reaction increased so the resulting ash content also increases.
Ash content is one of the quality parameters of pectin. The lower ash content, the higher the quality of pectin, because it is indicate the purity of pectin. Ash content is one factor that determined the purity level of pectin. Ash content is affected by its raw materials and its extraction method. According to Meyer (1985), in fruits and vegetables, protopectin present in the form of calcium-magnesium pectic. Increasing the hydrolysis protopectin reaction will result in increasing component of Ca and Mg in the extraction solution.
d c b b ab
a 0 0,2 0,4 0,6 0,8 1 1,2 600 800 A sh c on te nt (% )
Microwave Power (Watt)
18
3. Equivalent weight
Equivalent weight is a measurement of of free galacturonic acid group (non-esterified) content in the pectin chain molecules (Ranganna 1977). Pure pectic acid is a substance that its composition is entirely composed of polygalacturonic acid that free from methyl ester group or did not undergo esterification. Pure pectic acid has equivalent weight of 176. The high degree of esterification between galacturonic acid with methanol showed the low number of free acid which means that the higher equivalent weight (Rouse 1977).
Equivalent weight of resulted pectin powder ranged between 847.95 and 1431.69. Relationship between treatment time and extraction temperature on equivalent weight can be seen in Figure 12.
Figure 12. The relationship between microwave power and extraction time to equivalent weight
The equivalent weight will decrease when microwave power and extraction time increased. The highest equivalent weight was pectin with treatment microwave power of 600 W for 3 minutes, while the lowest equivalent weight was obtained from pectin with treatment microwave power of 800 W for 7 minutes. Results of analysis of variance showed that the microwave power and extraction time significantly affected the equivalent weight of pectin, but interaction between microwave power and extraction time was not significantly affect the equivalent weight of pectin (Appendix 4b).
Kim et al. (1978) explain the low temperatures used on the extraction will minimize the occurrence of depolymerization and demethylation. According to Padival et al (1979), characteristics of the gel and molecular weight will decrease with increasing extraction temperature. The higher the temperature and the longer extraction time will increase the depolymerization or deesterification of pectin so the value of equivalent weight would be lower. If deesterification increase, it means that free acid group is also increase and it make the equivalent weight decrease because the amount of pectic acid that has equivalent weight increase. According to Doesburg in Rouse (1977), pure pectinic acid has low equivalent weight value of 1886, while pure pectic acid has equivalent weight value of 176. Increase in microwave power will make extraction temperature increase, so the equivalent weight will decrease if microwave power is increased.
Molecular weight of pectin depends on the type of plants, the quality of raw materials, extraction methods, and treatment in the extraction process. Generally, high molecular weight pectin is preferable due to its better gel formation (Constenla and Lozano, 2006). The best pectin is pectin which has a high equivalent weight. The higher microwave power and extraction time, will obtained the lower quality pectin according to the equivalent weight value.
4. Methoxyl content
Methoxyl content defined as the amount of methanol that containedin the pectin. Pectin is categorized as high methoxyl pectin (HMP) if it has a value methoxyl content equal to 7% or more. If the
a
bc b
c
d d
0,00 200,00 400,00 600,00 800,00 1000,00 1200,00 1400,00 1600,00 1800,00 600 800 Eq ui va le nt W ei gh t
Microwave Power (Watt)
19 methoxyl content is less than 7%, the pectin is categorized as low methoxyl pectin (LMP) (Goycoolea and Adriana 2003).
Methoxyl content of extracted pectin ranged from 4.07-6.43%. Based on the value of methoxyl content, the resulted pectin in this study was relatively low in methoxyl. Graph showing the relationship of microwave power and time of extraction treatment on methoxyl level of pectin can be seen in Figure 13. The graph showed that the methoxyl content will become higher with increasing microwave power and the length of extraction time.
Figure 13. The relationship between microwave power and extraction time to methoxyl content.
Results of analysis of variance showed that the microwave power and extraction time significantly affected the methoxyl content of pectin, but interaction between microwave power and extraction time was not significantly affect the methoxyl content of pectin (Appendix 5b). The highest methoxyl content was pectin with treatment microwave power of 800 W for 7 minutes, while the lowest methoxyl content was obtained from pectin with treatment microwave power of 600 W for 3 minutes. The range of methoxyl content from this pectin was 4.07-6.43% which was under 7%. Because of the methoxyl pectin was under 7%, so the pectin extracted from sugar palm seed was belongs to Low Methoxyl Pectin (LMP) category.
Methoxyl content of pectin has an important role in determining functional properties of pectin solution and can affect the structure and texture of pectin gel (Constenla and Lozano 2006). High methoxyl pectin forms a gel in the presence of sugar and acid. Conditions required for gel formation is 58-75% sugar content with a pH 2.8-3.5. Low methoxyl pectin does not have the ability to form gel in the presence of sugars and acids, but it can forms a gel with presence of polyvalent cations (Cruess 1958). LMP on industry can be used as a thickener in manufacturing of low calories beverage, jelly for diabetic, and others healthy food.
The pectin industry normally produces high methoxyl pectin though there are some plants that produce low methoxyl pectin. There are four methods of demethylation including the use of acid, alkali, enzyme and ammonia in ethanol. Demethylation using acidis commonly used to produce low methoxyl pectin (Kertesz 1951). Extraction of high methoxyl pectin is easier to do with lower cost. In addition, most of the sources of raw materials produce high methoxyl pectin. High methoxyl pectin is more considered to meet the market needs. If the market want slow methoxyl pectin, the high methoxyl pectin can be easily converted into low methoxyl pectin. But low methoxyl pectin is more difficult to be converted to high methoxyl pectin (Kertesz 1951).
5. Galacturonic content
Galacturonic content and pectin molecule charge have an important role in determining the functional properties of pectin solution. Galacturonic content can affect the structure and texture of pectin gel (Constenla and Lozano 2006).
f e
d b c a
0,00 1,00 2,00 3,00 4,00 5,00 6,00 7,00 600 800 M et ho xy l C on te nt (% )
Microwave Power (Watt)
20 Galacturonic acid content of extracted pectin ranged between 34.64-57.11%. The lowest galacturonic content was pectin extracted with microwave power of 600 W for 3 minutes. The highest galacturonic acid content is pectin extracted with microwave power of 800 W for 7 minutes. Figure 14 shows the relationship between microwave power and extraction time to galacturonic content.
Figure 14. The relationship between microwave power and extraction time to galacturonic content.
Figure 14 showed that the galacturonic content would increase when microwave power and extraction time was increased. This was due to the length of the protopectin hydrolysis reaction so that the galacturonic levels produced were also increasing. Results of analysis of variance showed that the microwave power and extraction time significantly affected the galacturonic content of pectin, but interaction between microwave power and extraction time was not significantly affect the galacturonic content of pectin (Appendix 6b).
FDA of Thailand (1986) determined that minimum anhidrouronic acid content in commercial pectin minimum is 35%. Pectin that extracted longer with higher microwave powe