© 2013 International Bank for Reconstruction and Development/The World Bank 1818 H Street NW, Washington, DC 20433
Telephone: 202-473-1000; Internet: www.worldbank.org Some rights reserved
1 2 3 4 15 14 13 12
A copublication of The World Bank and the International Finance Corporation.
This work is a product of the staf of The World Bank with external contributions. Note that The World Bank does not necessarily own each component of the content included in the work. The World Bank therefore does not warrant that the use of the content contained in the work will not infringe on the rights of third parties. The risk of claims resulting from such infringement rests solely with you.
The findings, interpretations, and conclusions expressed in this work do not necessarily reflect the views of The World Bank, its Board of Executive Directors, or the governments they represent. The World Bank does not guarantee the accu-racy of the data included in this work. The boundaries, colors, denominations, and other information shown on any map in this work do not imply any judgment on the part of The World Bank concerning the legal status of any territory or the endorsement or acceptance of such boundaries.
Nothing herein shall constitute or be considered to be a limitation upon or waiver of the privileges and immunities of The World Bank, all of which are specifically reserved.
Rights and Permissions
This work is available under the Creative Commons Attribution 3.0 Unported license (CC BY 3.0) http://creative commons.org/licenses/by/3.0. Under the Creative Commons Attribution license, you are free to copy, distribute, transmit, and adapt this work, including for commercial purposes, under the following conditions:
Attribution—Please cite the work as follows: World Bank. 2013. Doing Business 2014: Understanding Regulations for Small and Medium-Size Enterprises. Washington, DC: World Bank Group. DOI: 10.1596/978-0-8213-9984-2. License: Creative Commons Attribution CC BY 3.0
Translations—If you create a translation of this work, please add the following disclaimer along with the attribution: This translation was not created by The World Bank and should not be considered an oicial World Bank translation. The World Bank shall not be liable for any content or error in this translation.
All queries on rights and licenses should be addressed to World Bank Publications, The World Bank Group, 1818 H Street NW, Washington, DC 20433, USA; fax: 202-522-2625; e-mail: [email protected].
Additional copies of all 11 editions of Doing Business may be purchased at www.doingbusiness.org. ISBN (paper): 978-0-8213-9984-2
Doing Business
2014
Understanding Regulations for Small
and Medium-Size Enterprises
Comparing Business Regulations for Domestic Firms in
189
Economies
Current features
News on the Doing Business project http://www.doingbusiness.org
Rankings
How economies rank—from 1 to 189 http://www.doingbusiness.org/rankings
Data
All the data for 189 economies—topic rankings, indicator values, lists of regu-latory procedures and details underlying indicators
http://www.doingbusiness.org/data
Reports
Access to Doing Business reports as well as subnational and regional reports, re-form case studies and customized econ-omy and regional profiles
http://www.doingbusiness.org/reports
Methodology
The methodologies and research papers underlying Doing Business
http://www.doingbusiness.org/methodology
Research
Abstracts of papers on Doing Business topics and related policy issues
http://www.doingbusiness.org/research
Doing Business
reforms
Short summaries of DB2014 business regulation reforms, lists of reforms since DB2008 and a ranking simulation tool http://www.doingbusiness.org/reforms
Historical data
Customized data sets since DB2004 http://www.doingbusiness.org/custom-query
Law library
Online collection of business laws and regulations relating to business and gen-der issues
http://www.doingbusiness.org/law-library http://wbl.worldbank.org
Contributors
More than 10,200 specialists in 189 econ-omies who participate in Doing Business http://www.doingbusiness.org/contributors/ doing-business
Entrepreneurship data
Data on business density (number of new-ly registered companies per 1,000 work-ing-age people) for 139 economies http://www.doingbusiness.org /data/ exploretopics/entrepreneurship
Distance to frontier
Data benchmarking 189 economies to the frontier in regulatory practice
http://www.doingbusiness.org/data/dis-tance-to-frontier
Information on good practices
Showing where the many good practic-es identified by Doing Business have been adopted
http://www.doingbusiness.org /data/ good-practice
Doing Business
iPhone App
Doing Business at a Glance presents the full report, rankings and highlights from each indicator for the iPhone, iPad and iPod touch
http://www.doingbusiness.org/special-features/iphone
Resources on the
Contents
Doing Business 2014 is the 11th in a series of annual reports investigating the reg-ulations that enhance business activity and those that constrain it. Doing Business presents quantitative indicators on business regulations and the protection of property rights that can be compared across 189 economies—from Afghani-stan to Zimbabwe—and over time.
Regulations afecting 11 areas of the life of a business are covered: starting a business, dealing with construction permits, getting electricity, registering property, getting credit, protecting investors, paying taxes, trading across borders, enforcing contracts, resolving insolvency and employing workers. The employing workers data are not includ-ed in this year’s ranking on the ease of doing business.
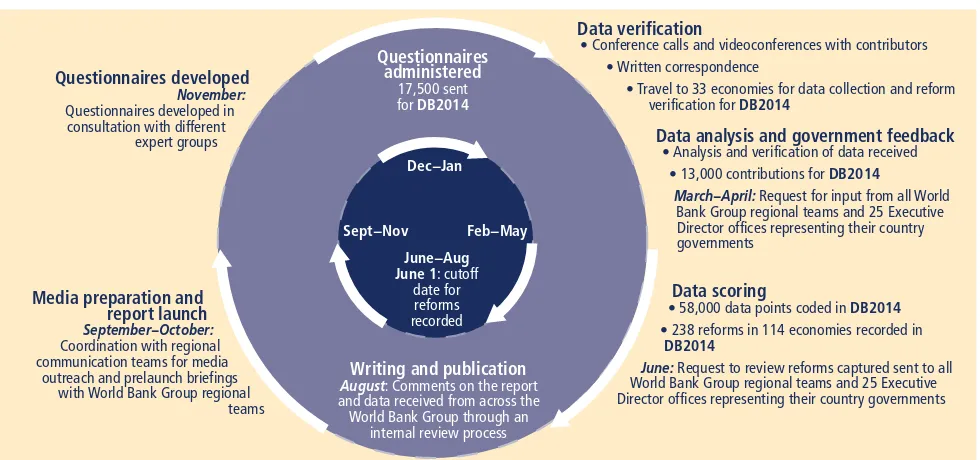
Data in Doing Business 2014 are current as of June 1, 2013. The indicators are used to analyze economic outcomes and identify what reforms of business regulation have worked, where and why.
v Preface
1 Overview
20 About Doing Business: measuring for impact 30 Research on the efects of business regulations
Case studies
41 Why are minimum capital requirements a concern for entrepreneurs? 46 What role should risk-based inspections play in construction? 52 Tackling high electricity connection costs: Trinidad and Tobago’s new
approach
56 Implementing electronic tax filing and payments in Malaysia
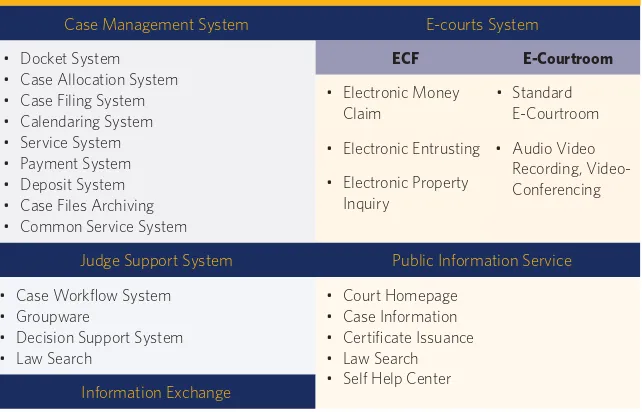
60 Implementing trade single windows in Singapore, Colombia and Azerbaijan 66 Improving court eiciency: the Republic of Korea’s e-court experience
Topic notes 72 Starting a business
77 Dealing with construction permits 82 Getting electricity
86 Registering property 90 Getting credit 96 Protecting investors 100 Paying taxes
105 Trading across borders 110 Enforcing contracts
114 Resolving insolvency
118 Annex: employing workers
123 References
130 Data notes
155 Ease of doing business and distance to frontier
159 Summaries of Doing Business reforms in 2012/13 173 Country tables
237 Employing workers data
A thriving private sector—with new firms entering the market, creating jobs and developing innovative products—con-tributes to a more prosperous society. Governments play a crucial role in sup-porting a dynamic ecosystem for firms. They set the rules that establish and clarify property rights, reduce the cost of resolving disputes and increase the predictability of economic transactions. Without good rules that are evenly en-forced, entrepreneurs have a harder time starting and growing the small and me-dium-size firms that are the engines of growth and job creation for most econo-mies around the world.
Doing Business2014 is the 11th in a series of annual reports benchmarking the regu-lations that afect private sector firms, in particular small and medium-size enter-prises. The report presents quantitative indicators on 11 areas of business regula-tion for 189 economies. Four economies have been added this year—Libya, Myan-mar, San Marino and South Sudan. The data are current as of June 2013.
The Doing Business project aims to deliv-er a body of knowledge that will catalyze reforms and help improve the quality of the rules underpinning the activities of the private sector. This matters because in a global economy characterized by constant change and transformation, it makes a diference whether the rules are sensible or excessively burdensome, whether they create perverse incentives or help establish a level playing field, whether they safeguard transparency and encourage adequate levels of competi-tion. To have a tool that allows economies to track progress over time and with re-spect to each other in the development of the building blocks of a good business environment is crucial for the creation of
a more prosperous world, with increased opportunities for everyone
We have been excited to see a global convergence toward good practices in business regulations. The data show that economies in all regions of the world and of all income levels have made important strides in improving the quality of the rules underpinning private sector activi-ty. This year the findings have been even more encouraging—low-income econo-mies have improved their business regu-lations at twice the rate that high-income economies have.
These developments support the twin World Bank Group goals of ending ex-treme poverty and boosting shared pros-perity. By providing useful insights into good practices worldwide in business regulations, Doing Business helps mobi-lize policy makers to reduce the cost and complexity of government procedures and to improve the quality of institutions. Such change serves the underprivileged the most—where more firms enter the formal sector, entrepreneurs have a great-er chance to grow their businesses and produce jobs, and workers are more likely to enjoy the benefit of regulations such as social protections and safety regulations. We encourage you to give feedback on the Doing Business website (http://www. doingbusiness.org) and join the conversa-tion as we shape the project in the years to come to make it a more efective mech-anism for better business regulation.
Sincerely,
Sri Mulyani Indrawati Managing Director World Bank Group
Preface
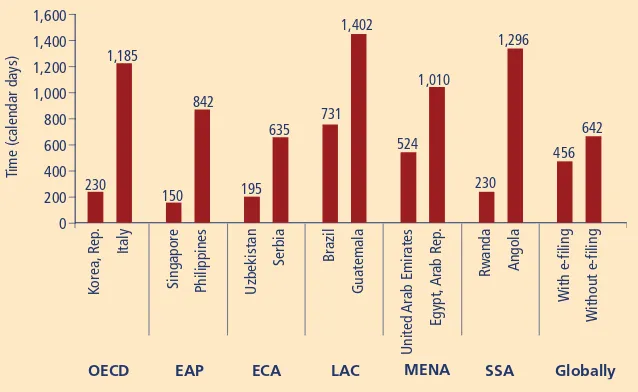
Regulation is a reality from the beginning of a firm’s life to the end (figure 1.1). Nav-igating it can be complex and costly. On average around the world, starting a busi-ness takes 7 procedures, 25 days and costs 32% of income per capita in fees. But while it takes as little as 1 procedure, half a day and almost nothing in fees in New Zealand, an entrepreneur must wait 208 days in Suriname and 144 in República Bolivariana de Venezuela. And this is just the tip of the iceberg. Con-sider what the new firm must go through to complete other transactions at the average level of time and efort required around the world. Preparing, filing and paying the firm’s annual taxes could take up another 268 hours of its staf’s time. Ex-porting just one shipment of its final prod-ucts could take 6 documents, 22 days and more than $1,500. If the firm needs a sim-ple warehouse, getting the facility ready to start operating could take 26 procedures and 331 days more—to buy the land, reg-ister its ownership, build the warehouse and get electricity and other utility con-nections. Having sorted out these initial formalities, if the firm becomes embroiled in a legal dispute with one of its suppliers or customers, resolving the dispute could mean being stuck in court for 622 days, with costs amounting to 35% of the value of the claim.
To operate and expand, the firm will need financing—from shareholders or from creditors. Raising money in the capital market is easier and less costly where minority shareholders feel protected from self-interested transactions by large shareholders. Good corporate governance rules can provide this kind of protection. But among the 189 economies covered by Doing Business, 46 still have only very lim-ited requirements for disclosing majority
shareholders’ conflicts of interest—or none at all. This undermines trust in the system, making it less likely that investors will take a minority stake in a firm. Similarly, creditors need guarantees that their loans will be repaid. Information about potential borrowers and solid le-gal rights for creditors play an impor-tant part in providing those guarantees. Yet institutions providing these are not universal among the 189 economies: 35 have no credit bureau or registry that distributes information about borrowers, and 124 lack a modern collateral regis-try where a creditor can check whether a movable asset being pledged as collat-eral has any other liens on it. If despite all eforts the firm ends up insolvent, having institutions in place that enable creditors to recover their assets is also important. On average around the world, creditors recover no more than 35% of their initial loan in case of bankruptcy as measured by Doing Business.
In many parts of the world in recent years, Doing Business data show that there has been remarkable progress in removing some of the biggest bureaucratic obsta-cles to private sector activity. Yet small and medium-size enterprises still are subject to burdensome regulations and vague rules that are unevenly applied and that impose ineiciencies on the en-terprise sector. This curtails the overall competitiveness of economies and their potential for creating jobs.
WHAT DOES
DOING BUSINESS
MEASURE—AND WHO
PERFORMS WELL?
Through its indicators Doing Business measures and tracks changes in the
Overview
• In 2012/13, 114 economies implemented 238 regulatory reforms making it easier to do business—18% more reforms than in the previous year. • If economies around the world
followed the best practice in regulatory processes for starting a business, entrepreneurs would spend 45.4 million fewer days each year satisfying bureaucratic requirements. • Ukraine, Rwanda, the Russian
Federation, the Philippines and Kosovo are among the economies improving the most in 2012/13 in areas tracked by Doing Business. • Reforms reducing the complexity and
cost of regulatory processes continue to be the most common. Less than a third of the reforms recorded by Doing Business in 2012/13—and in the years since 2009—focused on strengthening legal institutions. • Sub- Saharan Africa is home to 9 of
the 20 economies narrowing the gap with the regulatory frontier the most since 2009. Low- income economies narrowed this gap twice as much as high- income economies did. • Economies that improve in areas
measured by Doing Business are on average more likely than others to also implement reforms in other areas—such as governance, health, education and gender equality. • Economies that perform well
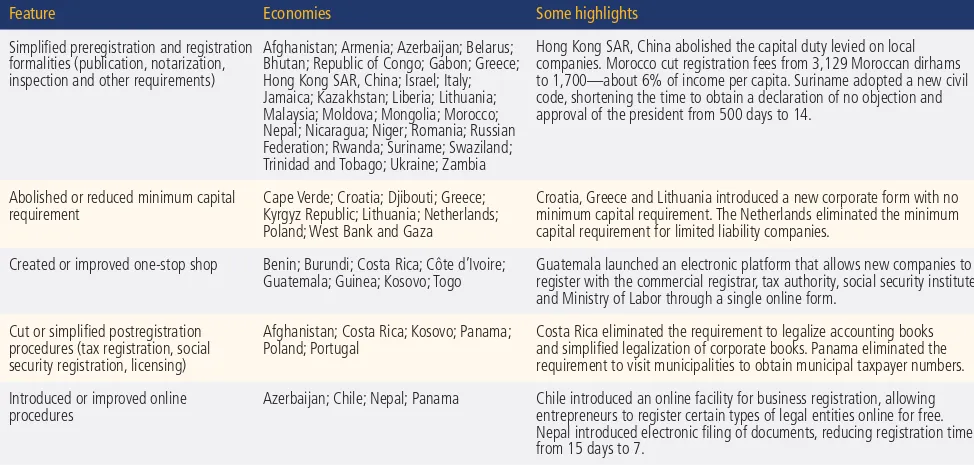
regulations applying to domestic small and medium-size companies, operating in the largest business city of each econ-omy, in 10 areas in their life cycle: starting a business, dealing with construction per-mits, getting electricity, registering prop-erty, getting credit, protecting investors, paying taxes, trading across borders, en-forcing contracts and resolving insolven-cy. The aggregate ranking on the ease of doing business is based on these indica-tors. Doing Business also documents reg-ulations on employing workers, which are not included in the aggregate ranking. In addition, Doing Business tracks good prac-tices around the world to provide insights into how governments have improved the regulatory environment in the past in the areas that it measures (see table 1.5 at the end of this overview).
Regulations that protect consumers, shareholders and the public without over-burdening firms help create an environ-ment where the private sector can thrive. Sound business regulation requires both eicient procedures and strong institu-tions that establish transparent and en-forceable rules. Doing Business measures both these elements: through indicators relating to the strength of legal institu-tions relevant to business regulation and
through indicators relating to the com-plexity and cost of regulatory processes. The indicators in the first group measure the strength of the legal and regulatory framework for getting credit, protecting investors, enforcing contracts and resolv-ing insolvency. Those in the second group measure the cost and eiciency of regu-latory processes for starting a business, dealing with construction permits, getting electricity, registering property, paying taxes and trading across borders. Based on time-and-motion case studies from the perspective of the business, these indicators measure the procedures, time and cost required to complete a trans-action in accordance with the relevant regulations (for a detailed explanation of the Doing Business methodology, see the data notes and the chapter “About Doing Business”).
Doing Business is not about less regulation but about better regulation. According-ly, some Doing Business indicators give a higher score for better and more devel-oped regulation, as the protecting inves-tors indicainves-tors do for stricter disclosure requirements for related-party transac-tions. Other indicators, such as those on dealing with construction permits, automatically assign the lowest score to
economies that have no regulations in the area being measured or do not apply their regulations (considered “no practice” economies), penalizing them for lacking appropriate regulation.
The economies ranking highest on the ease of doing business therefore are not those with no regulation but those whose governments have managed to create a regulatory system that facilitates inter-actions in the marketplace and protects important public interests without unnec-essarily hindering the development of the private sector—in other words, a regula-tory system with strong institutions and low transactions costs (table 1.1). These economies all have both a well-developed private sector and a reasonably eicient regulatory system that has managed to strike a sensible balance between the protections that good rules provide and the need to have a dynamic private sec-tor unhindered by excessively burden-some regulations.
WHERE IS THE REGULATORY
GAP WIDER?
To complement the ease of doing busi-ness ranking, a relative measure, Doing Business 2012 introduced the distance to frontier, an absolute measure of business regulatory eiciency. This measure aids in assessing how much the regulatory environment for local entrepreneurs im-proves in absolute terms over time by showing the distance of each economy to the “frontier,” which represents the best performance by any economy ob-served on each of the Doing Business in-dicators since 2003 or the year in which data for the indicator were first collect-ed. Because the distance to frontier is an absolute measure, it can be used for comparisons over time. The measure is normalized to range between 0 and 100, with 100 representing the frontier. A higher score indicates a more eicient business environment and stronger legal institutions (for a detailed description of the methodology, see the chapter on the ease of doing business and distance to frontier).
Analysis based on the distance to fron-tier measure shows that on average across all regions, economies are closest FIGURE 1.1 Regulations as measured by Doing Business affect firms throughout
their life cycle
At start-up
In getting a location
D
In getting financing
When things go wrong
In daily operations
TABLE 1.1 Rankings on the ease of doing business
Rank Economy
DB2014
reforms Rank Economy
DB2014
reforms Rank Economy
DB2014 reforms
1 Singapore 2 64 St. Lucia 0 127 Honduras 0
2 Hong Kong SAR, China 1 65 Italy 3 128 Egypt, Arab Rep. 0
3 New Zealand 1 66 Trinidad and Tobago 1 129 Kenya 0
4 United States 0 67 Ghana 0 130 Bangladesh 1
5 Denmark 0 68 Kyrgyz Republic 0 131 Bosnia and Herzegovina 0
6 Malaysia 3 69 Turkey 3 132 Uganda 1
7 Korea, Rep. 1 70 Azerbaijan 3 133 Yemen, Rep. 0
8 Georgia 1 71 Antigua and Barbuda 0 134 India 0
9 Norway 0 72 Greece 3 135 Ecuador 1
10 United Kingdom 2 73 Romania 3 136 Lesotho 1
11 Australia 1 74 Vanuatu 1 137 Cambodia 0
12 Finland 0 75 Czech Republic 1 138 West Bank and Gaza 1
13 Iceland 1 76 Mongolia 3 139 Mozambique 2
14 Sweden 1 77 Dominica 0 140 Burundi 6
15 Ireland 0 78 Moldova 3 141 Bhutan 2
16 Taiwan, China 0 79 Guatemala 3 142 Sierra Leone 0
17 Lithuania 2 80 Seychelles 0 143 Tajikistan 2
18 Thailand 1 81 San Marino 0 144 Liberia 2
19 Canada 0 82 St. Vincent and the Grenadines 0 145 Tanzania 2
20 Mauritius 3 83 Zambia 1 146 Uzbekistan 6
21 Germany 0 84 Bahamas, The 2 147 Nigeria 0
22 Estonia 1 85 Sri Lanka 4 148 Madagascar 2
23 United Arab Emirates 3 86 Kosovo 3 149 Sudan 0
24 Latvia 4 87 Morocco 3 150 Gambia, The 1
25 Macedonia, FYR 6 88 Uruguay 1 151 Iraq 0
26 Saudi Arabia 0 89 Croatia 5 152 Iran, Islamic Rep. 0
27 Japan 0 90 Albania 1 153 Algeria 0
28 Netherlands 2 91 Barbados 0 154 Burkina Faso 1
29 Switzerland 0 92 Russian Federation 5 155 Mali 0
30 Austria 0 93 Serbia 0 156 Micronesia, Fed. Sts. 0
31 Portugal 1 94 Jamaica 3 157 Togo 3
32 Rwanda 8 95 Maldives 1 158 Comoros 1
33 Slovenia 1 96 China 2 159 Lao PDR 1
34 Chile 1 97 Solomon Islands 0 160 Djibouti 3
35 Israel 2 98 Namibia 0 161 Suriname 2
36 Belgium 0 99 Vietnam 2 162 Bolivia 0
37 Armenia 2 100 Palau 2 163 Gabon 3
38 France 1 101 St. Kitts and Nevis 0 164 Afghanistan 2
39 Cyprus 0 102 Costa Rica 2 165 Syrian Arab Republic 0
40 Puerto Rico (U.S.) 0 103 Malta 1 166 Equatorial Guinea 0
41 South Africa 1 104 Kuwait 1 167 Côte d'Ivoire 4
42 Peru 0 105 Nepal 1 168 Cameroon 0
43 Colombia 2 106 Belize 0 169 São Tomé and Príncipe 0
44 Montenegro 2 107 Grenada 0 170 Zimbabwe 0
45 Poland 2 108 Philippines 3 171 Malawi 1
46 Bahrain 1 109 Paraguay 1 172 Timor-Leste 0
47 Oman 0 110 Pakistan 0 173 Mauritania 1
48 Qatar 1 111 Lebanon 0 174 Benin 2
49 Slovak Republic 0 112 Ukraine 8 175 Guinea 3
50 Kazakhstan 2 113 Papua New Guinea 0 176 Niger 2
51 Tunisia 0 114 Marshall Islands 0 177 Haiti 0
52 Spain 1 115 Guyana 1 178 Senegal 1
53 Mexico 3 116 Brazil 0 179 Angola 0
54 Hungary 0 117 Dominican Republic 0 180 Guinea-Bissau 1
55 Panama 4 118 El Salvador 1 181 Venezuela, RB 1
56 Botswana 1 119 Jordan 0 182 Myanmar 1
57 Tonga 1 120 Indonesia 1 183 Congo, Dem. Rep. 3
58 Bulgaria 0 121 Cape Verde 2 184 Eritrea 0
59 Brunei Darussalam 1 122 Kiribati 0 185 Congo, Rep. 3
60 Luxembourg 0 123 Swaziland 2 186 South Sudan 0
61 Samoa 0 124 Nicaragua 2 187 Libya 0
62 Fiji 0 125 Ethiopia 0 188 Central African Republic 1
63 Belarus 4 126 Argentina 1 189 Chad 1
Note: The rankings for all economies are benchmarked to June 2013 and reported in the country tables. This year‘s rankings on the ease of doing business are the average of the economy‘s percentile rankings on the 10 topics included in this year‘s aggregate ranking. The number of reforms excludes those making it more difficult to do business. Source: Doing Business database.
growth of new firms, discouraging entre-preneurship.
WHAT IS THE BIGGER PICTURE?
Doing Business recognizes that the state plays a fundamental role in private sec-tor development. Governments support economic activity by establishing and enforcing rules that clarify property rights and reduce the cost of resolving disputes, that increase the predictability of eco-nomic interactions and that provide con-tractual partners with core protections against abuse. So it is no surprise to find that there is no evidence suggesting that economies that do well on Doing Business indicators tend to have governments driv-en by a “smaller governmdriv-ent” philosophy. Indeed, the data suggest otherwise. It is generally the bigger governments (as measured by government consumption expenditure as a percentage of GDP), not the small ones, that tend to provide more of the protections and eicient rules pro-moted by Doing Business.
Economies performing well on Doing Business indicators include examples with large governments as well as those performance across areas of regulation
measured by Doing Business. Rankings of economies in these areas provide anoth-er. The ease of doing business ranking is just one number—aggregating an average of more than 300 data points for each economy. Not surprisingly, the full set of rankings and data across Doing Busi-ness topics for an economy can present a very diferent picture than the aggregate ranking (figure 1.3). Take Estonia, which stands at 22 in the ease of doing business ranking. Its rankings on individual topics range from 7 in trading across borders to 68 in protecting investors. Japan’s low-est 3 rankings (in paying taxes, starting a business and dealing with construction permits) average 117, while its highest 3 (in resolving insolvency, protecting investors and trading across borders) average 13. Ja-pan’s ranking on the overall ease of doing business is 27. Three economies added to the Doing Business sample this year—Lib-ya, Myanmar and South Sudan—show similar variation across topics (box 1.1). This variation can point to important reg-ulatory obstacles for firms. An economy may make it easy to start a business, for example. But if getting financing is dif-ficult, the constraints will hamper the to the frontier—or best practice—in the
area of starting a business. And they are furthest from the frontier on average in resolving insolvency. Starting a busi-ness is also the area where all regions are closest together, in line with the ev-idence on convergence presented later in the overview. Performance in such areas as getting credit, enforcing contracts and resolving insolvency varies considerably across regions.
Across most areas measured by Doing Business, OECD high-income economies are closer to the frontier on average than those of any other region (figure 1.2). The exceptions are starting a business and registering property, where Europe and Central Asia is slightly ahead. Sub-Saha-ran African economies are furthest from the frontier on average in 6 of the 10 areas measured by Doing Business: starting a business, getting electricity, paying taxes, trading across borders, protecting inves-tors and resolving insolvency
Regional performance varies considerably across the areas measured by Doing Busi-ness. In several areas Europe and Central Asia has an average performance similar to that of OECD high-income economies. But in dealing with construction permits this region is further from the regulatory frontier than any other. East Asia and the Pacific follows Europe and Central Asia closely in some areas but outperforms that region in dealing with construction permits, getting electricity, paying taxes and trading across borders. Latin America and the Caribbean has a performance re-markably similar to that of East Asia and the Pacific except in paying taxes.
The Middle East and North Africa has a very diverse performance. In some ar-eas, such as paying taxes, it is almost as close to the frontier as OECD high-in-come economies. In other areas, such as getting credit, the Middle East and North Africa has the lowest performance among regions. South Asia has a gap with the frontier similar to that of Sub-Saharan Africa in most areas, though it substan-tially outperforms that region in 3 areas— starting a business, resolving insolvency and getting credit.
The distance to frontier measure pro-vides one perspective on variation in
FIGURE 1.2 OECD high-income economies are closest to the frontier in regulatory practice
Average
distance to
frontier
(percentage points)
Starting a business Dealing with
construction permits Getting electricity
Registering property Paying taxes
South Asia
East Asia & Pacific Latin America & Caribbean
Sub-Saharan Africa
OECD high income Europe & Central Asia
Middle East & North Africa 20
30 40 50 60 70 80 90 100
Trading across borders Getting credit
Enforcing contracts Protecting investors Resolving insolvency
Regulatory frontier
Source: Doing Business database.
with small ones. Denmark, with among the largest governments in the world, is number 5 in the ease of doing business ranking; the Netherlands, also with one of the largest governments, is number 28. Hong Kong SAR, China, with a relative-ly small government, is number 2 in the ranking. Economies performing poorly on Doing Business indicators also include examples with large and small ments. Zimbabwe, with a large govern-ment relative to GDP, ranks at 170; Equa-torial Guinea, with a small government, ranks at 166. Nevertheless, on average economies with smaller governments do not perform better on Doing Business indicators than those with larger govern-ments (figure 1.4).
Moreover, economies performing well on Doing Business indicators are on average more inclusive along at least 2 dimen-sions. They tend to have smaller informal sectors, meaning that more people have access to the formal market and can benefit from such regulations as social protections and workplace safety regula-tions (figure 1.5). And they are more like-ly to have gender equality under the law as measured by the World Bank Group’s Women, Business and the Law indica-tors.1 These 2 aspects of inclusiveness reflect in part a desire by governments
to more efectively allocate resources. This means not hampering the produc-tivity of formal businesses through over-ly burdensome rules. And it means not needlessly depriving the economy of the skills and contributions of women. Over-all, economies with smarter business regulations are more likely to nurture an environment conducive to greater eco-nomic inclusion.
No set of indicators can possibly capture the full complexity of a particular reali-ty—in the case of the Doing Business indi-cators, that faced by entrepreneurs as they go about their activities while attempting to comply with the rules established by government. Having a state-of-the-art business registry has less impact on job creation or private sector investment in an economy if roads are lacking, crime is FIGURE 1.3 An economy’s regulatory environment may be more business-friendly in some areas than in others
Hong Kong SAR, China
United States
Singapore
Korea, Rep.
Georgia Finland Iceland
Taiwan, China
Ireland Estonia Mauritius Germany Portugal
Switzerland Saudi Arabia Austria Rwanda France
Belgium
Qatar
Bahrain Armenia Israel Spain Poland
Puerto Rico (U.S.) Slovak Republic
Hungary
Luxembourg
Mexico St. Lucia Greece Bulgaria
St. Vincent and the Grenadines
Kyrgyz Republic
Italy
Ghana
Vanuatu
Guatemala
Bahamas, The
Morocco Zambia San Marino Barbados
Kosovo
Solomon Islands
St. Kitts and Nevis
Vietnam Maldives Namibia Costa Rica Grenada
Albania Belize Ukraine Lebanon Guyana
Cape Verde
Papua New Guinea
Kiribati
Indonesia El Salvador Ecuador Bhutan Argentina Bangladesh Honduras
Lesotho Kenya
Uzbekistan
India
Tanzania
Mozambique Gambia, The
Micronesia, Fed. Sts.
Sudan Nigeria
Comoros
Iran, Islamic Rep. Equatorial Guinea
Syrian Arab Republic
Afghanistan
Djibouti Bolivia Cameroon Zimbabwe Mauritania
Haiti
Angola Guinea
Guinea-Bissau
Myanmar
Libya
Congo, Rep.
Central African Republic
Average ranking
0 20 80 120 180 160 140
100
60
40 Average of all topic rankingsAverage of lowest 3 topic rankings
Average of highest 3 topic rankings
Note: Rankings reflected are those on the 10 Doing Business topics included in this year’s aggregate ranking on the ease of doing business. Figure is illustrative only; it does not include all 189 economies covered by this year’s report. See the country tables for rankings on the ease of doing business and each Doing Business topic for all economies.
Source: Doing Business database.
FIGURE 1.4 Good performance on Doing Business indicators is not associated with smaller governments
60 80 100
0 10 20 30 40
20
General government final consumption expenditure as % of GDP, 2012
Distance to frontier (percentage points),
2012
40
Note: The correlation between the distance to frontier and government expenditure is 0.20 and significantly different from zero.
Source: Doing Business database; World Bank, World Development Indicators database.
DOING BUSINESS 2014 6
BOX 1.1 The right time to improve business regulations
For the first time, this year’s report measures business regulations in Libya, Myanmar and South Sudan, economies that emerged from conflict or are starting to open up to the global economy after years of isolation. This is the right time to improve business regulations. Old laws and regulations still apply in Myanmar, including the Companies Act of 1914, the Code of Civil Procedure of 1908 and the Evidence Act, 1872. In Libya the civil code and the civil and commercial procedure codes all date back to 1953. In South Sudan the challenge is not updating old laws and regulations but creating new ones from scratch. This process takes time. Yet since independence in 2011, South Sudan has passed a company law, tax law and insolvency law.
Doing Business provides baseline data that can help inform policy makers designing laws and their implementation. Data in this year’s report show that these 3 economies rank among the bottom 10 on the ease of doing business. Although their performance varies somewhat across Doing Business topics, the data consistently show that these economies have complex and costly regulatory procedures and weak institutions relevant to business regulation (see figure). But in all 3 economies new laws are under discussion that may afect future editions of the Doing Business data. Doing Business will continue to measure and monitor potential improvements.
In economies afected by conflict, reforming business regulations is almost always a diicult task—even as firms often face increasing challenges in the business regulatory environment. Civil strife, a substantial weakening in the state’s ability to enforce the law and other characteristics of conflict-afected states often bring about a substantial worsening of the conditions in which the private sector operates. The Syrian Arab Republic was the economy that showed the greatest deterioration in 2012/13 in the areas measured by Doing Business. The time and cost associated with trading across borders increased substantially, for example, and no building permits are being issued in Damascus, making it impossible to legally build new construction.
Yet there is encouraging news from other fragile and conflict-afected states. A recently published report, Doing Business in the g7+ 2013, shows that all economies in the g7+ group have improved their business regulatory environment since 2005, narrowing the gap with the best performance observed globally by Doing Business.a Sierra Leone, Burundi, Guinea-Bissau, Timor-Leste, Côte d’Ivoire, Togo and the Solomon Islands are all among the 50 economies making the biggest improvements between 2005 and 2012.
a. A special report, Doing Business in the g7+ 2013 compares business regulations in economies of the g7+ group: Afghanistan, Burundi, the Central African Republic, Chad, the Comoros, the Democratic Republic of Congo, Côte d’Ivoire, Guinea, Guinea-Bissau, Haiti, Liberia, Papua New Guinea, Sierra Leone, the Solomon Islands, South Sudan, Timor-Leste and Togo. The g7+ group is a country-owned and country-led global mechanism established in April 2010 to monitor, report and draw attention to the unique challenges faced by fragile states.
There are many areas for regulatory improvement in fragile and conflict-affected states
Global ranking, by Doing Business topic
Libya
Middle East & North Africa
Libya
Myanmar
East Asia & Pacific
Myanmar
South Sudan Sub-Saharan AfricaSouth
Sudan
Syrian Arab Republic Middle East & North AfricaSyrian
Arab
Republic
189 150 126 154 170 182 107 113 188 155 100 76 79 92 81 86 73 75 91 108Starting a business
Getting electricity Registering property Getting credit Protecting investors Paying taxes Trading across borders Enforcing contracts 135 189 82 82 180 115 120 147 179 120 112 108 77 93 133 113 64 89 118 105
Starting a business
Getting electricity Registering property Getting credit Protecting investors Paying taxes Trading across borders Enforcing contracts Resolving insolvency 171 189 68 189 186 187 116 143 150 189 112 108 77 93 133 113 64 89 118 105 Starting a business Dealing with construction permits Getting electricity Registering property Getting credit Protecting investors Paying taxes Trading across borders Enforcing contracts Resolving insolvency 140 171 184 183 180 182 92 187 87 189 124 117 135 121 113 114 126 141
123 134 Gettingelectricity
Registering property Getting credit Protecting investors Paying taxes
Dealing with construction permits Resolving insolvency Dealing with construction permits Starting a business Resolving insolvency Enforcing contracts Trading across borders Dealing with construction permits
rampant and state capture or corruption is the norm. To understand the challeng-es faced by businchalleng-esschalleng-es, the Doing Business rankings and underlying data therefore need to be used in conjunction with oth-er information. Of course, sound business regulations are not the only thing on which a thriving business environment depends. Other areas beyond the focus of Doing Busi-ness are also important—including stable macroeconomic policy, a well-educated workforce and well-developed infrastruc-ture, just to name a few.
WHAT GAINS WERE ACHIEVED
IN 2012/13?
Reforming in any area of government policy is a challenge. Business regulation is no ex-ception. Implementing regulatory changes often requires agreement among multiple agencies in a government. Consider a one-stop shop for business registration. Creat-ing one involves coordination across the business registry, the statistical oice, the municipal tax oice and the state tax of-fice, to name just a few. But 96 economies have nevertheless done so.
Governments undertake such reforms be-cause reducing the complexity and cost of regulatory processes or strengthening le-gal institutions relevant to business regu-lation brings many benefits. Governments benefit from cost savings because the new systems often are easier to maintain (though setting up a new system involves
an initial fixed cost). Firms benefit from more streamlined and less costly process-es or more reliable institutions. And econ-omies as a whole benefit from new firm start-ups, more jobs, growth in trade and greater overall economic dynamism (see the chapter on research on the efects of business regulations).
In 2012/13 such eforts continued around the world: 114 economies implement-ed 238 regulatory reforms making it easier to do business, about 18% more reforms than in the previous year. This is the second highest number of reforms implemented in a year since the financial crisis of 2009.
Inroads in reducing formalities
The results of these reforms are tangible. They can be quantified by adding up all the regulatory procedures, payments and doc-uments required for a small to medium- size firm to complete a set of transac-tions—such as to start a business, regis-ter property and so on—in every economy covered by Doing Business. In 2012 such formalities would have come to a to-tal of 21,272 and taken 248,745 days to complete (table 1.2). Thanks to the reg-ulatory reforms undertaken in 2012/13, this regulatory maze now contains about 300 (1.3%) fewer formalities than in 2012.2 Compared with 2005, the first year in which data for 9 of the 10 Doing Business indicator sets were first collect-ed, the number of formalities has fallenby about 2,400 (11%) and the time by about 40,000 days.
These calculations are for a hypothetical case taking 1 firm through all procedures measured by Doing Business in every economy covered. But some economies are much larger than others, and in these economies the burden of poor regula-tion afects a larger number of firms. In the 107 economies covered by both Doing Business and the World Bank’s Entrepre-neurship Database, an estimated 3.1 mil-lion limited liability companies were newly registered in 2012 alone.3 Assuming that they followed the rules and regulations for company incorporation in their home economy as measured by Doing Busi-ness, these 3.1 million firms together dealt with 18.7 million diferent procedures and spent 46.9 million days to get incorpo-rated. But if all 107 economies followed best practice in regulatory processes for starting a business, these new firms would have had to spend only 1.5 million days dealing with the local bureaucracy, leaving them a greater share of their time and en-trepreneurial energy to devote to their new business. In other words, because not all economies followed best practice, entre-preneurs spent an extra 45.4 million days satisfying bureaucratic requirements.
Patterns across regions
Patterns of regulatory reform vary across regions. In 2012/13 South Asia had the largest share of economies (75%) with FIGURE 1.5 Good performers on Doing Business indicators are likely to be more inclusive—with a smaller informal sector and greater
gender equality under the law
Distance to frontier
(percentage points),
2013
Number of restrictions for women in the law, 2013 60
80 100
10 20 30 40
20
Informal sector as % of GDP, 2007
Distance to frontier
(percentage points),
2007
40
50 60
60 80 100
0 10 20 30
20 40
Note: The correlation between the distance to frontier and the size of the informal sector is −0.65. The correlation between the distance to frontier and the number of restrictions for women in the law is −0.34. Both relationships are significant at the 1% level after controlling for income per capita. The number of restrictions for women in the law refers to those measured by Women, Business and the Law, a data set capturing 47 legal restrictions on women’s employment and entrepreneurship.
Source: Doing Business database; Schneider, Buehn and Montenegro 2010; World Bank Group, Women, Business and the Law database.
regulatory reforms in at least 1 area mea-sured by Doing Business.4 Europe and Cen-tral Asia, continuing its steady pace of regulatory reform, had the second largest share (73%), closely followed by Sub-Sa-haran Africa (66%). In East Asia and the Pacific 60% of economies had at least 1 regulatory reform, while in Latin America and the Caribbean only 53% did. The Mid-dle East and North Africa had the smallest share of economies implementing reg-ulatory reforms in at least 1 area (40%), a development that is partly linked to the current political turmoil in the region. As in previous years, reforms aimed at reducing the complexity and cost of reg-ulatory processes were more common around the world than those focused on strengthening legal institutions relevant to business regulation (figure 1.6). In South Asia, for example, 75% of econo-mies implemented at least 1 reform re-ducing regulatory complexity and cost, while only 25% had at least 1 aimed at strengthening legal institutions. The pat-tern is similar across all other regions ex-cept East Asia and the Pacific.
WHO IMPROVED THE MOST
IN 2012/13?
In 2012/13, 29 economies implemented in net 3 or more reforms improving their business regulatory systems or related institutions as measured by Doing Busi-ness. These 29 include economies from all income groups: high income (5), upper middle income (9), lower middle income (12) and low income (3). And they in-clude economies from all regions. Among the 29 economies, 10 stand out as having narrowed the distance to fron-tier the most: Ukraine, Rwanda, the Rus-sian Federation, the Philippines, Kosovo, Djibouti, Côte d’Ivoire, Burundi, the for-mer Yugoslav Republic of Macedonia and Guatemala (table 1.3). Five of these—Bu-rundi, Guatemala, FYR Macedonia, Rwan-da and Ukraine—have placed among the economies improving the most in previ-ous years. Together, 10 economies imple-mented 49 reforms making it easier to do business in 2012/13. Of these reforms, 38 were aimed at reducing the com-plexity and cost of regulatory processes and 11 at strengthening legal institutions. TABLE 1.2 Total formalities, time and cost to complete one transaction in every economy
2012 2013 Savings
Starting a business
Procedures (number) 1,393 1,335 58
Time (days) 5,590 4,700 890
Cost (US$) 203,765 201,648 2,117
Minimum capital (US$) 523,148 480,337 42,811
Dealing with construction permits
Procedures (number) 2,865 2,777 88
Time (days) 33,532 31,951 1,581
Cost (US$) 2,773,595 2,570,251 203,344
Getting electricity
Procedures (number) 1,010 1,002 8
Time (days) 20,651 20,625 26
Cost (US$) 5,640,846 5,506,263 134,583
Registering property
Procedures (number) 1,105 1,090 15
Time (days) 10,082 9,488 594
Cost (US$) 5,476,360 5,543,489 –67,129
Paying taxes
Payments (number per year) 5,141 5,046 95
Time (hours per year) 50,804 50,607 197
Trading across borders
Documents to export (number) 1,174 1,175 –1
Time to export (days) 4,171 4,132 39
Cost to export (US$ per container) 278,546 286,385 –7,839
Documents to import (number) 1,372 1,369 3
Time to import (days) 4,702 4,661 41
Cost to import (US$ per container) 334,393 344,573 –10,180
Enforcing contracts
Procedures (number) 7,212 7,207 5
Time (days) 117,847 117,489 358
Resolving insolvency
Time (years) 460 454 6
2012 2013 Total savings
Total formalities (number) 21,272 21,001 271
Total time (days) 248,745 243,283 5,462
Total cost (US$) 15,230,653 14,932,946 297,707
Source: Doing Business database.
Ukraine was the top improver in 2012/13, implementing reforms in 8 of the 10 ar-eas mthe 10 ar-easured by Doing Business. Ukraine made starting a business easier by elim-inating a separate procedure for reg-istration with the statistical oice and abolishing the fee for value added tax reg-istration. It made dealing with construc-tion permits easier by instituting a risk-based approval system that streamlined procedures for simpler buildings with fewer risk factors. And an amendment to the property rights law simplifying the process for registering ownership rights to real estate made both dealing with construction permits and registering property easier.
In addition, Ukraine’s private credit bu-reau (IBCH) began collecting data on firms from banks, expanding the infor-mation available to creditors and debtors. The introduction of simpler forms for val-ue added tax and the unified social contri-bution reduced the time required for tax compliance. The implementation of the new customs code reduced the time to
export and import. And an amendment to the bankruptcy law made resolving insol-vency easier.
Dealing with construction permits was the most common area of regulatory reform among the top improvers. Nine FIGURE 1.6 Reforms reducing regulatory complexity and cost continued to be more
common in 2012/13
Reforms to reduce complexity and cost of regulatory processes Reforms to strengthen legal institutions
75
25 69
46 60
13 50
19 42
26 32
36 30
20
South Asia East Asia
& Pacific Latin America
& Caribbean Sub-Saharan
Africa OECD highincome
Europe
& Central Asia & North Africa Middle East
Share of economies with at least 1
Doing Business
reform (%)
Note: Reforms to reduce the complexity and cost of regulatory processes are those in the areas of starting a busi-ness, dealing with construction permits, getting electricity, registering property, paying taxes and trading across borders. Reforms to strengthen legal institutions are those in the areas of getting credit, protecting investors, enforcing contracts and resolving insolvency.
Source: Doing Business database.
TABLE 1.3 The 10 economies improving the most across 3 or more areas measured by Doing Business in 2012/13
Reforms making it easier to do business
Ease of doing business
rank Starting a business
Dealing with construction
permits electricityGetting Registering property Getting credit Protecting investors Paying taxes
Trading across
borders Enforcing contracts insolvencyResolving
1 Ukraine 112
2 Rwanda 32
3 Russian Federation
92
4 Philippines 108
5 Kosovo 86
6 Djibouti 160
7 Côte d‘Ivoire 167
8 Burundi 140
9 Macedonia,
FYR 25
10 Guatemala 79
Note: Economies are selected on the basis of the number of their reforms and ranked on how much they improved in the distance to frontier measure. First, Doing Business selects the economies that implemented reforms making it easier to do business in 3 or more of the 10 topics included in this year’s aggregate ranking. Regulatory reforms making it more difficult to do business are subtracted from the number of those making it easier. Second, Doing Business ranks these economies on the improvement in their distance to frontier score from the previous year. The improvement in their score is calculated not by using the data published in 2012 but by using comparable data that capture data revisions. The choice of the most improved economies is determined by the largest improvements in the distance to frontier score among those with at least 3 reforms.
Source: Doing Business database.
of the 10 made changes in this area. Improvements in construction permit-ting often show results only after a long lag following the approval of new laws or systems. In Russia it took more than a decade for the national urban planning code of 1997 to be implemented in Mos-cow. The mayor finally adopted the code in April 2011, replacing multiple ad hoc regulations. But builders in Moscow are only now experiencing the positive ef-fects of its implementation. In Guatemala City the municipality expanded the one-stop shop for construction permitting to include the water company, EMPAGUA, in 2012.
Property registration was another com-mon focus, with 7 of the top improvers implementing changes in this area. The Rwanda Natural Resources Authority im-plemented a systematic land registration program, and now 90% of properties in the country are registered. In March 2013 Burundi established a one- stop shop for property transfers.
Guatemala, FYR Macedonia, the Philip-pines, Rwanda and Ukraine simplified the process of paying taxes for firms. Expand-ing or introducExpand-ing online filExpand-ing and pay-ment systems and simplifying tax forms were the most common features of the reforms in these economies.
Other top improvers enhanced insol-vency legislation, strengthened the le-gal rights of creditors or increased the scope of credit information available. The Philippines improved credit infor-mation sharing by guaranteeing bor-rowers’ right to access their data in the country’s largest credit bureau. In FYR Macedonia new amendments to the Law on Contractual Pledge, adopted in June 2012, allow more flexibility in the design of debt agreements using mov-able collateral. And in Djibouti a new commercial code that replaced the one from 1986 strengthened the legal rights of creditors and improved the insolven-cy framework.
Improvements to the import and export process were also common. Russia in-troduced a new data interchange sys-tem in 2009 enabling traders to submit customs declarations and supporting documents electronically. The number of users has since grown, and it is now the most popular method of submitting cus-toms declarations. Rwanda implemented an electronic single-window system in January 2013 at the Rusumo border post with Tanzania, the post used to access the port of Dar es Salaam. Connected to such institutions as the Rwanda Bureau of Standards and the Rwanda Develop-ment Board, the system allows traders to
receive verifications and approvals elec-tronically.
Four economies among the 10 top im-provers reduced the complexity and cost of getting an electricity connection. Russia made obtaining a connection simpler and less costly by streamlining procedures and setting standard connec-tion tarifs.
Only 2 of the 10 top improvers strength-ened the protections of minority inves-tors—Rwanda and FYR Macedonia. And only 1 made enforcing contracts easier— Côte d’Ivoire, by introducing a specialized commercial court.
WHO IMPROVED THE MOST IN
THE PAST 5 YEARS?
Many of the top improvers in 2012/13 have been actively reforming business regula-tions for several years. This year’s report presents the global trends since 2009. That year was chosen for 2 main reasons. First, starting with 2009 provides 5 annual data points, allowing analysis of medium-term improvements. And second, it means that the distance to frontier measure can be used to analyze the improvement across all 10 topics now included in the ease of doing business ranking, since 2009 was the first FIGURE 1.7 How far have economies moved toward the frontier in regulatory practice since 2009?
Distance to frontier (percentage points) 0
25 50 75 100
Singapore
Hong Kong SAR, China
New Zealand
Denmark
United States Korea, Rep.
United Kingdom
Ireland Norway Sweden
Malaysia Iceland Finland Georgia Australia Germany Canada
Japan
Taiwan, China
Austria
Netherlands
Thailand Lithuania
Latvia
Portugal
Switzerland
Estonia
United Arab Emirates
Mauritius Belgium
Macedonia, FYR
Israel
Saudi Arabia
Puerto Rico (U.S.)
Poland
France Spain
Slovenia
Montenegro
Rwanda
South Africa
Mexico
Peru Chile Colombia Bahrain
Qatar
Slovak Republic
Tunisia Bulgaria Cyprus
Armenia Oman Ghana
Italy
Botswana Guatemala
Turkey
Fiji
Panama
Luxembourg
Tonga
Czech Republic
Vanuatu Hungary Samoa St. Lucia Belarus
Bahamas, The
Romania Kosovo Jamaica Croatia Morocco Zambia Moldova
Antigua and Barbuda
Dominica
Belize
Trinidad and Tobago
St. Vincent and the Grenadines
Uruguay Maldives Kazakhstan Seychelles
Greece Namibia
Brunei Darussalam
Regulatory frontier
Note: The distance to frontier measure shows how far on average an economy is at a point in time from the best performance achieved by any economy on each Doing Business indicator since 2003 or the first year in which data for the indicator were collected. The measure is normalized to range between 0 and 100, with 100 representing the frontier. The data refer to the 183 economies included in Doing Business 2010 (2009). Six economies were added in subsequent years. The vertical bars show the change in the distance to frontier from 2009 to 2013. The 20 economies improving the most are highlighted in red.
Source: Doing Business database.
year in which data were collected for the getting electricity indicators.
Regulations have become more business- friendly over time, but for a large num-ber of economies there is ample room for more improvement. On average since 2009, the 183 economies included in the analysis have narrowed the gap with the regulatory frontier by 3.1 percentage points (figure 1.7). In 2009 these econo-mies were 41.3 percentage points from the frontier on average, with the closest econ-omy 9.3 percentage points away and the furthest one 72.3 percentage points away. Now these 183 economies are 38.1 per-centage points from the frontier on aver-age, with the closest economy 7.8 per-centage points away and the furthest economy 68.8 percentage points away. Two-thirds of the reforms recorded by Doing Business in the past 5 years fo-cused on reducing the complexity and cost of regulatory processes; the re-maining third sought to strengthen the institutional framework for business regulation. Among the 183 economies, only 7 implemented no changes in any of the areas measured by Doing Busi-ness—Antigua and Barbuda, Bolivia, Er-itrea, Iraq, Kiribati, the Federated States of Micronesia and the United States. Except for the United States, these are
economies that typically rank low on the ease of doing business.
In some economies the absence of reg-ulatory reforms may reflect a turbulent political and institutional environment, which sharply limits the government’s ability to focus on creating a more business- friendly regulatory environ-ment. Civil conflicts, widespread poverty and serious constraints in administra-tive capacity may make it diicult, for example, to strengthen creditors’ rights, create a more eicient judicial system or expand the range of protections af-forded to minority shareholders. In oth-er economies, howevoth-er, the issue is not capacity or resource constraints but the policy choices the authorities have made, often biased against the private sector. In these economies the distance to frontier measure reveals a significant worsening in the quality of the business regulatory environment over the past several years, with small and medium-size enterprises facing a growing number of cumbersome restrictions and distortions.
Improvement across regions and
income groups
Since 2009 all regions of the world and economies at all income levels have im-proved their business regulations on
average. Moreover, improvement is hap-pening where it is most needed. The re-gions where regulatory processes are longer and costlier and regulatory insti-tutions are weaker are also those where the biggest improvements have occurred. Over the past 5 years Sub-Saharan Africa reduced the gap with the regulatory fron-tier by 3 times as much as OECD high- income economies did (figure 1.8). And low-income economies improved their average distance to frontier score at twice the rate that high-income economies did (figure 1.9). Part of the explanation is that high-income economies were much clos-er to the fronticlos-er to start with and thclos-ere- there-fore had less room to improve. But low- income economies have nevertheless made an important efort to improve business regulations since 2009.
Business regulatory reform is particularly relevant in low-income economies. In-formation presented in this year’s report shows the link between better business regulations and economic growth (see the chapter on research on the efects of business regulations). Moreover, recent research shows that economic growth remains the most important factor in de-termining the pace of income growth for poor people.5 Together, this evidence in-dicates that having sensible business reg-ulations contributes to reducing poverty
Sierra Leone Bangladesh
Liberia
Cambodia
Gambia, The
Iraq
Cameroon
Côte d‘Ivoire Madagascar
Lao PDR
Togo Bolivia
São Tomé and Príncipe
Comoros
Equatorial Guinea
Burkina Faso
Burundi
Uzbekistan Tajikistan Suriname Nigeria Benin Senegal
Micronesia, Fed. Sts.
Djibouti
Guinea-Bissau
Syrian Arab Republic
Angola
Timor-Leste
Guinea Niger
Mauritania
Haiti
Afghanistan Zimbabwe Venezuela, RB Congo, Rep.
Congo, Dem. Rep.
Eritrea
Central African Republic
Chad
2013
2009
Serbia
Kyrgyz Republic
Sri Lanka
Russian Federation
Costa Rica Lebanon
Solomon Islands
Azerbaijan
China
Mongolia
Nepal
Vietnam Paraguay
Dominican Republic
Kuwait
Grenada
St. Kitts and Nevis
Philippines
Palau Jordan
Swaziland
Papua New Guinea
El Salvador
Kenya
Cape Verde Nicaragua
Ukraine
Honduras Guyana Pakistan Indonesia
Bosnia and Herzegovina
Ethiopia Ecuador Kiribati Lesotho
Tanzania
Yemen, Rep.
Egypt, Arab Rep. Marshall Islands
Argentina
Bhutan
Mozambique
West Bank and Gaza
Iran, Islamic Rep.
Uganda Brazil Sudan
India
Algeria
Mali
Gabon
Albania Malawi
and boosting shared prosperity, the twin goals of the World Bank Group.
Across regions, starting a business emerges as the area with the largest share of reforms since 2009. Among OECD high-income economies resolving insol-vency and paying taxes are the areas with the highest shares of reformers. A similar
pattern can be seen in Europe and Central Asia, where 73% of economies reformed in resolving insolvency and 85% in paying taxes. These reform choices partly reflect the response to the global financial crisis, which created a pressing need to stream-line insolvency processes and lighten the burden of tax administration on the enter-prise sector.
Beyond starting a business, diferent regions focused their regulatory reform eforts on diferent areas. In Sub-Saharan Africa the second greatest area of fo-cus since 2009 has been trading across borders, while in South Asia economies were more likely to focus on registering property. In East Asia and the Pacific and Latin America and the Caribbean the focus was on paying taxes, and in the Middle East and North Africa on get-ting credit.
Although starting a business has been the most common area of regulatory reform, it is not the area with the big-gest improvements at the regional level since 2009—mainly because the starting point in 2009 was already closer to the regulatory frontier than it was in other areas. OECD high-income economies narrowed the gap with the frontier the most in resolving insolvency, Europe and Central Asia in paying taxes, South Asia in registering property, and the Middle East and North Africa, East Asia and the Pacific and Sub-Saharan Africa in getting credit.
The 20 economies narrowing the
gap the most
Of the 20 economies narrowing the gap with the regulatory frontier the most since 2009, 9 are in Sub-Saharan Africa, 8 are in Europe and Central Asia, 2 are in East Asia and the Pacific, and 1 is an OECD high-income economy (figure 1.7). None are in the Middle East and North Africa or Lat-in America and the Caribbean, the regions that consistently have smaller numbers of reformers. Among the 20 economies are both small and large economies as well as economies at all income levels, though there is a higher incidence of low- and lower-middle-income economies. Togeth-er ovTogeth-er the past 5 years, these 20 econo-mies implemented 253 regulatory reforms making it easier to do business, about 20% of the global total for the period. Two of them—Ukraine and Rwanda—implement-ed at least 1 regulatory reform in every area measured by Doing Business. In line with the global trend, starting a business was the most common area of regulatory reform among the 20 economies, followed by paying taxes.
The 20 economies narrowing the regu-latory gap the most are dynamic in other FIGURE 1.8 All regions are improving in the areas measured by Doing Business
Regulatory frontier
40 50 60
70 Gap between OECD high-income economies and rest of the world
Average distance to frontier
(percentage points)
2009 2010 2011 2012 2013
EAP
LAC
SSA OECD
ECA
MENA
SAS 100
Note: The distance to frontier measure shows how far on average an economy is at a point in time from the best performance achieved by any economy on each Doing Business indicator since 2003 or the first year in which data for the indicator were collected. The measure is normalized to range between 0 and 100, with 100 rep-resenting the frontier. The data refer to the 183 economies included in Doing Business 2010 (2009) and to the regional classifications for 2013. Six economies were added in subsequent years. EAP = East Asia and the Pacific; ECA = Europe and Central Asia; LAC = Latin America and the Caribbean; MENA = Middle East and North Africa; OECD = OECD high income; SAS = South Asia; SSA = Sub-Saharan Africa.
Source: Doing Business database.
FIGURE 1.9 Low-income economies have narrowed the gap with the regulatory frontier the most since 2009
Average improvement in distance to frontier (percentage points), 2009–13 High income
Low income Lower middle income
0 1 2 3 4 5
Upper middle income
Note: The distance to frontier measure shows how far on average an economy is at a point in time from the best performance achieved by any economy on each Doing Business indicator since 2003 or the first year in which data for the indicator were collected. The measure is normalized to range between 0 and 100, with 100 rep-resenting the frontier. The data refer to the 183 economies included in Doing Business 2010 (2009) and to the income group classifications for 2013. Six economies were added in subsequent years.
Source: Doing Business database.
ways as well. Overall, new firm creation in these economies has at least kept pace with the world average in recent years. Total firm density—the number of firms per 1,000 adults—has steadily increased (figure 1.10). In Russia, for example, the number of firms per 1,000 adults grew from 22 in 2006 to 35 in 2012. In a few of the Sub-Saharan African economies the number increased more than 10-fold. In Rwanda the number of firms per 1,000 adults rose from 0.3 to 3.4. While this is still substantially below the world average of 12.4, the increase over time is impressive. Globally, both total firm density and new firm densi-ty (the number of new firms created per 1,000 adults) are significantly cor-related with performance on the Doing Business indicators (figure 1.11).
IN WHAT AREAS HAS THE GAP
BEEN NARROWING THE MOST?
Among the more encouraging trends shown by Doing Business data over the past decade is the gradual convergence in economies’ performance in the areas tracked by the indicators. Economies with the weakest regulatory institutions and the most complex and costly regulatory processes tend to undertake regulato-ry reform less often. But when they do, they focus on the areas where their reg-ulatory performance is worse, slowly but steadily beginning to adopt some of the better practices seen among the best per-formers. Here is an example: In 2005 the time to start a business in the economies
ranking in the worst quartile on this in-dicator averaged 113 days. Among the best 3 quartiles it averaged 29 days. To-day that gap is substantially narrower. While the diference is still substantial
at 33 days, it is considerably smaller than the 85 days in 2005 (figure 1.12). Similar trends can be seen in other indica-tors measuring the complexity and cost FIGURE 1.10 A steady increase in total firm density among economies narrowing the
regulatory gap the most since 2009
Total firm density
(firms per 1,000 adults)
2006 2007 2010 2011 2012
Armenia
Russian Federation Georgia
Belarus
Malaysia
World average
8 10 12 14
0 2 4 6
Kosovo Sierra Leone
Rwanda
Togo
2008 2009
Total firm density
(firms per 1,000 adults)
2006 2007 2010 2011 2012
40 50 60 70
0 10 20 30
2008 2009
Macedonia, FYR
World average
Note: Data refer to limited liability companies. Other economies among the 20 narrowing the regulatory gap the most are excluded from the figure because of missing data.
Source: World Bank Group Entrepreneurship Snapshots, 2013 edition.
FIGURE 1.11 Greater firm density in economies closer to the regulatory frontier
Distance to frontier
(percentage points),
2012
New firm density (newly registered firms per 1,000 adults), 2012 60
80 100
0
Total firm density (firms per 1,000 adults), 2012
Distance to frontier
(percentage points),
2012
40
60 80 100
20 40
0 10 20 30
0 100 200 300 400
Note: The correlation between the distance to frontier and total firm density is 0.44. The correlation between the distance to frontier and new firm density is 0.43. Both correlations are significant at the 1% level. Data refer to limited liability companies.
Source: Doing Business database; World Bank Group Entrepreneurship Snapshots, 2013 edition.
FIGURE 1.12 Strong convergence across economies since 2005
Averages by group
Time to start a business (days)
60 80 120
100
0 40
20
500 600 800
700
0 400
100 200 300
Time to deal with construction permits (days)
Time to export (days)
Cost to start a business (% of income per capita)
Time to pay taxes (hours per year)
Time to register property (days)
Time to import (days)
Cost to register property (% of property value) 250
300 400
350
0 200
150
100
50
250 300 350
200
150
100
50
100 150 250
200
0 50
30 40 60
50
0 20
10
40 50 70
60
0 30
20
10
0
10 12 16
14
0 8
6
4
2
2005 2006 2007 2008 2009 2010 2011 2012 2013 2005 2006 2007 2008 2009 2010 2011 2012 2013
2005 2006 2007 2008 2009 2010 2011 2012 2013 2005 2006 2007 2008 2009 2010 2011 2012 2013
2005 2006 2007 2008 2009 2010 2011 2012 2013 2005 2006 2007 2008 2009 2010 2011 2012 2013
2005 2006 2007 2008 2009 2010 2011 2012 2013 2005 2006 2007 2008 2009 2010 2011 2012 2013
Worst quartile
Best 3 quartiles
Worst quartile
Best 3 quartiles
Worst quartile
Best 3 quartiles Worst quartile
Best 3 quartiles
Worst quartile
Best 3 quartiles Worst quartile
Best 3 quartiles
Worst quartile
Best 3 quartiles
W