CHARACTERIZING TEMPORAL DYNAMIC OF WEATHER
VARIABILITY TO SUPPORT DECISION MAKING
ON WEED CONTROL
RIZKY MULYA SAMPURNO
GRADUATE SCHOOL
BOGOR AGRICULTURAL UNIVERSITY BOGOR
STATEMENT
I, Rizky Mulya Sampurno, hereby declare that this thesis entitled
Characterizing Temporal Dynamic of Weather Variability to Support Decision Making on Weed Control
Is a result of my work under the supervision advisory board and that it has not been published before. The content of the thesis has been examined by the advisory board and external examiner.
RINGKASAN
RIZKY MULYA SAMPURNO. Karakterisasi Dinamika Temporal Variabel Cuaca untuk Mendukung Pengambilan Keputusan pada Pengendalian Gulma. Dibimbing oleh KUDANG BORO SEMINAR dan YULI SUHARNOTO.
Pada pertanian modern, herbisida dominan digunakan untuk pengendalian gulma. Meskipun herbisida memiliki manfaat positif dalam memberantas gulma, herbisida juga berpotensi dapat mencemari lingkungan apabila terjadi spray drift pada saat penyemprotan. Spray drift dapat terjadi karena kondisi cuaca yang tidak sesuai. Pengetahuan tentang kondisi cuaca akan membantu petani dan pengambil keputusan untuk menentukan teknologi dan metode tepat guna dalam memberantas gulma serta meminimalkan spray drift dan pemborosan herbisida lainnya.
Kemajuan teknologi informasi telah diterapkan secara luas di bidang pertanian seperti halnya pertanian presisi. Solahudin (2013) mengembangkan metode pengendalian gulma berbasis multi-agen. Sistem tersebut memiliki dua fungsi yaitu fungsi konsultasi dengan memberikan rekomendasi sebelum melakukan penyemprotan (off-farm) dan pengendalian selama aplikasi penyemprotan (on-farm). Sistem ini telah diterapkan dalam pengendalian gulma tanaman kacang tanah.
Hubungan dengan penelitian ini adalah sistem yang dibangun oleh Solahudin (2013) perlu ditingkatkan kemampuannya dalam hal yang berhubungan dengan data cuaca. Data cuaca dapat digunakan untuk mengoptimalkan jadwal penyemprotan pada kegiatan pengendalian gulma yang ramah lingkungan serta untuk menyiapkan peralatan dan mesin yang akan digunakan sebelum hari penyemprotan. Kondisi cuaca baik spasial maupun temporal merupakan informasi yang penting bagi kegiatan pertanian. Integrasi satelit meteorologi dengan produk prediksi cuaca numeric cukup menjanjikan untuk digunakan sebagai masukan pengambilan keputusan dalam aplikasi penyemprotan terutama untuk daerah yang kurang terjangkau oleh stasiun cuaca.
Tujuan dari penelitian ini adalah untuk mengembangkan sistem pendukung keputusan (DSS) untuk penjadwalan pengendalian gulma dan untuk memilih ukuran nozzle semprot yang dapat meminimalkan dampak negatif terhadap lingkungan. Data utama yang diperlukan untuk sistem yang diusulkan ini meliputi data cuaca 10 tahun yang diperoleh dari satelit penginderaan jauh seperti Oceanic & Atmospheric Administration Nasional (NOAA), Tropical Rainfall Measuring Mission (TRMM) dan data indeks vegetasi dari MODerate Resolution Imaging Spectroradiometer (MODIS). Data indeks vegetasi digunakan untuk menentukan periode tanam padi. Sedangkan data cuaca digunakan untuk menentukan jadwal penyemprotan dan untuk menentukan ukuran nozzle semprot yang tepat berdasarkan kondisi cuaca.
pertumbuhan padi tahunan. Berdasarkan analisis dari EVI, diperkirakan bahwa waktu penyemprotan padi adalah pada bulan April-Mei untuk siklus tanam 1dan Oktober-November untuk siklus tanam 2.
Karakteristik pola cuaca di Jonggol diamati selama sepuluh tahun. Setiap parameter cuaca memiliki karakteristik tersendiri dan umumnya memiliki pola yang sama dar tahun ke tahun. Pada umumnya, selama sepuluh tahun curah hujan yang tinggi terjadi pada akhir tahun sampai dengan awal tahun. Sedangkan curah hujan rendah pada pertengahan tahun. Kecepatan angin berfluktuasi. Angin yang tinggi terjadi pada akhir tahun sampai Januari dengan kecepatan lebih dari 10 km/jam. Selama sepuluh tahun, suhu minimum dan suhu maksimum adalah 23.57°C dan 30.5°C. Kelembaban relatif menurun bersamaan dengan kenaikan suhu udara. Kelembaban berkisar antara 67.5 – 95.5%. Kelembaban tinggi terjadi pada akhir tahun sampai awal tahun, dan kelembaban relatif menurun pada pertengahan tahun. Petani dan pengambil keputusan dapat menggunakan informasi cuaca tahun sebelumnya untuk mengetahui waktu yang optimal untuk penjadwalan aplikasi penyemprotan, untuk mempersiapkan alat dan mesin termasuk sprayer. Waktu yang optimal untuk pengendalian gulma ditentukan dari interval waktu penyemprotan yang diperoleh dari analisis indeks vegetasi dengan mempertimbangkan kondisi cuaca.
Aplikasi untuk menentukan ukuran nozzle semprot telah dikembangkan berdasarkan kriteria-kriteria kondisi cuaca. Pengetahuan untuk menentukan ukuran nozzle diperoleh dari penelitian sebelumnya. Curah hujan dijadikan sebagai parameter utama dalam menentukan keputusan untuk melakukan penyemprotan. Parameter selanjutnya adalah angin, suhu, dan kelembaban. Parameter cuaca dapat diinput secara manual atau dapat menggunakan data cuaca yang tersimpan database.
Sistem penunjang keputusan ini telah dikembangkan dan diuji dengan data riil di lapangan yang diperoleh dari satelit penginderaan jauh. Sistem yang dikembangkan dapat memberikan informasi waktu yang optimal untuk penyemprotan pada tanaman padi serta dapat menentukan ukuran nozzle semprot berdasarkan kondisi cuaca. Tidak hanya untuk tanaman padi, sistem ini dapat diterapkan baik pada tanaman di dataran rendah maupun di dataran tinggi.
SUMMARY
RIZKY MULYA SAMPURNO. Characterizing Temporal Dynamic of Weather Variability to Support Decision Making on Weed Control. Supervised by KUDANG BORO SEMINAR and YULI SUHARNOTO.
Herbicide is the dominant tool used for weed control in modern agriculture. Although herbicide has positive benefit in killing the target weeds, it potential becomes negative impact to the environment if some remains in the air and drift. Spray drift can happen due to unsuitable weather. The knowledge of weather condition will help farmer and decision maker to decide the appropriate technology and method for eradicating weed which minimize drift and other potential waste.
The progress of information technology has been applied widely in agriculture such as precision agriculture. Solahudin (2013) developed a weed control method using multi-agents based. That system has two functions i.e. consultation function by giving recomendation before spraying (off-farm) and controlling during spray application (on-farm) using multi-intelligent agents which applied for groundnut farming.
Relationship with this research is the system built by Solahudin (2013) needs to be improved in knowledge that related with weather. Weather data can be used to optimize spray scheduling on weed control activities that safe to the environment and for setup the equipment and machinery which prepared earlier before application day. The spatial and temporal variability weather conditions are important sources for agricultural activities such as spray application. Integration meteorological satellite with numerical weather prediction (NWP) product is promising in find timely weather variables as input for decision making to resolve problems in spray application especially for area which sparse coverage of weather stations.
The objective of this research is to develop a decision support system (DSS) for schedulling of weed control and for selecting the proper nozzle size of the sprayers that introduce minimum negative impact to the environment. The main set of data required for our proposed system includes the set of 10 years weather data series acquired from remote sensing such as the National Oceanic & Atmospheric Administration (NOAA) and the Tropical Rainfall Measuring Mission (TRMM) and a set of vegetation index from the MODerate Resolution Imaging Spectroradiometer (MODIS). The vegetation index data utilized to determine the planting period of paddy and weather data set utilized to determine spray schedule and to determine the proper size of the sprayers for weed control.
We study weather pattern in Jonggol during ten years. Every parameter have own characteristic and generally in same fluctuated pattern form. Generally, during ten years rainfall is high in year end to early year while low in mid-year. Wind speed is fluctuates. Wind is high in year end to January every year about more than 10 km/s. For ten years, minimum and maximum temperatures are 23.57°C and 30.5°C. Relative humidity decreased when air temperature increase. It is about 67.5 – 95.5%, high in year end to early year, and lowers in middle year. Farmer or decision maker can use information from past weather data to find out optimal time for scheduling, preparing machinery and sprayer. Optimal week for weed control determined from interval time for spraying both in crop cycle 1 and crop cycle 2.
We developed application to determine the proper nozzle size for sprayer based on weather condition. Knowledge to determine nozzle size is acquired from previous research. Rainfall is the first parameter which decides do spray or do not spray, because spray application will not conducted in rainy day and herbicide particles will run off along with rain water. Wind becomes second parameter, following by temperature and humidity. Weather parameters can be inputted manually or can use weather data taken from the past datasets which stored in database.
The DSS for weed applications has been developed and tested with a real data set acquired from remote sensing devices. The developed system can generate optimal spray scheduling and recommend the proper size of nozzles used for spray application on paddy crops based on the weather condition, and thus minimizing spray drift and bad environmental impact. This method could be implemented both for low-land crop and high-land crop.
Copyright © 2014, Bogor Agricultural University
Copyright are protected by law
It is prohibited to cite all of part of this thesis without referring to and mentioning the source. Citation only permitted for the sake of education, research, scientific writing, report writing, critical writing or reviewing scientific problem. Citation does not inflict the name and honor of Bogor Agricultural University
A thesis submitted for the degree Master of Science in Information Technology for Natural Resources Management Study Program
CHARACTERIZING TEMPORAL DYNAMIC OF WEATHER
VARIABILITY TO SUPPORT DECISION MAKING
ON WEED CONTROL
GRADUATE SCHOOL
BOGOR AGRICULTURAL UNIVERSITY BOGOR
2014
Thesis Title : Characterizing Temporal Dynamic of Weather Variability to Support Decision Making on Weed Control
Name : Rizky Mulya Sampurno Student ID : G051110091
Approved by Advisory Board
Prof Dr Ir Kudang Boro Seminar, MSc Supervisor
Dr Ir Yuli Suharnoto, MEng Co-Supervisor
Endorsed by
Program Coordinator of MSc in IT for Natural Resources Management
Dr Ir Hartrisari Hardjomidjojo, DEA
Dean of Graduate School
Dr Ir Dahrul Syah, MScAgr
Date of Examination: January, 29th 2014
ACKNOWLEDGMENTS
Alhamdulillah, first and most, I thank to The Almighty Allah subhanahu wa ta’ala for allowing me alive and get many experiences in this world. Plenty rahmats have been given makes me easier to complete this thesis. The topic selected for this research is utilization of remote sensing technology for agricultural application that conducted from July – November 2013 with the title Characterizing temporal dynamic of weather variability to support decision making on weed control.
I owe a great deal to Prof Dr Kudang Boro Seminar who served as chair of the board of supervisor and teach anything. Dr Yuli Suharnoto as co-supervisor made significant contribution to many aspects in the thesis, particularly in remote sensing. Thank you very much Pak Kudang and Pak Yuli for guidance, patience, comments, correction and constructive inputs through all months of my research.
I would like to thank Dr Mohamad Solahudin for inputs and idea for this research. My appreciation also goes to Dr Liyantono and Dr Bib Paruhum Silalahi as the external examiners for their valuable critics, inputs, and corrections. I would like to thank Dr Ibnu Sofyan, Mr Harry Imantho, Dr Tofael Ahamed, Dr Ryozo Noguchi, Dr Yudi Setiawan for the valuable inputs and comments. I would like to thank to all MIT secretariat that support our administration, technical and facility. I would like to thank Agus Aris and all my colleagues in MIT for helping, supporting, and togetherness. Special thanks go to Nadia Tannia Hendartina for any help and support during my study.
This work is dedicated to my parent, Ibu and Bapak who cheer my life at the beginning and afterward, prayer, financial, encouragement and support. Hopefully, the results of this research would provide a positive and valuable contribution for anyone who reads it.
LIST OF CONTENTS
Weed Control on Paddy Field using Herbicide 4
Spray Drift 5
Paddy Phenological Stages 5
Weed Control in Precision Farming 7
3 METHOD 8
Estimation of Weed Control Time 14
Development Application to Determine Nozzle Sprayer 14
4 RESULT AND DISCUSSION 15
Paddy Planting Time 16
Weed Control and Spray Application Time 17
Weather Pattern 18
Application for Minimizing Spray Drift 21
Herbicide Application in Agricultural crop 22
5 CONCLUSION AND RECOMMENDATION 23
Conclusion 23
Recommendation 23
REFERENCES 23
APPENDICES 27
LIST OF TABLES
1 EVI distribution of paddy 6
2 List of datasets of research 12
3 Decision making to determine nozzle size based on weather parameter 15
LIST OF FIGURES
1 Weed on some main crops; (a) paddy, (b) groundnut, and (c) maize 3 2 Architecture of supervisory control system based on precision farming
(Solahudin 2013) 8
3 Location of study, Jonggol, Bogor district, West Java, Indonesia 9 4 Representation of paddy field area in MODIS Image (One pixel = 500
x 500 m) 9
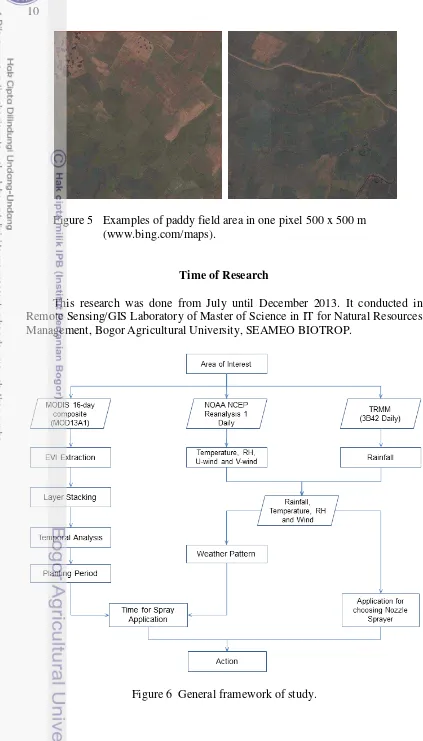
5 Examples of paddy field area in one pixel 500 x 500 m
(www.bing.com/maps) 10
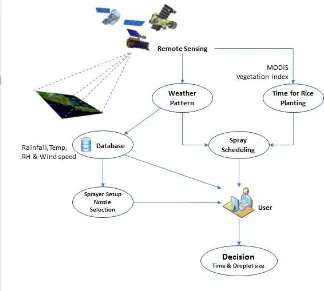
6 General framework of study 11
7 Utilization of remote sensing data for weed control 16 8 Weed control time which estimated from planting time through
enhanced vegetation index (EVI) 17
9 Weather patterns of study area and it utilization to characterize
weather condition during spray duration 18
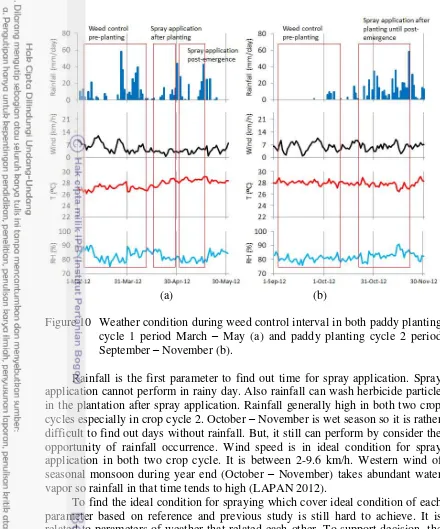
10 Weather condition during spray application interval in both paddy planting cycle 1 period March – May (a) and paddy planting cycle 2
period September – November (b) 20
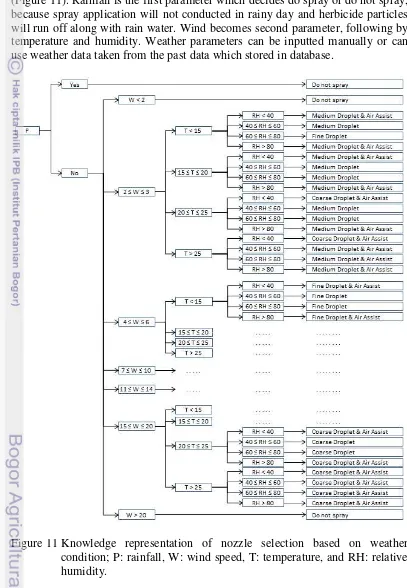
11 Knowledge representation of nozzle selection based on weather
condition; P: rainfall, W: wind speed, T: temperature, and RH: relative
humidity 21
12 Sprayer nozzle selection based on normal weather condition, (a) application in normal condition and (b) application in extreme
condition 22
LIST OF APPENDICES
1 Coordinate of several paddy fields in Jonggol 27 2 Enhanced vegetation index (EVI) value of several paddy fields in Jonggol 28
3 Examples of processing netCDF data 29
LIST OF ABBREVIATION
BPS Badan Pusat Statistik cdo Climate Data Operator DAP Days After Planting DSS Decision Support System EVI Enhanced Vegetation Index ESRL Earth System Research Laboratory
GeoTIFF Geostationary Earth Orbit Tagged Image File Format GIS Geographic Information System
GPI Global precipitation index I/O Input/Output
LAPAN Lembaga Penerbangan dan Antariksa Nasional LP DAAC Land Processes Distributed Active Archive Center LSWI Land Surface Water Index
MODIS MODerate Resolution Imaging Spectroradiometer NCEP National Centers for Environmental Prediction NDVI Normalized Difference Vegetation Index NDWI Normalized Difference Water Index netCDF Network Common Data Form
NOAA National Oceanic & Atmospheric Administration NWP Numerical Weather Prediction
PR Precipitation Radar
PSD Physical Sciences Division
RH Relative Humidity
SDLC System Development Life Cycle
TMI TRMM Microwave Image
TRMM Tropical Rainfall Measuring Mission USGS United State Geological Survey VIRS Visible and Infrared Scanner
1
1
INTRODUCTION
Background
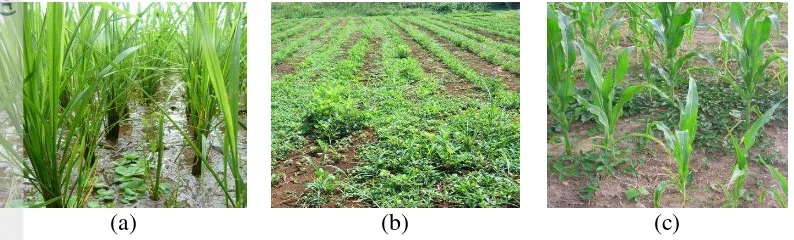
Weeds are a serious problem for agricultural crop. They rob main crops of sunlight, water and nutrient causing production losses both in quantity and quality (Solahudin 2013). Losses due to weed are: wheat (9.8%), rice (10.8%), maize (13%), sorghum (17.8%), potatoes (4%) and groundnut (11.8%) (Evans 1996). Even, an uncontrolled weed can decrease yield until 20-80% (Utami 2004). In modern way, agriculture activity is depends on utilization of chemical substance to increase production. Herbicides are the dominant tool used for weed control in modern agriculture (Harker et al. 2013).
Although herbicide has positive benefit in killing the target weeds, it potentially becomes negative impact if some remains in the air and drift. Spray drift from herbicide can cause crop protection chemicals to be deposited in undesirable areas (Nuyttens et al. 2011). It has serious consequences such as damage to sensitive adjoining crops (Reddy et al. 2010), damage to susceptible off-target areas (Marrs and Frost 1997), environmental contamination, illegal herbicide residues, lowers yield results (Kjaer et al. 2006) and health risks to animals (Otto et al. 2009) and people (Butler et al. 2010).
Spray drift continues to be a major problem in applying herbicides. Factors that cause drift are weather conditions and sprayer setup (Wolf 2006). Drift can happen due to unsuitable weather. It potentially occurred every time when sprayer turned on. The knowledge of weather condition will help farmer and decision maker to decide the appropriate technology and method for eradicating weed, plan, and effectively execute spray applications to avoid spray drift and other potential waste.
The progress of information technology has been applied widely in agriculture such as precision agriculture (Auernhammer 2001). Solahudin (2013) has developed a weed control method in precision agriculture using multi-agents based. The method is a supervisory system to determine technology and liquid applicator capacity and controlling agents. That system has two functions i.e. as consultation function by giving recomdation before spraying (off-farm) and controlling during spraying using multi-intelligent agents (on-farm) which applied for groundnut farming. Decision making method influence by factors on weeding activity such as time schedule, total area, working time, type of crop, type of weed, weed density, herbicide, weather, and sprayer technology. While agents are for: image acquisition, filtering, crop detection, determination weed density, and determination herbicide dosage.
The weather conditions both spatially and temporally have not studied more in previous research. Relationship with this research is the system built by Solahudin (2013) needs to be improved in knowledge that related with weather. Weather data can be used to optimize spray scheduling in weed control activities to avoid drift and environmental friendly. Also it can be used in preparing the equipment and machinery that determine earlier before application day.
2
meteorological satellite with the Numerical Weather Prediction (NWP) product is promising in find timely weather variables as input for decision making to resolve problems in spray application especially for area which sparse coverage of weather stations (Bahar 2012; Roebeling et al. 2004; De Wit et al. 2010). However, the availability of data in real-time is still difficult to achieve. The Tropical Rainfall Measuring Mission (TRMM) data is capable of providing daily rainfall. NWP products from NCEP/NOAA such as 2 m temperature, wind, and RH (Relative Humidity) are used as other input. Moreover data from experience could be used for scheduling and as decision support for preparing tools and machinery before spray application conducted.
Problem Formulation
In addition to the effectiveness and efficiency issues, drift of chemical substance on herbicide application can cause damage to other agricultural product and pollute the environment. Utilization of weather data to resolve these problems is needed. However, the availability of data in real-time is still difficult to achieve. Therefore, utilization of remote sensing data is expected can help to resolve those problems.
Objective
The objective of this research is to develop a decision support system (DSS) for schedulling of weed spraying and for selecting the proper nozzle size of the sprayers that introduce minimum negative impact to the environment.
Research Benefits
The benefits of this research are:
- Introduce a method that utilizes weather data for agriculture application. - Provide information about characteristics of weather conditions on study area. - Provide recommendation the proper nozzle size of sprayer based on weather
condition.
Scope of Research
3 remote sensing especially for big scale farming area. Paddy becomes main agricultural product that planted in many region of Indonesia. This developed DSS can be applied not only for paddy but also for other crop which used spray application.
2
LITERATURE REVIEW
Weed
Weeds are unwanted plants growing along with agricultural crops (Dangwal et al. 2011). Weeds compete with crops mainly for space, sunlight, moisture, nutrient, and reduce the quantity as well as quality of production (Solahudin 2013). Holm et al. (1979) estimated 250 weed species which are harmful for agricultural crops throughout the world. The competition of weeds for nutrients may results in such obvious responses as dwarfing in plant size, nutrient starved conditions, wilting and actual dying out of plants (Anderson et al. 1996). Weed seeds germinate earlier to agricultural crops, their seedlings grows faster and aggressive so that they crowd out all other plants which possesses more valuable properties and establish a kingdom of their own within a short period of time. Weed species mature ahead of crops so that their seeds are collected with the crop harvest and get distributed to other places. Some weed species caused damage to crops by harboring pests and disease agents.
(a) (b) (c)
Figure 1 Weed on some main crops; (a) paddy, (b) groundnut, and (c) maize. Weeds act as host for bacteria, viruses and nematodes that causes diseases in crop plants (Peters et al. 1955). Weeds show allelopathic effects on agricultural crops by secreting allelochemicals that inhibit their growth and germination (Oudhia P and Tripathi RS 1998). The weedy crop may sometime leads to complete failure. Weeds cause yield losses as reported by Evan (1996) were wheat (9.8%), rice (10.8%), maize (13%), sorghum (17.8%), potatoes (4%), sugar (15.7%), soybean (13.5%), cacao (11.9%) and groundnut (11.8%). An uncontrolled weed can decrease yield until 20-80% (Utami 2004). The cost of removing weeds adds to the cost of production of crops, thus producers losses part of their investment and the country suffers a reduction in agricultural products.
4
In irrigated area, competition between weed and paddy can decrease rice yield 10-40%, depend on species and density of weed, soil type, water and weather (Nantasomsaran and Moody 1993). Nyarko and De Datta (1991) reported that yield loss of paddy by weed can be 10-15%, while Pane et al. (2002) in Karawang, yield loss about 8-12%. It shows that weed control which perform by farmer is not effective especially for manual weeding. World Bank (1996) reported in 1995, weed decrease yield in Asia about 50 million tones. Competition weed and paddy crop decreased yield 10 million tones every year in China (Labrada 2003).
Weed Control on Paddy Field using Herbicide
There are many methods of weed control. It can be categorized into two groups, i.e. indirect method and direct method (Pane and Jatmiko 2009). Indirect methods are: (1) using good seed and variety, (2) soil tillage, (3) irrigation and fertilizer control, (4) controlling planting space, (5) crop rotation, and (6) biological method. Direct methods are: (1) hand pulling, (2) mechanic method, and (3) herbicide.
In high density population country, the salary of worker is relatively inexpensive. Weed control perform manually by hand pulling and flooding (Pane and Jatmiko 2009). Recently, hand pulling is not effective but the worker is limited. Then, weed control is performed using mechanical method. The next generation is development of chemical method known as herbicide. It is claimed more efficient, cheap, quick, and minimal worker.
Nowadays, there are many farmers that use herbicide to control weed (Pane and Jatmiko 2009). In irrigation paddy field such as in outer Java Island, weeding worker is rare and expensive. In West Java especially irrigated area of Jatiluhur, because the planting time is same, all farmers need worker while the worker is limited. Also in paddy field area near the city, the worker is also limited because younger worker tend to work in office, factory, property etc.
De Datta and Herdt (1983) reported that in agricultural area where the salary of worker is expensive and well irrigation management area such as Japan, Korea, and Taiwan, about 75-100% of farmer have used herbicide. According to (Chisaka 1995), combination of herbicide with indirect methods like soil tillage and fertilization prove more effective than hand pulling. Direktorat Jendral Pertanian Tanaman Pangan (1982) reported that farmers in Deli Serdang (North Sumatera), Musi Banyuasin (South Sumatera), Sidrap (South Celebes), and Karawang and Indramayu (West Java) used herbicide 21%, 37.5%, 100%, and 17.5%, respectively.
5 pesticide/herbicide manufacturers. Although drift may occur as vaporized active chemical substances from the application site, it is usually the physical movement of very small drops from the target area at the time of application (Hofman and Elton 2001).
Spray drift and from agricultural pesticides/herbicides can cause crop protection chemicals to be deposited in undesirable areas (Nuyttens et al. 2011). This can have serious consequences such as damage to sensitive adjoining crops (Reddy et al. 2010), damage to susceptible off-target areas (Marrs and Frost 1997), environmental contamination, illegal pesticide/herbicide residues, lower yield results (Kjaer et al. 2006) and health risks to animals (Otto et al. 2009) and people (Butler et al. 2010).
There are several factors that play a significant part in the creation and reduction of drift (Anonymous 2010; Hofman and Elton 2001). They can be grouped into one of the following categories: (a) spray characteristics, such as volatility and viscosity of the pesticide formulation, (b) equipment and application techniques such as nozzle sprayer and distance between target weed with nozzle sprayer, (c) weather conditions at the time of application (wind speed and direction, temperature, relative humidity and stability of air at the application site), (d) operator care, attitude and skill.
Paddy Phenological Stages
The phenology of paddy is divided into several stages (Semedi, 2012). The first stage is flooded. It performs before the paddy seed being planted. Once the seed planted or at germination stage, it will take 25-30 days to reach tillering and the paddy leaf starting to grow. The leaf color then turning from yellow into green in tillering stages. The growth will reach maximum at the panicle where for early variety of paddy it will take 55-60 days from germination stage and for late variety it will take 65-75 days. It is called heading time. The next stage is the flowering, paddy started to grow flowers and the leaf color started to turn into yellow. For the early variety of paddy, this stage reaches in 85-100 days after germination and for the late variety of paddy it needs 100-115 days. The last stage is harvesting, where paddy is already developed and ready to be harvested. The early variety of paddy needs 130-145 days after germination to be harvested, while for the late variety needs 140-165 days. The paddy phenological stages can be studied using vegetation index.
6
and NDWI. Sakamoto et al. (2005) and Uchida (2007) used time-series EVI data to determine the planting date, heading date, harvesting date, and growing period of paddy. Sari et al. (2010) study paddy phenology in paddy fields with complex cropping pattern.
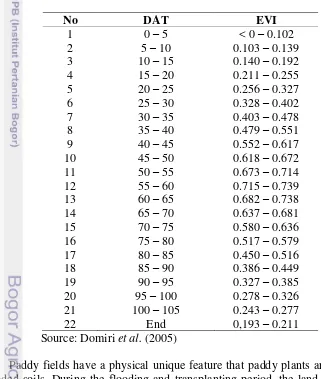
Sari et al. (2010) utilized MODIS EVI to detect growing stages of paddy crop cycle. Sari et al. (2010) characterized the phenological stages of paddy into three main periods: (1) the flooding and transplanting period; (2) the growing period (vegetative growth, reproductive and ripening stages); and (3) the fallow period after harvest. Acording to Domiri et al. (2005), during flooding and paddy transplanting period, about 0-20 days after transplanting (DAT), EVI values < 0.2. About 60 DAT, paddy canopies cover most of the surface area with EVI values ranges around 0.6 to 0.7. At the end of the growth period prior to harvesting (the ripening stage), there is a decrease of EVI values (80 – 105 DAT) around 0.3. In the fallow period after harvest EVI values is about 0.17 – 0.2.
Table 1 EVI distribution of paddy
7 color that produced by paddy leaves were at the panicle and called by heading stage. This stage will be detected by the EVI value as the highest value or in the other word the crop has the greenest color. The EVI value will decrease when the paddy started to flowering and then harvested.
Weed Control in Precision Farming
Environmental condition determines the type of equipment and methods of weed control. It is include a daily weather air temperature, air humidity, wind speed, and precipitation. It became more complex with other factors such as the type and age of the main crops, the type and density of weeds in the fields, availability of herbicides, and the time available for weed control activities. Seminar et al. (2006) stated that the complexity of these problems can be overcome if there is a system that able to give a decision which type of equipment and methods to be used, and it is able to control field activities involving multiple agents work cooperatively and collaboratively.
Multi-agent system is a method of handling an issue that supported by proactive agents which able to read changes in environmental conditions and provide appropriate treatment changes rapidly. While the supervisory control system serves as a hub that has the ability to choose the type of equipment, organize, coordinate and integrate the existing units in the system (Solahudin 2013). Astika et al. (2011) designed a real-time data acquisition system using digital camera and image processing for mapping the closure rate and diversity of weeds on the field. Then, the map was used as guidance in spraying weed using variable rate application. Rotinsulu (2011) developed a tool that can detect and determine weed density of an image and developed a sprayer pump controller system. Those previous researches have focused on how to distinguish weeds with plants, then mapping the density of weeds. The map is used as a guidance of spraying activities in order to realize precision agriculture in terms of provision of herbicides at the proper location. It is more effective and efficient than the conventional way.
Relationship with this research is improvement in achieving precision activities. Research that conducted Astika et al. (2011) is a sub-system of weed control management system that focuses on the factors and weed plants. By combined with this research which focuses on weather condition, weed control activities become right place, right method and right time. Solahudin (2013) developed a supervisory control system that functioned as a central which ability to decide the type of tool, managing, coordinating, and integrating every element of system. This system consist of agents that directly work together read the change of environmental condition and give a treatment based on the change itself.
8
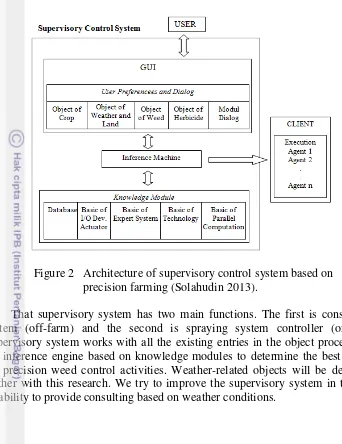
Figure 2 Architecture of supervisory control system based on precision farming (Solahudin 2013).
That supervisory system has two main functions. The first is consultation system (off-farm) and the second is spraying system controller (on-farm). Supervisory system works with all the existing entries in the object processed by the inference engine based on knowledge modules to determine the best method for precision weed control activities. Weather-related objects will be developed further with this research. We try to improve the supervisory system in terms of its ability to provide consulting based on weather conditions.
3
METHOD
Study Location
9
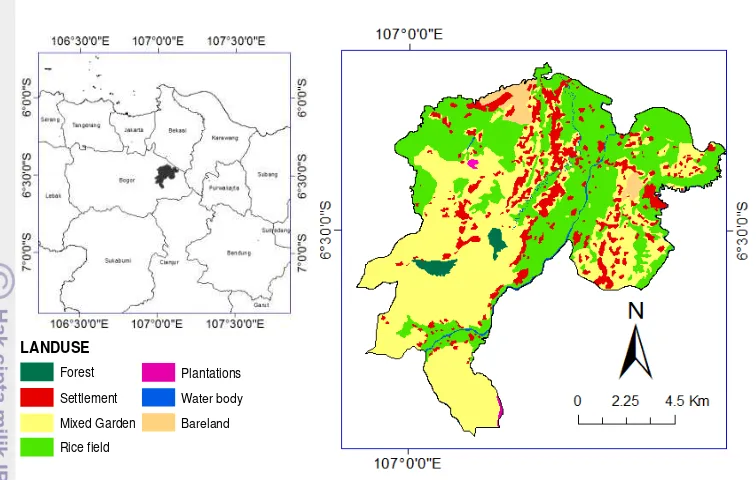
Figure 3 Location of study, Jonggol, Bogor district, West Java, Indonesia. We determined several paddy fields for samples which have area ≥ 500 m2. It was related with the highest spatial resolution of each satellite data. These fields were presented by several pixels of MODIS image while all pixels considered as one grid coverage of NOAA and TRMM data. These pixels represented paddy field in Jonggol. To convince pixels as paddy field, all pixels of image were stacked with landuse map (Figure 4), and used Bing maps for visual interpretation (Figure 5).
Figure 4 Representation of paddy field area in MODIS Image (One pixel = 500 x 500 m).
LANDUSE
Forest Settlement Mixed Garden
Plantations
Rice field
10
Figure 5 Examples of paddy field area in one pixel 500 x 500 m (www.bing.com/maps).
Time of Research
This research was done from July until December 2013. It conducted in Remote Sensing/GIS Laboratory of Master of Science in IT for Natural Resources Management, Bogor Agricultural University, SEAMEO BIOTROP.
11 Data
Several datasets were used in this research show in Table 2. The main type of satellite dataset and source described as follow:
MODIS EVI
The Moderate Resolution Imaging Spectroradiometer (MODIS) product used in this study is the Vegetation Indices (VI) Composite 16-day Global 500 m SIN Grid V005 or MOD13A1 product, which provided the needed vegetation phenology data. In addition, the product had already been systematically corrected for the effects of gaseous and aerosol scattering. The MODIS EVI is embedded in the MOD13A1 product. The MODIS Land Discipline Group (MODLAND 2010) developed the EVI for use with MODIS data following this equation:
EV = order to optimize the vegetation signal with improved sensitivity in high biomass
regions. The EV also minimizes atmospheric influences with the „aerosol resistance‟ term which uses the blue band to correct aerosols influence in band red
(Huete et al. 1997).
In this study we used the MODIS EVI data sets which were acquired from January 2010 to December 2012 and captured 69 time series with the interval time 16 days. The study area is covered by only one MODIS tile: h28v09. MODIS EVI data were extracted from the MODIS VI product (MOD13A1) using the MODIS Reprojection Tool (USGS LP DAAC 2009b) and the selected output format was GeoTIFF and coordinate system was geographic coordinate systems on datum World Geodetic System of 1984.
NOAA NCEP Reanalysis 1
12
respectively. For this study we used four kinds of NCEP Reanalysis 1 of data sets which were acquired from January 2003 to December 2012 and collected 3650 time series for each parameter with daily interval time.
TRMM 3B42
The rainfall product from Tropical Rainfall Measuring Mission (TRMM) satellite is combination of the Precipitation Radar (PR), TRMM Microwave Image (TMI), and Visible and Infrared Scanner (VIRS) (Huffman et al. 2007). TRMM 3B42 daily data is the data level 3 the results of data processing 1B01, 2A12, 3B31, 3A44 and Global precipitation index (GPI). The final 3B42 precipitation (in mm/h) estimates have a 3-hourly temporal resolution and a 0.25ᵒ x 0.25ᵒ spatial resolution. Spatial coverage extends from 50 degrees south to 50 degrees north latitude. The daily accumulated (beginning at 00Z and ending at 21Z; unit: mm) rainfall product is derived from this 3-hourly product. The data are stored in flat binary. In this study we used this product which were acquired from January 2003 to December 2012 and collected 3650 time series with daily interval time.
Table 2 List of datasets of research
No Dataset Source
1. Topographical map scale 1:250000 eospatial nformation Agency
2. Satellite Image 50 x 50 m www.bing.com/maps
3. MOD S EV , 500 x 500 m
Data from 2010 – 2012 Terra MOD S 4. Daily weather data, 2.5 x 2.5 deg
Data from 2003 – 2012 personal computer, printer, Remote Sensing and GIS software (ArcGIS 9.3, ENVI 4.7, MODIS Tool), Grads v2.0, climate data operator (cdo), Bing Maps and Visual Basic 6 programming language.
Data Processing
13 necessary rectified manually. The rectification was done use the corrected beach vector (Rusdiyatmoko and Zubaidah 2005).
Weather data obtained in netCDF format and geometrically corrected. The cdo used to manipulate netCDF data format. For example, it used to compute wind speed and direction which derived from northern and southern wind. The next step was layer stacking. Both MODIS and weather data were sequentially stacked to produce the time-series data set and then clipped to cover study area composite period. The stacked data were evaluated to get temporal pattern from the time series data (Sakamoto et al. 2005).
Data Analysis
Several points of study area were taken that represented location of paddy fields. The EVI of these points were analyzed time-series every 16 day during three years. Weather condition of a pixel weather data where points located was considered as weather condition of all point of study area because it has coarse spatial resolution. Weather condition was analyzed time-series daily during 10 years observation. The years observation of EVI data was less than weather data because the limitation of data storage and for weather study we need long time-series data.
Identification of Paddy Phenology
We used EVI in our study to detect the phenological stages of paddy. In order to determine weed control time using spray application, we identified planting date, heading date, and harvesting date of paddy trough EVI.
Heading time
Heading date used to identify the phenological stages of paddy. According to time-series data of the spectral reflectance of paddy fields (Domiri et al. 2005), the maximum EVI appears around the heading date, 60 DAT (Sari et al. 2010; Semedi 2012). The paddy changes its growth stage from vegetative growth to reproductive growth on reaching the heading date, and leaves begin to wither and die. Therefore, we defined the date of the maximum EVI in the time profile as the estimated heading date and EVI > 0.5 as the threshold.
Planting time
In general, paddy fields are plowed and flooded before planting. The EVI of paddy fields decreases during this period and then increases again after planting. Harvesting time
14
decreases abruptly because of harvesting (Sakamoto et al. 2005). EVI value at the harvesting stage is around 0.24 – 0.28 (Domiri et al. 2005).
Estimation of Weed Control Time
Normally, weed control in precision agriculture is performed twice, i.e. pre-planting and post-emergence (Solahudin 2013). That time estimated after the planting time known. As mentioned in previous section, paddy phenology from planting to harvesting represented trough EVI, and the planting time used as reference to estimate time for weed control. Daily weather condition during pre-planting to post-emergence interval was analyzed. Pre-pre-planting estimated a month before planting month and post-emergence estimated a month after planting month. Then the interval from pre-harvest to post-emergence considered as weed control time.
Weed control in paddy cultivation can be performs in various ways. In Indonesia, generally farmer conducts soil tillage by plowing paddy field before planting. It purposed to make soil suitable for planting paddy by mixing the remaining paddy biomass with soil. The paddy field became fertile. It also can kill the weed. Soil tillage is the first step on weed control in paddy cultivation. Spray herbicide performed after planting. Time after planting until post-emergence and it consider as time for spraying herbicide. It is considered the critical period of weed competition about 40 days after planting.
Development Application to Determine Nozzle Sprayer
This application was developed with objective to determine the proper size of nozzle sprayer. It expected could minimize drift on weed control. This simple application could be combined with agents of weed control system (Solahudin 2013) to improve precision of spray application. The rules (IF – THEN) to decide which nozzle sprayer were acquired from previous researches (Jason 2009; Solahudin 2013; Tepper 2012) which interpreted into decision tree.
The application was designed and developed using system development life
cycle (SDLC) (O‟Brien 1999). System Development Life Cycle (SDLC) is the traditional methodology used to develop, maintain, and replace information system (Hoffer et al. 2007). The phases of the SDLC are: investigation, analysis, design, implementation and maintenance.
Some rules of decision making based on weather conditions were (Solahudin 2013):
15 2) Rules for Air Temperature parameters (˚C)
- If T < 15, then spraying with fine droplet
- f 15 ≤ T < 20, then spraying with medium droplet - f 20 ≤ T < 25, then spraying with coarse droplet
- If T > 25, then spraying with coarse droplets and air assist 3) Rules for parameter Relative Humidity (%)
- If RH < 40, then spraying with coarse droplets and air assist - f 40 ≤ RH < 60, then spraying with medium droplet
- f 60 ≤ RH < 80, then spraying with fine droplet
- If RH > 80, then spraying with medium droplet and air assist
Every parameter was combined to get proper nozzle size of sprayer. Combination used simple operation (AND) and majority as shows in the table 2. For example, condition 1 decided Fine nozzle because the proposed nozzle size based on wind and temperature are Fine, condition 2 decided Medium nozzle size because the middle choice is Medium, and condition 3 decided Medium because all parameters propose Medium nozzle size.
Table 3 Decision making to determine nozzle size based on weather parameter
Condition Nozzle size based on Decision
Wind Temperature RH
1 Fine Fine Medium Fine
2 Fine Medium Coarse Medium
3 Medium Medium Medium Medium
4 Medium Medium Coarse Medium
5 Coarse Medium Coarse Coarse
There were several exceptions for wind velocity i.e. if WV < 2 km/h then do not spray, and if WV > 20 km/h then do not spray. Rainfall was considered before evaluate others parameter. Rainfall became parameter which evaluated first because there is no spray application in rainfall condition. Air assist technology became additional decision, if a parameter proposed air assist so the last decision must be use air assist technology. Air assist technology made sprayed particle reach to main target.
4
RESULT AND DISCUSSION
16
weather condition and to prepare the spraying machinery and equipment for weed control that minimize the negative impact of herbicides to the environment.
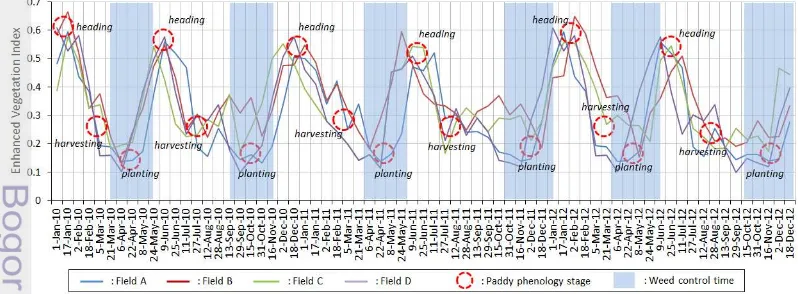
Figure 7 Utilization of remote sensing data for weed control.
Paddy Planting Time
In precision farming, weed control is done two times i.e. pre-planting and post-emergence. To know these times, planting time was identified first. Planting time of paddy identified through multi-temporal analysis of vegetation index. EVI pattern fluctuates during three years data observation starting from January 2010 until December 2012 (Figure 8). EVI clearly shows the annual vegetation growth cycle, representing intensive cropping with multiple harvests.
17 In paddy cultivation, general paddy fields are plowed and flooded before planting. It is flooded after planting until 20 DAP. The EVI value must be close to 0 or negative. However, we did not found the EVI value close to 0 in study area of Jonggol. Therefore, we determined the planting time by the lowest value of EVI. Mostly EVI values in planting time were higher than 0.1. A pixel of MODIS MOD13A1 (500 x 500 m) consist of many parcels of paddy field, roads, trees and other plantation (Figure 5). The EVI value of a pixel MODIS might be combination of EVI from some vegetation which dominant paddy or combination of different planting date of paddy.
The cropping cycle of paddy in Jonggol started about from April to July for cycle 1 and October to February for cycle 2 (see Figure 8). The time for planting considered as time where cropping cycle started. The planting times are April and October. These times are not general time for planting, but that time for planting of some points in study area of Jonggol. In real condition the planting time maybe earlier or later than these points. Because that reason, we consider during a month of April and October as planting period. In reality, farmer can plant their paddy earlier or later.
Weed Control and Spray Application Time
As mentioned in previous section, planting time is used as reference to estimate the time interval of pre-planting to post-emergence. Planting time is whole of April and October, for crop cycle 1 and crop cycle 2, respectively. We estimated one month before planting time as pre-planting and one month after planting time as emergence. The interval from pre-planting until post-emergence is the time for weed control. So, weed control duration for crop cycle 1 is March to May and for crop cycle 2 is September to November (Figure 8).
Figure 8 Weed control time which estimated from planting time through enhanced vegetation index (EVI).
18
respectively. Soil tillage before planting paddy becomes first weed control activity, except for other crop that applied zero tillage. Spray application may be important for zero tillage farming. We can apply spray application pre-planting until post-emergence.
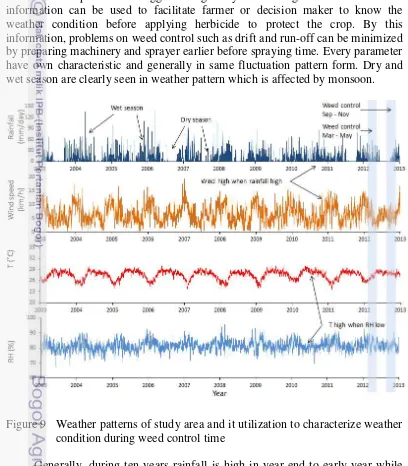
Weather Pattern
Weather pattern of Jonggol during ten years has regular fluctuation. This information can be used to facilitate farmer or decision maker to know the weather condition before applying herbicide to protect the crop. By this information, problems on weed control such as drift and run-off can be minimized by preparing machinery and sprayer earlier before spraying time. Every parameter have own characteristic and generally in same fluctuation pattern form. Dry and wet season are clearly seen in weather pattern which is affected by monsoon.
Figure 9 Weather patterns of study area and it utilization to characterize weather condition during weed control time
19 During ten years, wind speed reach more than 10 km/h. It was high in year end to early year annually. Wind speed influence distance of droplet before reach to target weed. According to Jason (2009), that spraying can only perform if wind speed between 2-15 km/h. Wind speed of 0-2 km/h can cause a shift of steam which fine droplets remain suspended in the air, it is vulnerable to evaporate and drift after spray application completed. Visually wind speed condition of 0-2 km/h can be known by see the combustion smoke, where smoke move vertically. According to Solahudin (2013), risk of drift in wind speed more than 9.6 km/h. The ideal condition of wind speed is 3.2-9.6 km/h. Wind speed generally in ideal condition except in wet season (see Figure 9). Where the wind speed condition is 15-20 km/h, it is need additional tool like air assist which can flow air to the spraying target. Utilization of air assist can change spraying direction that caused by environment wind speed.
Spray application well done in low temperature and high humidity condition (Solahudin 2013). Jason (2009) states, do not spray when the relative humidity less than 40% and temperatures above 25°C in order to reduce drift caused by temperature inversions or evaporation, also increases the target deposition and coverage. In study area the temperature can be higher and lower than 25°C but humidity more than 65%. During ten years, minimum and maximum temperatures were 23.57°C and 30.05°C. Relative humidity decreased when air temperature increase. It was about 67.5 – 95.5%, high in year end to early year, and lowers in middle year.
High temperature can increase drift occurs because herbicide particle is easy to evaporate. Commonly temperature in the morning and in the evening is lower than in the day. So, to optimize spraying, it recommended spraying herbicide in the morning or in the evening. In Handoko (2006), temperature less than 25°C in Bogor is before 7 a.m. and after 7 p.m.
Farmer or decision maker can use this past weather data to find out the optimal time for make spray schedule, preparing machinery and sprayer. Optimal week for spraying determine from interval time for spraying both in crop cycle 1 and crop cycle 2. Ideal condition for spraying is 3.2 – 9.6 km/h of wind. Wind more than 9.6 km/h can cause drift. Sometime sprayer need air assist technology by adding pressure to help herbicide drop to target weed.
The optimum week for weed control determined by using criteria that can minimize spray drift which will impact to the environment. It is by considering the ideal condition of wind, rainfall, temperature and humidity. For example in Figure 10, weed control can be conducted in pre-planting or after planting and post-emergence. Spray application performed after planting until post-emergence (April – May). That time included to critical period of weed competition. It is about 40 DAP.
20
(a) (b)
Figure 10 Weather condition during weed control interval in both paddy planting cycle 1 period March – May (a) and paddy planting cycle 2 period September – November (b).
Rainfall is the first parameter to find out time for spray application. Spray application cannot perform in rainy day. Also rainfall can wash herbicide particle in the plantation after spray application. Rainfall generally high in both two crop cycles especially in crop cycle 2. October – November is wet season so it is rather difficult to find out days without rainfall. But, it still can perform by consider the opportunity of rainfall occurrence. Wind speed is in ideal condition for spray application in both two crop cycle. It is between 2-9.6 km/h. Western wind of seasonal monsoon during year end (October – November) takes abundant water vapor so rainfall in that time tends to high (LAPAN 2012).
21 Application for Minimizing Spray Drift
The prototype interface of application to select the nozzle sprayer based on weather conditions while the knowledge is represented trough decision tree (Figure 11). Rainfall is the first parameter which decides do spray or do not spray, because spray application will not conducted in rainy day and herbicide particles will run off along with rain water. Wind becomes second parameter, following by temperature and humidity. Weather parameters can be inputted manually or can use weather data taken from the past data which stored in database.
22
For example, this application applied using weather data of Jonggol. Weed control performed on normal weather condition, this application will recommend the use of medium sized nozzle (Figure 12a). While the condition in which the high wind speeds (15-20 km/h) the system will recommend the use fine nozzle size. Air assist technology use to avoid drift due to wind speed and turbulence of wind direction. When applied an extreme weather conditions, for example wind speed > 20 km/h, rainy, wind direction that is rapidly changing, the air humidity is very low and very high temperatures, the system recommend do not spray (Figure 12b).
(a) (b)
Figure 12 Sprayer nozzle selection based on normal weather condition, (a) application in normal condition and (b) application in extreme condition.
High wind speed and wind direction change will make a big drift. It occur spray turbulence which resulted particles of spraying drop to non-target weed effectively. Temperature and humidity closely related to particle evaporation (Solahudin 2013). The very low of humidity and very high temperature will make spraying particles evaporate faster in the air before reaching the crop, and the particles that have reached the plant cannot work effectively because it will evaporate faster.
Herbicide Application in Agricultural Crop
Although the type of crop studied is paddy, this decision support system can be applied in other kinds of crop. For example spray application for maize and groundnut such as Solahudin (2013). The developed system can be applied for lowland and highland crop that use spray application to eradicate weed. Especially for farming that applied zero tillage. Spray application of herbicide is the effective way to eradicate weed on big size of farming area. The limitation of worker and high salary encourage the farmer use herbicide. In paddy field, herbicide spraying performed after planting, post-emergence, and other time that need to be sprayed. Herbicide application for paddy takes an important role to decrease the growth and distribution of weed and to kill the weed.
23
5
CONCLUSION AND RECOMENDATION
Conclusion
The DSS for weed applications has been developed and tested with a real data set acquired from remote sensing devices. The proposed system can generate optimal spray scheduling and recommend the proper size of nozzles used for spray application on paddy crops based on the weather condition, and thus minimizing spray drift and bad environmental impact.
Recommendation
In our current implemented prototype data acquisition from remote sensing devices such as NOAA, TRMM and MODIS is carried out using separate application interfaces. The future enhancement is to build one application interface to acquire data set from these sensing devices, allowing the easy and faster acquisition of required data sets from more diverse sources of remote sensing devices in an integrated manner. Moreover, due to the variability and fuzziness of weather characteristics and planting time periods in different geographical areas, the use of fuzzy inference system for improving the time scheduling of weed spraying is highly recommended for the future system development.
REFERENCES
Anderson C, Stryhn H, Streibig JC. 1996. Decline of the flora in Danish arable fields. J Appl Ecolo. 33(3):619- 626.
Anonymous. 2010. Keeping herbicide drift where it belongs. ProQuest Agri J. p174:23.
Astika IW, Dodik A, M Faiz S, M Solahudin. 2011. Pemetaan Keragaman Tingkat Penutupan Gulma sebagai Patokan Aplikasi Herbisida secara Laju Variabel. Seminar Nasional PERTETA. p113-121.
Auernhammer H. 2001. Precision Farming-The Environmental Challenge. Comp Elect Agri. 30:31-43.
Bahar Y. 2012. Rice Crop Monitoring System Based on Modeling Approach. Master Thesis. Bogor: Graduate School IPB.
[BPS] Statistics of Indonesia. 2008. Bogor Regency in Figures 2008. Indonesia: Badan Pusat Statistik.
Butler EMC, AG Lane, CM O'Sullivan, PCH Miller, CR Glass. 2010. Bystander exposure to pesticide spray drift: New data for model development and validation. Biosystems Eng. 107(3):162‐168.
24
Dangwal LR, Amandeep S, Antima S, Tajinder S. 2011. Effect of Weeds on The Yield of Maize Crop in Tehsil Nowshera District Rajouri, J&K. Int J Current Res. 7(3):67:70.
De Datta SK, RW Herdt. 1983. Weed Control Technology in Irrigated Rice. Proceeding. The Weed Control in Rice Conference. IRRI. Los Banos, Philippines, August 31 – September 4, 1981. p89-108.
De Wit A, Baruth B, Boogaard H, van Diepen K, van Kraalingen D, Micale F, te Roller J, Supit I, van den Wijngaart R. 2010. Using ERA-INTERIM for regional crop yield forecasting in Europe. Clim Res. 44:41-53.
Direktorat Jendral Pertanian Tanaman Pangan. 1982. Evaluasi Penggunaan Herbisida pada Pertanaman padi di Kabupaten Karawang, Indramayu, Deli Serdang, Sidrap dan Muba. Jakarta. Direktorat Jendral Tanaman Pangan. p26. Domiri DD, Adhyani NL, Nugraheni S. 2005. Paddy Rice Growth Model Using
MODIS Data for Estimating Paddy Rice Age. Proceeding. The 14th PIT MAPIN, Surabaya, Indonesia.
Evans LT. 1996. Crop Evolution, Adaptation and Yield. UK: Cambridge University Press.
Handoko. 2006. Unsur-unsur Cuaca dan Iklim. Kumpulan Makalah Pengantar ke Ilmu-ilmu Pertanian. Bogor. Litera Antar Nusa.
Harker K Neil, John T O‟Donovan. 2013. Weed Control, Weed Management, and Integrated Weed Management. Weed Tech. 27:1-11.
Hoffer JA, George JF, Valacich JS. 2007. Modern Systems Analysis and Design. Upper Saddle River: Prentice Hall.
Hofman V, Elton S. 2001. Reducing Spray Drift. EXT NDSU Extension Service. North Dakota State University, Fargo, North Dakota 58105. AE-1210. p1-8. Holm L, Pancho JV, Herberger JP, Pulkenett DL. 1979. A geographical atlas of
world weeds. Johnwiley.
Huete AR, Liu HQ, Batchily K, Van Leeuwen W. 1997. A Comparison of Vegetation Indices over a Global Set of TM Images for EOS-MODIS. Remote Sensing of Environ. 59:440-451.
Huffman GJ, Adler RF, Bolvin DT, Gu G, Nelken EJ, Bowman KP, Hong Y, Stocker EF, Wolf DB. 2007. The TRMM Multisatellite Precipitation Analysis (TMPA): Quasi-Global Multiyear, Combined-Sensor Precipitation Estimates at Fine Scals. J Hydrometeo. 8:38-55.
Jason ST. 2009. How Weather Conditions Affect Spray Applications. http://www.omafra.gov.on.ca/english/crop/. (Accessed 20 Juli 2013).
Kjaer C, M Strandberg, M Erlandsen. 2006. Metsulfaron spray drift reduces fruit yield of Hawtorn (Crataegus monogyna L.). Sci Tot Environ. 356(1-3):228-234. Labrada R. 2003. The Need for Improved Weed Management in Rice. In Dat Van
Tran (Ed.) Sustainable of production for food security. Proceesing of the 20th session of the International Rice Commission. Bangkok, Thailand, 22-26 July 2002. FAO, Rome.
[LAPAN] Indonesia Aerospace Agency. 2012. Monsun. http://moklim.dirgantara-lapan.or.id/content/monsun. (Accessed 04 January 2014).
25 Nantasomsaran P, K Moody. 1993. Weed Management for Rainfed Low-land Rice.
Proceeding. The Second Annual Technical Meeting of the Rainfed Lowland Rice Consortium, Semarang, Indonesia, 10-13 February 1993.
Nuyttens D, M De Schampheleire, K Baetens, E Brusselman, D Dekeyser, P Verbov. 2011. Drift from Field Crop Sprayers Using an Integrated Approach: Results of a Five‐Year Study. Transactions of The ASABE. 54(2):403-408. Nyarko k, SD De Datta. 1991. A Handbook for Weed Control in Rice. IRRI.
Manila, Philippines.
O‟Brein JA. 1999. Management Information System. Arizona USA: McGraw Hill. Otto S, L Lazzaro, A Finizio, G Zanin. 2009. Estimating ecotoxicological effects of pesticide spray drift on nontarget arthropods in field hedgerows. Env Toxic and Chem. 28(4):853-863.
Oudhia P and Tripathi RS. 1998. Allelopathic effects of Parthenium hysterophorus L. on kodo, Mustard and problematic weeds. First International Conference on Parthenium management. Dhaward. India. p136-139.
Pane H, ES Noor, Z Susanti. 2002. Weed Characterization in Walik Jerami Rice in Rainfed Lowland Area. Penelitian Pertanian Tanaman Pangan. 21(3):6-14. Pane H, SY Jatmiko. 2009. Pengendalian Gulma pada Tanaman Padi. Publikasi
Balai Besar Penelitian Tanaman Padi. Subang. No 160. p1-28. http://www.litbang.deptan.go.id/special/padi/bbpadi_8/bbpadi_2009_itp_10.pd f. (Accesed 9th February, 2013).
Peters BG. 1955. Soil-inhabiting nematodes. In Soil zoology, Butterworth sci. Publ. London. p 44-54.
Reddy KN, W Ding, RM Zablotowicz, SJ Thomson, Y Huang, LJ Krutz. 2010. Biological responses to glyphosate drift from aerial application in non-glyphosate-resistant corn. Pest Manag Sci. 66(10):1148-1154.
Roebeling RA, Van Putten E, Genovese G, Rosema A. 2004. Application of meteosat derived meteorological information for crop yields predictions in Europe. Int J Remote Sensing. 25:5389-5401.
Rotinsulu, Yan Y. 2011. Rancang Bangun Aplikator Cair dengan Sistem Kontrol Modulasi Lebar Pulsa. Undergraduate Thesis. Bogor: Graduate School IPB. Rusdiyatmoko A, Zubaidah A. 2005. Analisis Spektral Data Modis untuk
Pemantauan Hutan/Lahan (Studi Kasus Provinsi Sumatra Selatan). Pertemuan Ilmiah Tahunan MAPIN XIV. Surabaya. SDA:1-9.
Sakamoto T, Yokozawa M, Toritani H, Shibayama M, Ishitsuka N, Ohno H. 2005. A crop phenology detection method using time-series MODIS data. Remote Sensing of Environ. 96:366-374.
Sari DK, Ismullah IH, Widyo N, Sulasdi, Harto AB. 2010. Detecting Rice Phenology in Paddy Fields with Complex Cropping Pattern Using Time Series MODIS Data, A Case study of Northern Part of West Java – Indonesia. J Sci ITB. 42(2):91-106.
Semedi JM. 2012. Rice Crop Spatial Distribution and Production Estimation using MODIS EVI (Case study of Karawang, Subang, and Indramayu Regency). Master Thesis. Bogor: Graduate School IPB.
26
Setiawan Y, Kunihiko Y, William DP. 2011. Characterizing Temporal Vegetation Dynamics of Land Use in Regional Scale of Java Island, Indonesia. J of Landuse Sci. 1:1-30.
Solahudin M. 2013. Development of weed Control Method in Precision Farming Based on Multi Agent Computing. PhD Thesis. Bogor: Graduate School IPB. Tepper G. 2012. Weather Essential for Pesticide Application. Australia: Grain
Research & Development Corporation.
Uchida S. 2007. Monitoring of Paddy Rice Planting with Complex Cropping Pattern Using Satellite Remote Sensing Data – A Case of West Java, Indonesia. Proceedings of the 28th Asian Conference on Remote Sensing (ACRS), Kuala Lumpur, Malaysia.
Utami S. 2004. Kemelimpahan Jenis Gulma Tanaman Wortel pada Sistem Pertanian Organik. JBIOMA. 6:54-58.
Wolf TM. 2006. Meeting variable application goals with new application technology. Agriculture and Agri-Food Canada, Saskatoon Research Centre. Paper of Grain Research and Development Corporation.
World Bank. 1996. “Annual Report”. World Bank Participation Sourcebook. Wasington DC.
Xiao X, Boles S, Frolking S, Salas W, Moore IB, Li C. 2002. Observation of Flooding and Rice Transplanting of Paddy Rice Fields at The Site to Landscape Scales in China using VEGETATION Sensor Data. Int J of Remote Sensing. 23:3009-3022.
Xiao X, Boles S, Liu J, Zhuang D, Frolking S, Li C, Sales W, Moore IB. 2005. Mapping Paddy Rice Agriculture in Southern China Using Multi-Temporal MODIS Images. Remote Sensing of Environ. 95:480-492.
27 Appendix 1 Coordinate of several paddy fields in Jonggol
Paddy Field Lat Lon
A -6.50484 107.0981
B -6.47141 107.073
C -6.47559 107.1273
D -6.46724 107.1106
E -6.48812 107.0605
F -6.49648 107.0563
G -6.47977 107.0521
H -6.4547 107.0187
I -6.45052 107.0145
J -6.47977 107.0688
K -6.48395 107.0688
L -6.51319 107.1064
28
29
Appendix 3 Examples of processing netCDF data
Download file temperature from NCEP/NCAR Reanalysis 1: Surface
http://www.esrl.noaa.gov/psd/data/gridded/data.ncep.reanalysis.surface.html
Save file to your directory: temp.1980-2013.nc Open file using grads
Start All Programs Accessories Command Prompt C:\Users\Rizky>E:
E:\> grads
ga -> sdfopen temp.1980-2013.nc // open file *.nc format
ga -> q file // query file
ga -> d air // display variable
ga -> clear // clear display
ga -> set gxout shaded // show file using color ga -> d air
ga -> cbarn // show legend
ga -> draw title Temperature of Indonesia // make a title
30
ga -> set lat 7.5 7.5 // display air temperature in a point ga -> set lon 107.5 107.5 // example point is lat 7.5, lon 107 ga -> set t 1 12175
ga -> d air
ga -> set t 1 1830 // 10 years
ga -> draw title Daily Temperature (K) at lat 7.5 lon 107.5
Processing Wind Data
uwnd.nc //northern wind vwnd.nc //southern wind Wind speed = √
Step by step:
E:\> cdo sqr uwnd.nc uwnd_sqr.nc E:\> cdo sqr vwnd.nc vwnd_sqr.nc
E:\> cdo add uwnd_sqr.nc vwnd_sqr.nc wind_add.nc E:\> cdo sqrt wind_add wind_spd.nc
Piping:
E:\> cdo sqrt –add –sqr uwnd.nc –sqr vwnd.nc wind_spd.nc
Convert netCDF file to text file:
31 Appendix 4 Sourcecode of Application for Minimizing Spray Drift
Dim i As Integer
Dim lintang1, bujur1, tahun, hari, alti, hujan, radiasi, temp, wind, rh, hujan2, nn, nnn
Private Sub Command1_Click()
Open App.Path & "\weather.csv" For Input As #1
For i = 1 To 366 If wind < 2 Or wind > 20 Then Text6.Text = "Do not spray"
34
CURRICULUM VITAE
The author was born in Pati, Central Java, Indonesia on March, 9th 1989. He is child of couples Supeno and Iros Rositawati. He is the first from four brothers. In 2006, he was finished his Senior High School in SMA Negeri 1 Leuwiliang, Bogor. He finished his bachelor degree in Agricultural Engineering from Faculty of Agricultural Engineering and Technology, Bogor Agricultural University in 2010 with thesis topic is Early Warning System for Food Security using Artificial Neural Network. In 2011, he pursues his MSc degree in Information Technology for Natural Resources Management, an international program under the collaboration of Bogor Agricultural University and Southeast Asian Regional Centre for Tropical Biology (SEAMEO BIOTROP). In 2011 and 2012 he attended the training of Geographic Information System (GIS) for Potential Biodiversity mapping. In 2013, he graduated from International Short Stay Program in Agricultural for Education and Sustainable Development (Ag-ESD) from The University of Tsukuba, Ibaraki, Japan. He completed his master