BLOOD GLUCOSE DETECTION USING GSR SENSOR
NURUL NADIAH BINTI BORHANNODIN
This report is submitted in partial fulfillment of the requirements for the Bachelor of Electronic Engineering (Industrial Electronics)
Fakulti Kejuruteraan Elektronik Dan Kejuruteraan Komputer Universiti Teknikal Malaysia Melaka
UNIVERSTI TEKNIKAL MALAYSIA MELAKA
FAKULTI KEJURUTERAAN ELEKTRONIK DAN KEJURUTERAAN KOMPUTER
BORANG PENGESAHAN STATUS LAPORAN
PROJEK SARJANA MUDA II
Tajuk Projek : ………
………
Sesi Pengajian :
Saya ……….. (HURUF BESAR)
mengaku membenarkan Laporan Projek Sarjana Muda ini disimpan di Perpustakaan dengan syarat-syarat kegunaan seperti berikut:
1. Laporan adalah hakmilik Universiti Teknikal Malaysia Melaka.
2. Perpustakaan dibenarkan membuat salinan untuk tujuan pengajian sahaja.
3. Perpustakaan dibenarkan membuat salinan laporan ini sebagai bahan pertukaran antara institusi pengajian tinggi.
4. Sila tandakan ( √ ) :
SULIT* *(Mengandungi maklumat yang berdarjah keselamatan atau kepentingan Malaysia seperti yang termaktub di dalam AKTA RAHSIA RASMI 1972)
TERHAD** **(Mengandungi maklumat terhad yang telah ditentukan oleh organisasi/badan di mana penyelidikan dijalankan)
TIDAK TERHAD
Disahkan oleh:
__ ________________________ ___________________________________
(TANDATANGAN PENULIS) (COP DAN TANDATANGAN PENYELIA)
Tarikh: ……….. Tarikh: ………..
BLOOD GLUCOSE DETECTION USING GSR SENSOR
1 5 / 1 6
NURUL NADIAH BINTI BORHANNODIN
iii
DECLARATION
“I hereby declare that the work in this project is my own except for summaries and quotations which have been duly acknowledge.”
Signature : ...
Author : ...
Date : ...
NURUL NADIAH BINTI BORHANNODIN
iv
APPROVAL
“I acknowledge that I have read this report and in my opinion this report is sufficient in term of scope and quality for the award of Bachelor of Electronic Engineering
(Industrial Electronics/ Computer Engineering/ Electronic Telecommunication/ Wireless Communication)* with Honours.”
Signature : ...
Supervisor’s Name : ...
Date : ...
DR. WIRA HIDAYAT BIN MOHD SAAD
v
DEDICATION
vi
ACKNOWLEDGEMENT
“In the name of Allah, the most Gracious, most Powerful, and the most Merciful”
Firstly, praise to Allah SWT for guiding and blessing with perseverance and strength to complete the project. Without the strength gave to me from the God, this project can’t be finish within the time provided. First of all, I would like to express my biggest appreciation to my beloved Project Supervisor, Dr. Wira Hidayat Bin Mohd Saad for all his precious support and advices during completing this project. Furthermore, he guides me consistently and gives full dedication throughout the semester.
I also would like to thank my beloved family especially my father and my mother for giving me the truly support and motivation to complete this project report. I am very appreciating of their understanding towards my commitment to finish the PSM report. Bundle of thanks to my friend especially for those who gave me the precious help and support in completing this project. Last but not least, I would like to thanks all the people who involved directly and indirectly to give contribution to complete my final year project.
vii
ABSTRACT
The galvanic skin response (GSR) is the skin conductance, which influenced by a variety of factor, though the most important to be moisture. A low-level electric voltage will apply to the skin and the skin’s conduction is measured. Skin conductance is considered to be a function of the sweat gland activity and the skin’s pore size. The project is developed based on the polygraph test where the small amount of sweat released will make the GSR sensor reactive due to the change in conductance. The purpose of this project is to detect the blood glucose by using the GSR sensor and to establish a correlation between GSR and the blood glucose level. This project was divided into two parts, which are the hardware implementation and software implementation. For the hardware implementation, it is between the GSR sensor and human skin conductance which to detect the glucose level which contains in sweats. While for software implementation, the Arduino program is developed to collect and save the user data. Based on the analysis of data and the linear value, it can conclude that there is a correlation between the skin response and blood glucose level. The correlation between blood glucose and GSR is R2= 0.7342. This linear equation can be used to predict the value of blood glucose
viii
ABSTRAK
Tindak balas Galvanik Kulit (GSR) adalah kekonduksian kulit yang dipengaruhi oleh pelbagai faktor, dimana faktor yang paling penting adalah kelembapan. Voltan elektrik tahap rendah akan diaplikasikan kepada kulit dan kekonduksian kulit diukur. Kekonduksian kulit merupakan salah satu daripada fungsi aktiviti kelenjar peluh dan saiz liang-liang kulit. Projek ini dibangunkan berdasarkan hasil ujian poligraf dimana jumlah pengeluaran peluh yang kecil akan mengaktifkan sensor GSR bergantung kepada perubahan dalam kekonduksian. Tujuan projek ini adalah untuk mengesan tahap kepekatan glukosa darah dengan menggunakan sensor GSR dan membuat korelasi diantara GSR dan tahap kepekatan glukosa darah. Projek ini telah dibahagikan kepada dua bahagian, iaitu pelaksanaan perkakasan dan pelaksanaan perisian. Pelaksanaan perkakasan adalah antara sensor GSR dan kekonduksian kulit manusia dimana ianya mengesan tahap glukosa yang terkandung dalam peluh. Manakala bagi pelaksanaan perisian, program Arduino digunakan untuk mengumpul dan menyimpan data pengguna. Berdasarkan analisis data dan nilai linear, kesimpulan dapat dibuat bahawa terdapat hubungan antara tindak balas kulit dan tahap glukosa darah. Terdapat korelasi diantara glukosa darah dan juga
GSR secara linear dengan nilai R2=0.7342. Persamaan linear ini boleh digunakan
ix
TABLE OF CONTENTS
CHAPTER CONTENT PAGES
TITLE i
REPORT STATUS VERIFICATION FORM ii
DECLARATION iii
APPROVAL iv
DEDICATION v
ACKNOWLEDGEMENT vi
ABSTRACT vii
ABSTRAK viii
TABLE OF CONTENT ix
LIST OF FIGURES xiii
LIST OF TABLES xv
x
LIST OF APPENDICES xvii
I INTRODUCTIONS
1.1 PROJECT INTRODUCTION 1
1.2 PROBLEM STATEMENT 2
1.3 OBJECTIVE OF PROJECT 2
1.4 SCOPE OF PROJECT 3
1.5 CHAPTER REVIEW 3
II LITERATURE RIVIEW
2.1 HUMAN SKIN 6
2.1.1 SKIN DIELECTRIC PROPERTIES 7
2.1.2 SWEAT 9
2.2 GLUCOSE LEVEL 9
2.2.1 NORMAL VS. DIABETIC 10
2.2.2 INVASIVE VS. NON-INVASIVE METHOD 12 2.2.3 GLUCOSE CONCENTRATION AND
xi
2.3 GSR SENSOR 13
2.4 ARDUINO 14
2.4.1 ARDUINO UNO 14
2.5 PREVIOUS STUDY 16
III METHODOLOGY
3.1 PROJECT FLOW 19
3.2 SOFTWARE IMPLEMENTATION 21
3.3 HARDWARE IMPLEMENTATION 23
3.4 SYSTEM FLOW 28
3.5 EXPERIMENT 29
3.5.1 PROCEDURE 29
IV RESULT & DISCUSSION
4.1 SOFTWARE AND HARDWARE DEVELOPMENT 33
4.2 EXPERIMENT OF GSR DEVICE VS. GLUCOMETER 35
xii
4.2.2 GLUCOMETER 38
4.2.3 GSR DEVICE VS. GLUCOMETER 38
4.3 DISCUSSION 43
V CONCLUSSION & RECOMMENDATION
5.1 CONCLUSION 45
5.2 PROJECT COMMERLIZATION AND
SUSTAINABILITY 46
5.3 PROJECT RECOMMENDATION AND FUTURE
WORK 46
REFERENCE 47
xiii
LIST OF FIGURE
Figure 2.1: Cross-section of the skin 6
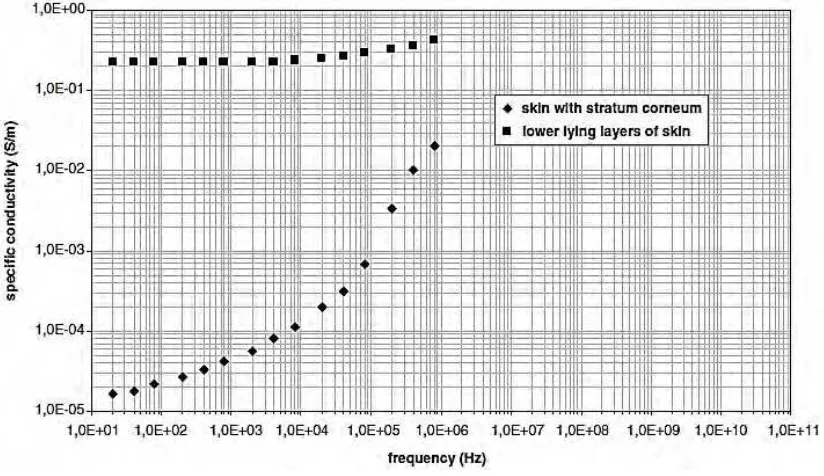
Figure 2.2: Specific conductivity of intact skin with dominating stratum corneum (diamonds) and lower-lying layers of the
skin alone (boxes) 7
Figure 2.3:Relative permittivity of intact skin with dominating stratum corneum (diamonds) and lower-lying layers of the
skin alone (boxes) 8
Figure 2.4: Glucometer 12
Figure 2.5: GSR Sensor (sweating) 14
Figure 2.6: Arduino UNO (USA only) and Genuino UNO (outside USA) 15
Figure 2.7: Schematic diagram Arduino UNO Board 15
Figure 3.1: Overall flowchart of the project 20
Figure 3.2 :Flowchart of software implementation 21
Figure 3.3: Circuit diagram for GSR Sensor 22
xiv
Figure 3.5: Arduino Monitor IDE 23
Figure 3.6: Flowchart of hardware implementation 24 Figure 3.7: Circuit design on ISIS Proteus Professional for GSR
Sensor circuit 25
Figure 3.8: Circuit layout on ARES Proteus Professional for GSR
Sensor circuit 25
Figure 3.9: GSR Sensor circuit 26
Figure 3.10: GSR Sensor Circuit with the GSR electrodes connected
with Arduino Uno Board 27
Figure 3.11: Block diagram of system flow 28
Figure 3.12: GSR sensor equipment 30
Figure 3.13: Glucometer equipment 30
Figure 4.1: Schematic design for GSR Sensor circuit 33
Figure 4.2: Simulation result with 50kΩ input 34
Figure 4.3: Simulation result with 2MΩ input 34
Figure 4.4: GSR reading measurement process 35
Figure 4.5 :The output signal using Arduino Monitor 36 Figure 4.6 :The output reading using Arduino Serial Monitor 37
Figure 4.7 :The data saved in Excel Microsoft 37
Figure 4.8 :Glucometer measuring process 38
Figure 4.9: Scattered graph of GSR measurement versus Glucometer
xv
LIST OF TABLES
Table 2.1: Low blood glucose level 10
Table 2.2: High blood glucose level 11
Table 2.3: Normal blood sugar levels for women 11
Table 2.4: Normal blood glucose level for men 11
Table 2.5: Blood sugar level for kids and adults 11
Table 2.6: Drawback of Others Non-invasive Method to Detect Glucose
Level in Human body 16
Table 4.1 : First experiment result 39
Table 4.2: Second experiment result 39
Table 4.3: Third experiment result 40
Table 4.4: First experiment result 41
Table 4.5: Second experiment result 41
xvi
LIST OF ABBREVIATIONS
GND - Ground
GSR - Galvanic Skin Response LCD - Liquid Crystal Liquid NIR - Near Infrared
PC - Personal Computer
RC - Resistor-capacitor
SC - Stratum Comeum
xvii
LIST OF APPENDICES
APPENDIX TITLE PAGES
A Arduino Schematic Diagram 48
1
CHAPTER I
INTRODUCTION
1.1 Project Introduction
2
1.2 Problem Statement
Over the year 2014, about 2.6 millions of people diagnosed with diabetes in Malaysia. Many of these people are forced to draw blood every day in order to determine their blood glucose level. This information is vital in order to maintain insulin levels via injection. This entire process is painful and some people scared to undergoes the blood glucose test for the first time. This project is a way to overcome the issue by finding the correlation between the blood sugar level and the phenomenon known as the Galvanic Skin Response (GSR), which measures the conductivity of one’s skin.
1.3 Objective of Project
The aim of this project is to design the blood glucose detector using GSR Sensor. In order to achieve that, the objectives have been set for the research. The objectives are:
1. To investigate the dielectric properties of the skin and parameter that relevance to blood glucose detection.
2. To build a device that can detect blood glucose level by obtaining physiological signal (sweat).
3
1.4 Scope of Project
The scope of this project is to design and develop the detection of blood glucose level by using GSR. This system is develop using Arduino board and will be tested by using the GSR sensor. The GSR data will compare with the blood glucose level which tested using the normal glucometer (strip).
1.5 Chapter Review
In Chapter 1, the general overview of this project is described. This chapter consists of short introduction about the project, a problem statement, the objectives, the scope of project and the review all chapter of the thesis.
In Chapter 2, the review on the previous study or work which related to the project had been described. The Galvanic Skin Response (GSR) sensor technology has been discussed in this chapter.
The methodology to achieve the project objectives have been stated in Chapter 3. In this part, it explains about the method used to develop a system. The software will help to stimulate the circuit and display the data of the project. The software and hardware are combined together to develop a GSR sensor device which can detect the blood glucose level.
4
5
CHAPTER II
LITERATURE REVIEW
6
2.1 Human Skin
Skin is the largest organ of the body, which making up 16% of body weight, with a surface area of 1.8 m2. There are three structural layers in the skin which are epidermis, dermis, and subcutis while hair, nails, sebaceous, sweat and apocrine gland act as derivatives of skin [1]. The cross section of skin layer can be seen as on Figure 2.1. The epidermis is the outer layer where served as the physical and chemical barrier between the interior body and external environment. The dermis is the deeper layer which provides the structural support of the skin. And the third layer is subcutis which is a loose connective tissue layer and function as a depot of fat.
7
2.1.1 Skin Dielectric Properties
Basically, human skin has three different layers which are epidermis, dermis, and subcutaneous tissue. The outer layer of the skin which is epidermis has different thickness. The thinnest layer is on the eyelids at 0.05mm and the thickest is on the palms and soles at 1.5mm [3]. There are different layers of the epidermis, however, the outermost layer, stratum corneum (SC) contributes a great deal to the dielectric properties for the skin. In order to provide a stable and reliable interface between the sensor and skin, it required the measurement of dielectric properties of the skin. The dielectric response of the skin had been attributed to the changes in dielectric polarization and it will give a variation in glucose concentration. [4]
![Figure 2.1: Cross section of human skin [2]](https://thumb-ap.123doks.com/thumbv2/123dok/469926.51355/23.595.190.451.346.585/figure-cross-section-human-skin.webp)