CopyrightÓ2007 by the Genetics Society of America DOI: 10.1534/genetics.107.078659
Association Analysis of Historical Bread Wheat Germplasm Using
Additive Genetic Covariance of Relatives and Population Structure
Jose´ Crossa,*
,1Juan Burguen˜o,* Susanne Dreisigacker,* Mateo Vargas,*
Sybil A. Herrera-Foessel,* Morten Lillemo,
†Ravi P. Singh,* Richard Trethowan,
‡Marilyn Warburton,* Jorge Franco,
§Matthew Reynolds,*
Jonathan H. Crouch* and Rodomiro Ortiz*
*International Maize and Wheat Improvement Center (CIMMYT), 06600 Me´xico, D.F., Mexico,†Department of Plant and Environmental Sciences, Norwegian University of Life Sciences, N-1432 A˚s, Norway,‡University of Sydney,
Camden NSW 2570, Australia and§Facultad de Agronomı´a, Universidad de la Repu´blica del Uruguay, CP 12900, Montevideo, Uruguay
Manuscript received July 18, 2007 Accepted for publication September 9, 2007
ABSTRACT
Linkage disequilibrium can be used for identifying associations between traits of interest and genetic markers. This study used mapped diversity array technology (DArT) markers to find associations with resistance to stem rust, leaf rust, yellow rust, and powdery mildew, plus grain yield in five historical wheat international multienvironment trials from the International Maize and Wheat Improvement Center (CIMMYT). Two linear mixed models were used to assess marker–trait associations incorporating information on population structure and covariance between relatives. An integrated map containing 813 DArT markers and 831 other markers was constructed. Several linkage disequilibrium clusters bearing multiple host plant resistance genes were found. Most of the associated markers were found in genomic regions where previous reports had found genes or quantitative trait loci (QTL) influencing the same traits, providing an independent validation of this approach. In addition, many new chromosome regions for disease resistance and grain yield were identified in the wheat genome. Phenotyping across up to 60 environments and years allowed modeling of genotype 3 environment interaction, thereby making possible the identification of markers contributing to both additive and additive3additive interaction effects of traits.
A
useful new tool for crop genetic improvement is the identification of polymorphic markers associ-ated with phenotypic variation for important traits by means of linkage disequilibrium (LD) between loci (Thornsberryet al. 2001; Flint-Garciaet al. 2003). A major advantage of this approach over conventional linkage mapping is that it does not require the time-consuming and expensive generation of specific genetic populations. LD is determined by the physical distance of the loci across chromosomes and has proven useful for dissecting complex traits because it offers fine-scale mapping due to the inclusion of historical recombina-tion (Lynchand Walsh1998). However, false positive correlation between markers and traits can arise in the absence of physical proximity due to population struc-ture caused by admixstruc-ture, mating system, and genetic drift or by artificial or natural selection during evolu-tion, domesticaevolu-tion, or plant improvement ( Janninkand Walsh 2002). False associations can also be caused by alleles occurring at very low frequencies in the initialpop-ulation (Breseghelloand Sorrells2006a,b). These fac-tors create LD between loci that are not physically linked and cause a high rate of false positives when relating polymorphic markers to phenotypic trait variation. Thus, separating LD due to physical linkage from LD due to population structure is a critical prerequisite in associa-tion analyses.
Population structure can be quantified using Bayesian analysis, which has been effective for assigning individ-uals to subpopulations (Q matrix) using unlinked markers (Pritchard et al. 2000). Other multivariate statistical analyses such as classification (clustering) and ordination (scaling) can also be used to account for population structure (Kraakman et al. 2004). Popula-tion structure in modern breeding populaPopula-tions can be caused by complex pedigrees derived from crosses of parents with different levels of relatedness. Relation-ships between individuals can be detected by means of (1) marker-based estimation of the probability of iden-tity by descent between individuals, (2) coefficient of parentage (COP) that measures the covariance between related individuals in a population (Parisseaux and Bernardo2004), and (3) both types of analysis simul-taneously (Arbelbideand Bernardo2006; Malosetti
1Corresponding author: Biometrics and Statistics Unit, Crop Research
Informatics Laboratory, CIMMYT, Apdo. Postal 6-641, 06600 Me´xico, D.F., Mexico. E-mail: [email protected]
et al. 2007). Yuet al. (2006) incorporated the outcome of population structure (Qmatrix), with the estimation of relatedness between individuals obtained through the marker-based kinship matrix (K), into a unified linear mixed-model approach. Yuet al. (2006) showed that this approach effectively decreases type I error rates (false positives) and increases the power of the marker–trait association tests.
Successful application of association analysis requires comprehensive phenotypic data for modeling genotype
3 environment interaction (GE). However, an advan-tage of association analysis is that it can be based on historical phenotypic data from breeding trials, which in the case of the International Maize and Wheat Improve-ment Center (CIMMYT)’s wheat breeding programs is in plentiful supply. Linear mixed-model methodology applied to plant phenotypic data allows accurate pre-diction of genotypic performance using covariance structures that consider genetic associations between rel-atives included in the experiment. Using linear mixed-model methodology, a genetic covariance matrix can be estimated, and best linear unbiased predictors (BLUPs) can be obtained. BLUPs for simultaneously modeling GEand incorporating information on additive genetic variation have been previously suggested by Crossaet al. (2006) and Burguen˜oet al.(2007).
The CIMMYT wheat breeding program concentrates on producing stable high-yielding and widely adapted advanced breeding lines (Braunet al. 1996; Rajaram
et al.1996). CIMMYT bread wheat (Triticum aestivumL.) germplasm is known to contain various photoperiod insensitivity genes, dwarfing genes, and rust resistance genes (Trethowan et al. 2007). Grain yield and re-sistance to diseases, particularly to the rusts, are primary selection criteria, and the generation of closely linked molecular markers would speed up the breeding pro-gress. CIMMYT’s wheat breeding program annually distributes improved germplasm to a network of wheat research and breeding cooperators across the world who evaluate this material in many different environments and agronomic conditions. Phenotypic data from these trials have been cataloged, analyzed, and made available to the network. The data are used at CIMMYT to identify parents for future crosses and to drive the strategic incorporation of new genetic variability into advanced lines that are consequently able to cope with the dynamics of abiotic and biotic stresses.
In this study, we investigate the association of 242 diversity array technology (DArT) markers with resis-tance to stem (black) rust (caused byPuccinia graminisf.sp. tritici), leaf (brown) rust (caused byP. triticina), yellow (stripe) rust (caused byP. striiformis), powdery mildew (caused byBlumeria graminisf.sp.tritici), and grain yield in five historical CIMMYT elite spring wheat yield trials (ESWYT) conducted from 1979 to 2004 with data col-lected from up to 60 international environments. Two linear mixed models were used to assess marker–trait
associations incorporating information on population structure and additive genetic covariance between relatives.
MATERIALS AND METHODS
Association populations and phenotypic data:A total of 170 wheat lines derived from five CIMMYT elite spring wheat yield trials (ESWYT 1, ESWYT 6, ESWYT 10, ESWYT 20, and ESWYT 24) from 1979, 1984, 1988, 1999, and 2004, respectively, were included in this study. The data in each ESWYT were usually balanced, although for some traits data were recorded only from one replicate in some locations. There were no lines in common among the ESWYTs selected for this study, except for Genaro T81, which was included in ESWYTs 1 and 6. Depend-ing on the trait and the specific ESWYT, the number of sites used for the various statistical analyses ranged from 6 to 60. Five traits were considered in this study: response to stem rust (SR) (percentage of infection), leaf rust (LR) (percentage of infection), yellow rust (YR) (percentage of infection), and powdery mildew (PM) (scored on a scale of 1–9) and grain yield (GY in tons per hectare). Association analyses were first performed for each of the five ESWYTs individually, and then the five ESWYTs were grouped into two sets related by year. ESWYTs 1, 6, and 10, which included 76 lines, formed ESWYT set 1, and ESWYTs 20 and 24, with 94 lines, formed ESWYT set 2. Unadjusted means of the five traits for each of the 170 wheat lines, their selection identifiers (SID), cross identifier (CID), line names, and ESWYT number are given in the additional information in supplemental Table S1 at http://www.genetics. org/supplemental/.
Depending on the trait and set, different sites, countries, and site–country combinations were used for the analyses. All five traits were recorded in all five ESWYTs in at least six sites, except SR, which was recorded only in sites of ESWYTs 1, 6, and 24.
DArT assay and map construction: DArT markers were generated by Triticarte Pty. Ltd. (Canberra, Australia; http:// www.triticarte.com.au), a whole-genome profiling service lab-oratory, as described by Akbari et al. (2006). The locus designations used by Triticarte Pty. Ltd. were adopted in this article, and DArT markers were named using the prefix ‘‘wPt,’’ followed by a unique numerical identifier. An integrated map of the DArT markers was developed using previous reported maps from diverse segregating populations, including: (1) Cranbrook 3Halberd, 339 DArT (Akbari et al. 2006); (2) Arina3NK93604, 189 DArT (Semagnet al. 2006); (3) Avocet 3Saar, 112 DArT (M. Lillemo, unpublished data); and (4) selected linkage groups of markers from nine different popu-lations published by Triticarte Pty. Ltd. (http://www.triticarte. com.au). The integrated map was constructed with the soft-ware package CMTV (Sawkinset al.2004); it included a total of 1644 markers, 813 of which were DArT markers and 831 of which were markers based on simple sequence repeats (SSRs), amplified fragment length polymorphisms (AFLPs), or restric-tion fragment length polymorphisms (RFLPs). Of a total of 813 DArT markers, 318 were polymorphic in the lines in-cluded in this study, and 242 of these were located on the final integrated map. A total of 76 polymorphic DArT markers could not be integrated into the final map (these are hereafter referred to as unmapped markers).
Population structure: Possible population substructuring was investigated using the program STRUCTURE (Pritchard
considered for each ESWYT. For the two ESWYT sets,Kwas set between 1 and 30. Lines within a subpopulation were assumed to be in Hardy–Weinberg equilibrium, as well as in linkage equilibrium (LE). In addition, the neighbor-joining clustering algorithm was run on the 170 lines (within ESWYTs and within combined ESWYT sets), using the Jaccard similarity coefficient as a proximity matrix with all 318 polymorphic DArT markers and the software DARWIN (Perrieret al.2003). This step was undertaken to confirm the results of the population structure obtained from STRUCTURE.
Linkage disequilibrium: Estimating LD between markers measures whether markers segregate independently or not. The program TASSEL (http://www.maizegenetics.net) was used to estimate the LD parameter r2 among loci, and the
comparisonwise significance was computed with 1000 permu-tations. Ther2parameter was estimated for unlinked loci and
for loci on the same chromosome. The latter was plotted for each ESWYT against genetic distance measured in centimor-gans. A critical value forr2
, as evidence of linkage, was derived using the 95% percentile of unlinked loci according to
Breseghelloand Sorrells(2006a). If, within a chromosome
region, all pairs of adjacent loci were in LD, this region was referred to as an LD block (LDb).
The COP matrix:The COP between individualsiandi9is the probability that an allele from a randomly selected locus in individuali is identical by descent with an allele randomly selected from the same locus in individuali9 (Cockerham
1971). The genetic covariance between relatives due to their additive genetic effects is equal to two times the coefficient of parentage (Kempthorne1969) (COP¼fii9) times the additive genetic variance;i.e., 2fii9s2a¼As2a;where Ais the additive relationship matrix ands2ais the additive genetic variance. In the case of self-pollinating species with successive generations of inbreeding, COP between sister lines decreases with in-creasing numbers of generations following the split from the common ancestor. The Browse application of the International Crop Information System (ICIS), as described in http://cropwiki. irri.org/icis/index.php/TDM_GMS_Browse (McLaren et al. 2005), was used for deriving the relationship matrix; this appli-cation accounts for selection as well as inbreeding and improves the accuracy of breeding value estimation. The different ESWYTs had different numbers of sister line groups (ranging from 2 to 5). Matrixfii9was computed for the 76 lines included in ESWYTset 1 and for the 96 lines of ESWYT set 2.
Linear mixed models used for association analyses: The linear mixed model (LMM) was used to control the broad level of population structure inferred from Pritchard’s STRUC-TURE using theQmatrix and the level of relatedness between wheat lines using the relationshipAmatrix. Two kinds of linear mixed models (LMM1 and LMM2) were used to fit data fromg lines, s sites, and r replicates (at each site) for modeling association of phenotypic traits with m markers. LMM1 is similar to some of the models proposed by Smithet al.(2002) for modelingGEand by Crossaet al.(2006) and Burguen˜ o
et al.(2007) for modelingGEwith matrixA. In LMM2, markers are included as covariates for modeling the fixed effects of marker3environment interaction in a manner similar to the partition proposed in the factorial regression model (van
Eeuwijket al. 1996).
Linear mixed model 1 with covariance between relatives for modeling line and line3environment interaction:Linear mixed model 1 (LMM1), which uses the relationship of the lines measured by theg3gAmatrix for modelingGE, is
Y¼XSb1ZRr1ZGg1e; ð1Þ
whereXSis the design matrix relatingYto the fixed effects of sites (b), andZRandZGare the design matrices relatingYto
the random effects of replicates within sites (r) and lines within sites (g), respectively. Vectorsr,g, andeare assumed to be normally distributed, with zero mean vectors and variance– covariance (VCV) matricesR,G, andE, respectively. The VCV matrixG, which combines the main effect of lines andGE, can be represented as G¼Sg5A, where 5 is the Kronecker product operator, and thejth diagonal element of thes3s matrixSgis the additive genetic variances2ajwithin thejth site, and the jjth element is the additive genetic covariance rjj9sajsaj9 between sitesjandj9; thus,rij9is the correlation of additive genetic effects between sitesjandj9. The VCV matrix Gwas modeled using the factor analytical model (Smithet al. 2002; Crossaet al.2006; Burguen˜ oet al.2007).
For each DArT marker, BLUPs of the lines obtained were used for contrasts of the predictable function of no difference between BLUPs with themth DArT marker¼1 and BLUPs of lines with themth DArT marker¼0. This was done using the VCV matrix of the BLUPs of lines obtained from LMM1. The contrasts between BLUPs were calculated by weighting each line with its probability of membership of each subpopulation obtained from matrixQ. The contrasts were performed for each marker at each subpopulation, as well as for each marker over all subpopulations.
A variant of LMM1 was proposed by Burguen˜ oet al. (2007) for partitioning the total genetic effect (g) of a line into additive (a) and additive3additive (i) effects, as in Oakey
et al. (2006). The covariance between individuals due to additive3additive effects in matrix notation is (A#A)¼A˜ (where # is the elementwise multiplication operator). This model (with the partition ofgintoaandi) was used only for GY in each individual ESWYT and in ESWYT set 2. Thus, results from these trials were presented in terms of GY, GYA, and GYAA, which refer to the total genetic effect, the additive effects, and the additive3additive effects, respectively. Highly unbalanced data for other traits in ESWYT set 1 prevented fitting LMM1 withg¼a1i.
Linear mixed model 2 with covariance between relatives for modeling the polygenic effects of lines and including marker 3
environment interaction as fixed effects:The best linear unbiased estimates (BLUEs) obtained from the individual-site analysis and their weights were used in the second-stage across-site analysis to calculate the BLUPs of the lines. The weights for the ith genotype in the jth location, wij, were computed as suggested by Cullis et al. (1996), wij ¼rijs2::=ˆs:j2;where rij is the number of replicates for the ith genotype in the jth environment, ˆs2
:j is the estimated error variance for the jth environment, ands2
:: is the pool error variance. The second-stage across-site analysis uses linear mixed model 2 (LMM2) with random sites (s), random polygenic effects of lines (g), and fixed covariables from matrixQof population structure and partitions theGEinto marker3environment interactions as fixed covariable effects
Y¼XQq1ZSb1ZGg1
X
m
XMEmmem1e; ð2Þ
where XQ is the design matrix of the fixed effects of population structure (covariate) (q);ZSandZGare the design matrices of the random effect of sites (s) and lines (g), and XMEis the design matrix for the fixed effect of the marker3 site interaction (me) for each of themmarkers. The design matrixXMEcontains the allelic values of the markers, which for DArT markers are 0 and 1 (or1 and 1). Vectorgis assumed to be normally distributed with zero mean and VCV matrixAs2a; vectors of random effects of sites (b) and residual error (e) are assumed to have a simple VCV.
Predictable functions of the contrast of the BLUPs of lines:For the case of association analysis, for a given markerm,
the null hypothesis of no difference between BLUPs of the lines with themth DArT marker¼1 and BLUPs of the lines with themth DArT marker¼0 was tested using a generalized t-statistic. The Wald z-statistics were also used for a simple contrast or WaldF-statistics for multiple contrasts. Asymptot-ically, the Wald statistics follow a chi-squared distribution.
Controlling the rate of false positives and the false discovery rate:CriticalP-values for assessing the significance of the null hypothesis were calculated using the Bonferroni genomewise error rate protection against rejecting a true null hypothesis (lower type I error rate). The testwise significance level was divided by the number of tests (markers). The control of the false discovery rate (FDR) for the test of each marker
(Benjaminiand Hochberg1995) was used as an independent
alternative method.
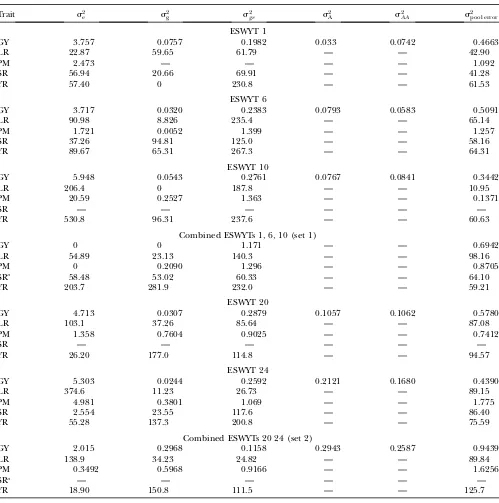
RESULTS
Variance component estimates are given in Table 1 for five traits in each individual ESWYT and in ESWYT sets 1 and 2. Site variability was important, but genetic as well asGEcomponents were also of considerable size. The additive and additive3 additive components and their interaction with sites for GY in ESWYTs 20 and 24, as well as in ESWYT set 2, were greater than those in ESWYTs 1, 6, and 10, probably due to the larger number of sites included in ESWYT set 2.
Linkage disequilibrium:LD analyses were performed for each ESWYT individually, for ESWYT sets 1 and 2, and for both sets combined. The LD patterns were distinct for each individual ESWYT; however, for ESWYT set 1, ESWYT set 2, and the combined sets, the LD patterns were very similar. As LD breakdown depends on the number and relatedness of the lines under study, this result was not unexpected. The percentage of physically linked loci pairs located in significant LD blocks was 26.2% in ESWYT set 1 (r2
.0.124,P,0.01), 25.3% in ESWYT set 2 (r2.0.182,P,0.01), and 27.6%
in both sets combined (r2.0.115,P,0.01). Pairwiser2
estimates were on average 0.169, 0.196, and 0.169 for ESWYT set 1, ESWYT set 2, and both sets combined, respectively. The percentages of unlinked pairs of loci that were in significant LD were 4.9% in ESWYT set 1, 5.0% in ESWYT set 2, and 5.0% in both sets combined. The estimated averages ofr2for unlinked loci were 0.03
in ESWYT set 1, 0.05 in ESWYT set 2, and 0.03 in both sets combined.
As depicted in Figure 1a for the LD of ESWYTset 1 and in Figure 1b for that of ESWYT set 2, LD decreases with increasing genetic map distance between marker loci. In all three cases, ther2declines within40 cM below
crit-ical values (indicating no linkage disequilibrium). This occurs at a larger distance than in previously reported studies of wheat (Breseghelloand Sorrells2006a), which focused on SSR markers across two chromosomes only. Since LD blocks in the seven chromosomal groups for each ESWYT set and in both sets combined were very similar, the LD blocks from both sets combined were adopted in the integrated map. A total of 43 LD blocks,
with an average length of 9.93 cM, were detected across all chromosome groups. The longest LD blocks, with approximate lengths of 64.96 and 87.41 cM, respectively, were observed on chromosomes 1B and 4B.
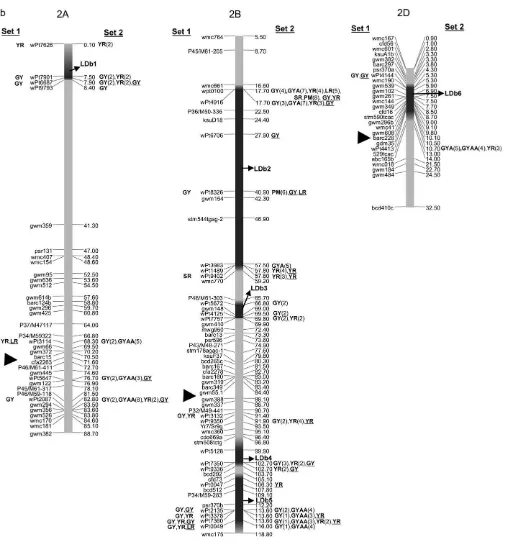
Linkage maps: The integrated maps with 1644 markers (813 DArT’s and 831 SSRs, AFLPs, or RFLPs) are displayed in supplemental Figures S1–S7 for chro-mosome groups 1–7, respectively, at http://www.genetics. org/supplemental/. Of the 813 DArT markers, only 318 were polymorphic in the 170 lines. Of these, 242 were located on the final integrated map, with 79, 149, and 20 DArT markers in genomes A, B, and D, respectively. No marker could be located on chromosome 6D due to low numbers of polymorphic DArT’sper seand to insufficient anchor markers among the segregating populations uti-lized for map development. Polymorphic markers on the remaining chromosomes ranged from 2 DArT’s on chromosome 5D to 20 DArT’s on chromosome 7B. The power of testing marker–trait associations is reduced using markers with low frequencies; however, this was not a problem in this study, as the average frequency of DArT polymorphisms was 0.57. A frequency ,5% for the absent score (‘‘zero’’ allele) was observed for only one marker (wpt9124). For graphical simplicity we present the reduced maps in Figure 2, a–g, where a subset of the 831 SSR, AFLP, and RFLP markers and all 242 DArT markers corresponding to each chromosome group 1–7, respectively, are included.
Population structure: Population structure was de-termined for each ESWYT individually. Model-based clustering analyses using the program STRUCTURE and the neighbor-joining clustering algorithm showed a pattern of substructure for ESWYT 20 only, which had seven subpopulations on the basis of the log-likelihood profile. Subsets of sister lines included in ESWYT 20 were assigned to the same subpopulation, except for the first subpopulation where three sister lines from differ-ent subsets were clustered. The STRUCTURE and neighbor-joining clustering algorithm analyses for the rest of the ESWYTs taken individually showed a pattern typical of unstructured populations. Taken as a set, the 76 lines contained in ESWYT set 1 were grouped into 16 subpopulations, while the 94 lines in ESWYT set 2 were grouped into 15 subpopulations (data not shown).
ofgintoaandicould not be fitted. For ESWYT set 1, PM was not included because no common sites or site– country combinations were found.
Several DArT markers on different chromosomes were significant for various traits simultaneously, and
many unmapped DArT markers were significant as well. Only the results of association analysis for ESWYT sets 1 and 2 and for both LMMs are shown. To facilitate description and interpretation of the results, reference to numbered LDb’s containing markers in LD is TABLE 1
Estimates of environment (s2e), genetic (s2g), genetic3environment (s2ge), and pooled within-site error (s2pool error) variances from a complete random-effect model of five traits, grain yield (GY), leaf rust (LR),
stem rust (SR), yellow (stripe) rust (YR), and powdery mildew (PM) for each of the ESWYTs and combined in ESWYT sets 1 and 2
Trait s2e s2g sge2 s2A s2AA s2pool error
ESWYT 1
GY 3.757 0.0757 0.1982 0.033 0.0742 0.4663
LR 22.87 59.65 61.79 — — 42.90
PM 2.473 — — — — 1.092
SR 56.94 20.66 69.91 — — 41.28
YR 57.40 0 230.8 — — 61.53
ESWYT 6
GY 3.717 0.0320 0.2383 0.0793 0.0583 0.5091
LR 90.98 8.826 235.4 — — 65.14
PM 1.721 0.0052 1.399 — — 1.257
SR 37.26 94.81 125.0 — — 58.16
YR 89.67 65.31 267.3 — — 64.31
ESWYT 10
GY 5.948 0.0543 0.2761 0.0767 0.0841 0.3442
LR 206.4 0 187.8 — — 10.95
PM 20.59 0.2527 1.363 — — 0.1371
SR — — — — — —
YR 530.8 96.31 237.6 — — 60.63
Combined ESWYTs 1, 6, 10 (set 1)
GY 0 0 1.171 — — 0.6942
LR 54.89 23.13 140.3 — — 98.16
PM 0 0.2090 1.296 — — 0.8705
SRa 58.48 53.02 60.33 — — 64.10
YR 203.7 281.9 232.0 — — 59.21
ESWYT 20
GY 4.713 0.0307 0.2879 0.1057 0.1062 0.5780
LR 103.1 37.26 85.64 — — 87.08
PM 1.358 0.7604 0.9025 — — 0.7412
SR — — — — — —
YR 26.20 177.0 114.8 — — 94.57
ESWYT 24
GY 5.303 0.0244 0.2592 0.2121 0.1680 0.4390
LR 374.6 11.23 26.73 — — 89.15
PM 4.981 0.3801 1.069 — — 1.775
SR 2.554 23.55 117.6 — — 86.40
YR 55.28 137.3 200.8 — — 75.59
Combined ESWYTs 20 24 (set 2)
GY 2.015 0.2968 0.1158 0.2943 0.2587 0.9439
LR 138.9 34.23 24.82 — — 89.84
PM 0.3492 0.5968 0.9166 — — 1.6256
SRa — — — — — —
YR 18.90 150.8 111.5 — — 125.7
Estimates are shown of additive plus additive3environment (s2A), additive3additive plus additive3additive3environment (s2AA) from LMM1 partitioning the total genotypic plus genotypic3environment effects (g) into additive plus additive3environment (a), and additive3additive plus additive3additive3environment (i) for GY (for ESWYT set 1 the LMM1 withg¼a1icould not be fitted).
a
Only ESWYTs 1 and 6 at set 1 and only ESWYT 24 at set 2.
frequently made. The LDb’s are highlighted in Figure 2, a–g.
Significant DArT markers for traits: The mapped and unmapped DArT markers significantly associated with LR, SR, PM, YR, and GY (including GYA and GYAA) for ESWYT sets 1 and 2 and for LMM1 and LMM2 are summarized in Tables 2–6. In addition, we present the most recently published information on the chromosomal locations of genes and quantitative trait loci (QTL) for LR, SR, PM, and YR resistance and for GY, including genes for photoperiod insensitivity (Ppd), vernalization (Vrn), earlinessper se(Eps), and dwarfism (Rht). Tables 2–6 summarize the information depicted in Figure 2, a– g. Significant DArT markers for YR and GY are widely spread across all chromosomes, with a total of 122 and 213 significantly associated DArT markers, respectively, vs.87, 63, and 61 significant DArT markers for LR, SR, and PM, respectively. Chromosome groups 4 and 5 had the lowest number of significant DArT markers across all traits (47 and 35, respectively), whereas chromosome groups 1, 2, 3, 6, and 7 had a total of 132, 64, 99, 85, and
83 significant DArT markers, respectively. A comparison among the A, B, and D genomes is of less interest due to the drastically different numbers of DArT markers that were polymorphic within each genome.
DISCUSSION
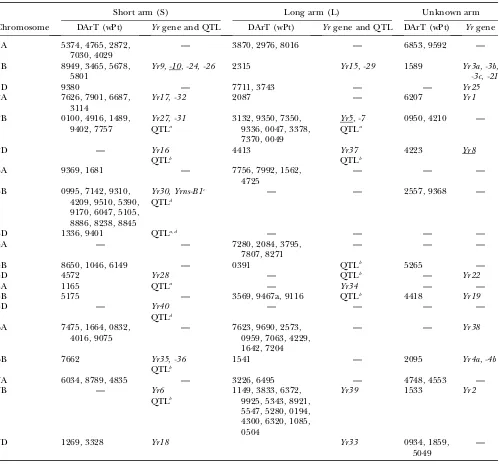
Association analysis for response to LR: More than 50 LR resistance genes have been cataloged in bread wheat; some of them have been reported or are known to be present in CIMMYT germplasm, includingLr1,-3, -3bg,-10,-13,-14a,-16,-17a,-19,-21,-23,-24,-26, -34,-42, and-46 and the complementary genes Lr27and Lr31 (Singh and Mcintosh 1984; Singhand Gupta 1991; Singhand Rajaram1991; Sayreet al.1998; Singhet al. 2005) (Table 2). Other known LR genes not known to be present in any of the lines included in this study are listed in Table 2. An objective of the CIMMYT wheat breeding program is to incorporate slow rusting re-sistance to LR and YR into breeding lines to assure long-term control of these diseases (Rajaram et al. 1988; Singhet al. 2005). Slow rusting resistance is conferred by Lr34, Lr46, and other genes with minor additive effects (Singhet al.2005). Several studies have identi-fied QTL associated with slow rusting resistance on other chromosomes (such as 7BL) (Table 2).
In this study, many of the DArT markers significantly associated with LR were in the same chromosome regions as previously reported LR resistance genes or previously reported QTL (Table 2). There were also regions accounting for LR resistance variation in which there were no previously known genes or QTL, such as 1AL, 1DL (Figure 2a), 5AS, 5DS (Figure 2e), 6AS, and 6AL (Figure 2f) (Table 2). Chromosome 1B had the largest number of significant markers for LR; some of them may be associated with the reported QTL and genesLr26andLr46. The 1B.1R translocation includes Lr26, YR resistance geneYr9, SR resistance geneSr31, and PM resistance genePm8; it has also shown an effect on GY (and its components) in several spring wheat cultivars (i.e., Seri M82, Genaro T81, Ures T81, and Veery-related lines) included in this study (Villareal
et al.1991; Singhet al. 1998). GeneLr46½pleiotropic or closely linked to Yr29 (William et al. 2003) and associated with PM (Lillemoet al. 2007)is present in cultivar Pavon 76 (included in this study) and associated with SSR markersgwm259,wmc44,wmc367, andbarc80 on 1BL (William et al. 2006). SSR gwm259 is not far from DArT markers wPt0944, wPt2526, and wPt4129 (Figure 2a), which are significant for LR.
Other significant associations include the one be-tween DArT wPt0100 and LR, which appears to relate to Lr16(Table 2) within the LDb2 of 2BS. ThisLrgene has been reported to be linked to wmc661 (McCartney
et al. 2005a) and is 1.1 cM from wPt0100 (Figure 2b). Four DArT markers were significantly associated with LR in 7BL (Figure 2g, Table 2) and could be detecting
Figure1.—Linkage disequilibrium (LD) (r2) as a function
Figure2.—Map with reduced number of markers including the 242 DArT and other markers. Significant markers are shown for leaf rust (LR), stem rust (SR), yellow rust (YR), powdery mildew (PM), grain yield (GY), additive GY (GYA), and additive3additive GY (GYAA) for ESWYT set 1 (left side of the chromosome), and ESWYT set 2 (right side of the chromosome) for linear model 1 (not underlined) and linear model 2 (underlined). Numbers in parentheses refer to the variability explained by the marker as a percentage of the total variability for linear model 1. (a) Chromosome group 1 (1A, 1B, 1D). (b) Chromosome group 2 (2A, 2B, 2D). (c) Chromosome group 3 (3A, 3B, 3D). (d) Chromosome group 4 (4A, 4B, 4D). (e) Chromosome group 5 (5A, 5B, 5D). (f) Chromosome group 6 (6A, 6B). (g) Chromosome group 7 (7A, 7B, 7D). Approximate position of the centromere is marked with<.
Lr14apresent in cultivar Esmeralda M86. In 7DS, the DArT wPt3328 is most likely detecting the slow rusting resistance geneLr34that is also linked or pleiotropic to Yr18. GeneLr34was present in 60% of CIMMYT bread wheat germplasm in the 1990s (Rajaramet al. 1997) and in several lines of this study (supplemental Table S1 at http://www.genetics.org/supplemental/). Gene Lr19 (linked toSr25), which is included in a Lophopyrum (Thinopyrum) translocation segment in 7DL was
prob-ably not detected due to lack of mapped DArT markers in that arm.
Association analysis for response to SR: The use of lines with the ‘‘Sr2 complex’’ (Sr2 gene together with other unknown minor genes) in the 1950s provided the foundation for durable resistance to SR (Ortiz et al. 2007a). Of almost 50 known SR resistance genes,Sr2is the only one conferring slow rusting resistance and is pre-sent in Pavon F76 and Veery-related lines (supplemental
Figure2.—Continued.
Figure2.—Continued.
Figure2.—Continued.
Table S1 at http://www.genetics.org/supplemental/). Few reports are available on the detection of QTL associated with SR resistance (Table 3).
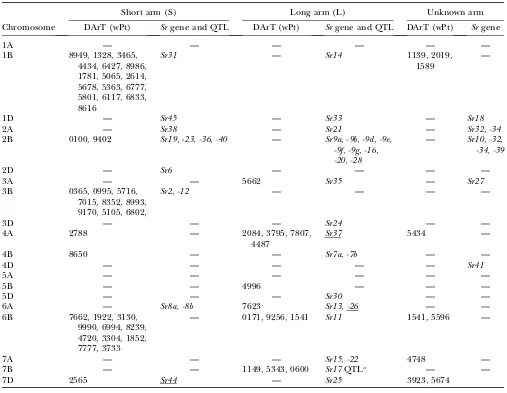
In this study, several DArT markers were found to be significantly associated with SR resistance (Table 3,
Figure 2, a–g). Many map to locations reported from pre-vious linkage mapping studies. In several regions (4BS, 5BL, and 6BS), DArT markers seem to be detecting un-designated SR resistance genes or QTL (Table 3). Sev-eral DArT markers in 1BS are most likely associated with TABLE 2
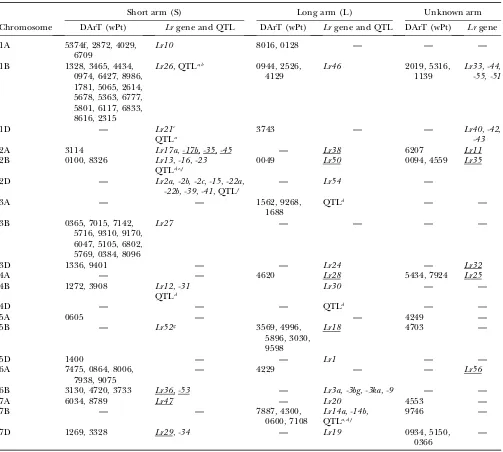
Location of the significant DArT markers associated with leaf rust found in ESWYT set 1 (ESWYTs 1, 6, 10) and ESWYT set 2 (ESWYTs 20 and 24) using linear mixed model 1 (LMM1) and linear mixed model 2 (LMM2)
for each chromosome and the reportedLrgenes and QTLs
Short arm (S) Long arm (L) Unknown arm
Chromosome DArT (wPt) Lrgene and QTL DArT (wPt) Lrgene and QTL DArT (wPt) Lrgene
1A 5374f, 2872, 4029,
6709
Lr10 8016, 0128 — — —
1B 1328, 3465, 4434,
0974, 6427, 8986, 1781, 5065, 2614, 5678, 5363, 6777, 5801, 6117, 6833, 8616, 2315
Lr26, QTLa,b 0944, 2526, 4129
Lr46 2019, 5316,
1139
Lr33,-44, -55,-51
1D — Lr21c
QTLa
3743 — — Lr40,-42,
-43
2A 3114 Lr17a,-17b,-35,-45 — Lr38 6207 Lr11
2B 0100, 8326 Lr13,-16,-23
QTLd,e,f
0049 Lr50 0094, 4559 Lr35
2D — Lr2a,-2b,-2c,-15,-22a,
-22b,-39,-41, QTLf
— Lr54 —
3A — — 1562, 9268,
1688
QTLd — —
3B 0365, 7015, 7142,
5716, 9310, 9170, 6047, 5105, 6802, 5769, 0384, 8096
Lr27 — — — —
3D 1336, 9401 — — Lr24 — Lr32
4A — — 4620 Lr28 5434, 7924 Lr25
4B 1272, 3908 Lr12,-31
QTLd
Lr30 — —
4D — — — QTLd — —
5A 0605 — — 4249 —
5B — Lr52g 3569, 4996,
5896, 3030, 9598
Lr18 4703 —
5D 1400 — — Lr1 — —
6A 7475, 0864, 8006,
7938, 9075
— 4229 — — Lr56
6B 3130, 4720, 3733 Lr36,-53 — Lr3a,-3bg,-3ka,-9 — —
7A 6034, 8789 Lr47 — Lr20 4553 —
7B — — 7887, 4300,
0600, 7108
Lr14a,-14b, QTLa,d,f
9746 —
7D 1269, 3328 Lr29,-34 — Lr19 0934, 5150,
0366
—
The locations ofLrgenes as per the USDA–ARS Cereal Disease Lab (http://www.ars.usda.gov/Main/docs.htm?docid¼10342) and other publications are shown. The significant DArT markers andLrgenes with unknown location are given in the last two columns. Underlined genes are not present or not known to be present in the lines included in this study.
a
Williamet al. (1997).
b
Schnurbuschet al. (2004).
c
Huanget al.(2003). d
Messmeret al.(2000).
e
Nelsonet al.(1997).
f
Xuet al.(2005). g
the presence ofSr31of the 1B.1R translocation, which is present in the Veery-related lines included in this study. In 2BS, wPt0100 was found to be associated with SR, GY, LR, and YR in ESWYT set 2, which agrees with the location of Sr23 and is tightly linked to Lr16. Several significant associations for SR were found on chromo-some 3BS, whereSr12andSr2are located.Sr2, linked to Lr27, is associated with SSR markers gwm389 and gwm533(Spielmeyeret al.2003) and distally located on the short arm where no DArT markers were mapped. It is, however, possible that the DArT markers wPt0365 and wPt0995 are associated with this gene (Table 3, Figure 2c). On chromosome 4AL, three DArT markers in LDb1 and one in LDb2 were associated with SR and could be associated with the presence ofSr7(Figure 2d).
At the end of 6BL, three DArT markers were associ-ated with SR in ESWYT set 1; they are most likely linked toSr11, a gene that is in turn linked toLr3(McIntosh
et al. 1995) that is present in a large number of CIMMYT cultivars (Roelfsand McVey1979), but to which viru-lence has evolved in most countries (this is probably why it was not found in ESWYT set 2) (McIntoshet al. 1995). Marker wPt0600 in 7BL could be associated with Sr17, which is found in a wide range of cultivars, including CIMMYT wheat lines, and which is linked to Lr14aandPm5. Marker wPt3328 in 7DS, corresponding to the position ofLr34/Yr18(Kerberand Aung1999), was not significant for SR in this study, despite the fact thatLr34has previously been associated with enhanced SR resistance.
TABLE 3
Location of the significant DArT markers associated with stem rust in ESWYT set 1 (ESWYTs 1, 6, 10) and ESWYT set 2 (ESWYTs 20 and 24) using linear mixed model 1 (LMM1) and linear mixed model 2 (LMM2) for each chromosome
and the reportedSrgenes and QTL
Short arm (S) Long arm (L) Unknown arm
Chromosome DArT (wPt) Srgene and QTL DArT (wPt) Srgene and QTL DArT (wPt) Srgene
1A — — — — — —
1B 8949, 1328, 3465,
4434, 6427, 8986, 1781, 5065, 2614, 5678, 5363, 6777, 5801, 6117, 6833, 8616
Sr31 — Sr14 1139, 2019,
1589
—
1D — Sr45 — Sr33 — Sr18
2A — Sr38 — Sr21 — Sr32,-34
2B 0100, 9402 Sr19, -23,-36,-40 — Sr9a,-9b,-9d,-9e,
-9f,-9g,-16, -20,-28
— Sr10,-32, -34,-39
2D — Sr6 — — — —
3A — — 5662 Sr35 — Sr27
3B 0365, 0995, 5716,
7015, 8352, 8993, 9170, 5105, 6802,
Sr2,-12 — — — —
3D — — — Sr24 — —
4A 2788 — 2084, 3795, 7807,
4487
Sr37 5434 —
4B 8650 — — Sr7a,-7b — —
4D — — — — — Sr41
5A — — — — — —
5B — — 4996 — — —
5D — — — Sr30 — —
6A — Sr8a,-8b 7623 Sr13,-26 — —
6B 7662, 1922, 3130,
9990, 6994, 8239, 4720, 3304, 1852, 7777, 3733
— 0171, 9256, 1541 Sr11 1541, 5596 —
7A — — — Sr15,-22 4748 —
7B — — 1149, 5343, 0600 Sr17QTLa — —
7D 2565 Sr44 — Sr25 3923, 5674
The locations ofSrgenes as per the USDA–ARS Cereal Disease Lab (http://www.ars.usda.gov/Main/docs.htm?docid¼10342) and other publications are shown. The significant DArT markers andSrgenes with unknown location are given in the last two columns. Underlined genes are not present or not known to be present in the lines included in this study.
a
Fariset al. (1999).
Association analysis for response to yellow rust (YR):
According to Suenagaet al. (2003), there is significant diversity for genes that have minor to intermediate ad-ditive effects on YR resistance. Adult plant resistance to YR and LR in CIMMYT wheat is based on several genes with minor effects, includingYr18(pleiotropic or closely linked toLr34), Yr29 (pleiotropic or closely linked to Lr46), andYr30, which have been deployed to provide a more durable solution against YR (Singhet al. 2005). In addition, of the known seedling YR resistance genes, those reported in CIMMYT wheat lines are, for example, Yr9(in the 1B.1R translocation),Yr3,Yr1,Yr2,Yr27,Yr7, andYr6(McIntoshet al. 1995). In this study, association with YR was found in all chromosomes where DArT markers have been mapped, except at 5D (Table 4). Sev-eral significant DArT markers were found in regions where no YR resistance genes or QTL had been reported previously:i.e., 1AS, 1AL, 1DS, 1DL, 2AL, 3AS, 3AL, 4AL, 4BS, 5BS, 6AS, 6AL, 6BL, 7AS, and 7AL (Table 4).
Some significant DArT markers proved to be associ-ated with known YR resistance genes, such asYr24at 1B, which is allelic toYr26and closely linked tobarc187(Li
et al.2006) (Figure 2a). Boukhatemet al.(2002) iden-tified two major QTL for durable YR resistance on chro-mosome 2B, of which one was present in Opata 85 and mapped near the SSR markergwm410. This marker is also present in LDb3 with wPt7757, which is significantly associated with YR (Figure 2b, Table 4). On 2DL, a QTL associated with a reduction in YR infection type was re-ported to be linked to markergwm349(Mallardet al. 2005), which in our study is3 cM from wPt4413 (Fig-ure 2b, Table 4). In addition, Suenagaet al.(2003) de-tected a QTL associated with YR resistance close to markergwm349on 2DL (Figure 2b) within LDb6 near DArT marker wPt4413.Yr30, at 3BS, has been reported to be linked toSr2andLr27, and to SSR markergwm533 (Spielmeyeret al.2003), and may be marked by wPt0995 and other DArT markers at LDb3 (Figure 2c) (it is pres-ent in Opata 85 and Pavon F76, included in this study). Singhet al.(2000) and Boukhatemet al.(2002) iden-tified a region on chromosome 3DS associated with YR in Opata 85, which could have been identified by wPt1336 and wP19401.
A QTL for adult plant YR resistance in 4BL was linked to SSRswmc48candgwm513(Suenagaet al.2003). In our study, marker wPt6149 was significantly associated with YR and located between these two markers (Figure 2d). A QTL for adult plant YR resistance in 4D was asso-ciated with markerpsp3103(Suenagaet al.2003), which is 8.4 cM from wPt4572 that is significant for YR (Figure 2d). The same authors identified a QTL for YR resis-tance in 5BL between SSRsgwm335andgwm777, where several DArT markers were significantly associated with YR (Table 4, Figure 2e) (see supplemental Figure S15 at http://www.genetics.org/supplemental/ for the location ofgwm777on the map including all markers). The only reported gene on chromosome 6A isYr38, which was
recently transferred into wheat fromAegilops sharonensis (Maraiset al. 2006). In contrast, this study found several linked and unlinked DArT markers significantly associ-ated with YR on chromosome 6A in both ESWYT sets. These results indicate the presence of unknown YR re-sistance genes or alleles on this chromosome. On 7B, Suenagaet al.(2003) identified a QTL linked to SSRs gwm333 andgwm46, which in our study are located at LBb4 near wPt1149, wPt3833, and wPt6372, all of which were significantly associated, among others, to YR (Table 4, Figure 2g). At 7D, the adult plant resistance geneYr18 is most likely being detected by DArTwPt3328 or wPt1100 (Figure 2g).
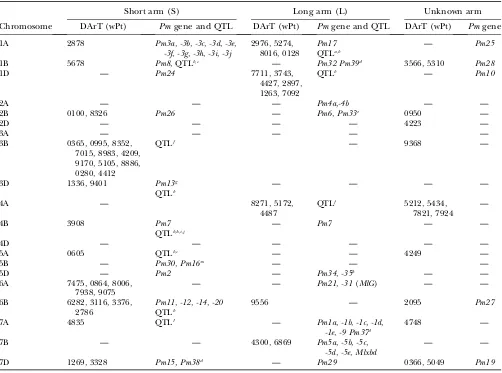
Association analysis for response to PM: CIMMYT bread wheat germplasm is generally susceptible to PM due to the lack of natural epidemics ofB. graminisf.sp. triticiin Mexico. Hence, there has not been direct selec-tion for resistance against this pathogen in the breeding program. There is, however, considerable genetic vari-ation for PM resistance in CIMMYT germplasm, as in-dicated by the many significant DArT markers associated with the trait in this study. Most of the significant chro-mosomal areas for PM resistance were associated with knownPmgenes or QTL (Table 5). For example, the sig-nificant markers on chromosome arms 1BS, 1DL, 2BS, 3DS, 6AS, and 7BL correspond to the locations ofPm8, Pm24,Pm26,Pm13,Pm31, andPm5, respectively, and the groups of significant markers for PM resistance on 1AL, 3BS, 4AL, 6BS, and 7DS correspond to reported QTL (Table 5). Recently, Nematollahiet al.(2007) detected PM resistance allelePm5dat 7BL near SSRsgwm577and wmc 581. These two SSRs are located in the same LDb6 of 7BL on our map (Figure 2g), where wPt6869, significant for PM, was found (and near wPt4300, significant for PM). There were also many significant DArT markers located in areas where noPmgene or QTL had been re-ported previously,e.g., wPt2872 on 1AS, wPt4427-wPt7092 on 1DL, wPt4412 on 3BL, wPt9256 on 6BL, and wPt1085-wPt6869 on 7BL.
It is interesting to note that all the chromosomal areas that showed a significant effect on PM in this study also harbored genetic factors for resistance to at least one of the three rust diseases. This indicates that the PM resis-tance at these loci might have been indirectly selected for by selection for LR or YR. For example, the race-specific resistance gene Pm8is co-inherited with Sr31, Lr29, andYr9in the 1B.1R translocation, and thePm5 locus on 7BL is linked to Sr17 and Lr14. Such co-inheritance of resistance to PM and the rust diseases is also evident for race nonspecific adult plant resistance. For example, the Lr34/Yr18 locus on 7DS has been shown to confer partial resistance to PM (Spielmeyer
whereas this analysis failed to detect any effect ofPm39 on 1BL.
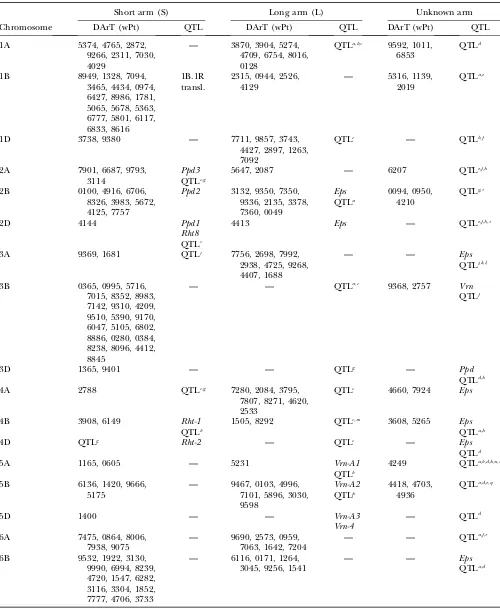
Association analysis for GY: The genetics of yield and yield components in bread wheat are complex in nature and controlled by a large number of major and minor QTL (Kumar et al. 2007). Dispersion of genes
affecting GY across the wheat genome appears to be a characteristic feature (Laperche et al. 2007) that was also observed in this study (Table 6). In this study, 213 DArT markers (or 88% of the mapped markers) were significantly associated with GY. About 58% of the sig-nificant DArT markers for GY mapped to the B genome, TABLE 4
Location of the significant DArT markers associated with yellow rust found in ESWYT set 1 (ESWYTs 1, 6, 10) and ESWYT set 2 (ESWYTs 20 and 24) using linear mixed model 1 (LMM1) and linear mixed model 2 (LMM2) in each chromosome
and the reportedYrgenes and QTL
Short arm (S) Long arm (L) Unknown arm
Chromosome DArT (wPt) Yrgene and QTL DArT (wPt) Yrgene and QTL DArT (wPt) Yrgene
1A 5374, 4765, 2872,
7030, 4029
— 3870, 2976, 8016 — 6853, 9592 —
1B 8949, 3465, 5678,
5801
Yr9,-10,-24,-26 2315 Yr15,-29 1589 Yr3a,-3b,
-3c,-21
1D 9380 — 7711, 3743 — — Yr25
2A 7626, 7901, 6687,
3114
Yr17,-32 2087 — 6207 Yr1
2B 0100, 4916, 1489,
9402, 7757
Yr27,-31 QTLa
3132, 9350, 7350, 9336, 0047, 3378, 7370, 0049
Yr5,-7 QTLa
0950, 4210 —
2D — Yr16
QTLb
4413 Yr37
QTLb
4223 Yr8
3A 9369, 1681 — 7756, 7992, 1562,
4725
— — —
3B 0995, 7142, 9310,
4209, 9510, 5390, 9170, 6047, 5105, 8886, 8238, 8845
Yr30, Yrns-B1c QTLd
— — 2557, 9368 —
3D 1336, 9401 QTLa,d — — — —
4A — — 7280, 2084, 3795,
7807, 8271
— — —
4B 8650, 1046, 6149 — 0391 QTLb 5265 —
4D 4572 Yr28 — QTLb — Yr22
5A 1165 QTLa — Yr34 — —
5B 5175 — 3569, 9467a, 9116 QTLb 4418 Yr19
5D — Yr40
QTLd
— — — —
6A 7475, 1664, 0832,
4016, 9075
— 7623, 9690, 2573,
0959, 7063, 4229, 1642, 7204
— — Yr38
6B 7662 Yr35,-36
QTLb
1541 — 2095 Yr4a,-4b
7A 6034, 8789, 4835 — 3226, 6495 — 4748, 4553 —
7B — Yr6
QTLb
1149, 3833, 6372, 9925, 5343, 8921, 5547, 5280, 0194, 4300, 6320, 1085, 0504
Yr39 1533 Yr2
7D 1269, 3328 Yr18 Yr33 0934, 1859,
5049
—
The locations ofYrgenes as per the USDA–ARS Cereal Disease Lab (http://www.ars.usda.gov/Main/docs.htm?docid¼10342) and other publications are shown. The significant DArT markers andYrgenes with unknown location are given in the last two columns. Underlined genes are not present or not known to be present in the lines included in this study.
a
Boukhatemet al. (2002).
b
Suenagaet al. (2003).
c
Bo¨ rneret al. (2002).
d
Singhet al. (2000).
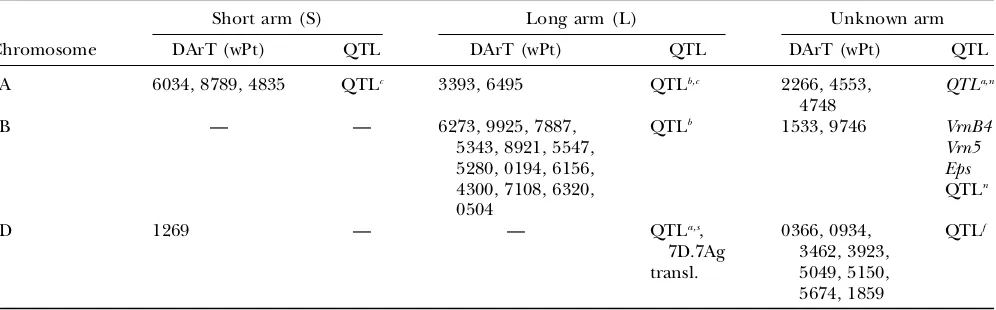
31% to the A genome, and 11% to the D genome. A large proportion of significant DArT markers for GY were located on chromosomes 1B, 3B, and 6B, and no DArT markers on chromosome 4D were significantly associated with GY. Many of the DArT markers found to be significantly associated with GY map to regions pre-viously reported for this trait (see discussion below).
This study suggests that chromosomes 1AS, 1BS, 1BL, 1DS, 2AL, 3AL, 3BS, 5AS, 5DS, 6AS, 6AL, 6BS, 6BL, and 7DS (Table 6, Figure 2, a–g) contain regions affecting GY that have not been reported previously. Some of these regions may provide increases in GY due not only to additive effects but also to additive3additive inter-action effects.
TABLE 5
Location of the significant DArT markers associated with powdery mildew found in ESWYT set 1 (ESWYTs 1, 6, 10) and ESWYT set 2 (ESWYTs 20 and 24) using linear mixed model 1 (LMM1) and linear mixed model 2 (LMM2) for each chromosome
and the reportedPmgenes and QTL
Short arm (S) Long arm (L) Unknown arm
Chromosome DArT (wPt) Pmgene and QTL DArT (wPt) Pmgene and QTL DArT (wPt) Pmgene
1A 2878 Pm3a,-3b,-3c,-3d,-3e,
-3f,-3g,-3h,-3i,-3j
2976, 5274, 8016, 0128
Pm17
QTLa,b
— Pm25
1B 5678 Pm8, QTLb,c — Pm32 Pm39d 3566, 5310 Pm28 1D — Pm24 7711, 3743,
4427, 2897, 1263, 7092
QTLb — Pm10
2A — — — Pm4a,-4b — —
2B 0100, 8326 Pm26 — Pm6,Pm33e 0950 —
2D — — — — 4223 —
3A — — — — —
3B 0365, 0995, 8352, 7015, 8983, 4209, 9170, 5105, 8886, 0280, 4412
QTLf — 9368 —
3D 1336, 9401 Pm13g QTLb
— — — —
4A — 8271, 5172, 4487
QTLf 5212, 5434, 7821, 7924
—
4B 3908 Pm7
QTLb,h,i,j
— Pm7 — —
4D — — — — — —
5A 0605 QTLb,c — — 4249 —
5B — Pm30,Pm16m — — —
5D — Pm2 — Pm34,-35k — — 6A 7475, 0864, 8006,
7938, 9075
— — Pm21,-31(MlG) — —
6B 6282, 3116, 3376, 2786
Pm11,-12,-14,-20
QTLb
9556 — 2095 Pm27
7A 4835 QTLl — Pm1a,-1b,-1c,-1d,
-1e,-9 Pm37d
4748 —
7B — — 4300, 6869 Pm5a,-5b,-5c,
-5d,-5e,Mlxbd
— —
7D 1269, 3328 Pm15, Pm38d — Pm29 0366, 5049 Pm19
Locations are from Huang and Ro¨ der (2004), other publications, and personal communications. The significant DArT markers andPmgenes with unknown location are given in the last two columns.
a
Mingeotet al. (2002).
b
Kelleret al. (1999).
c
Jakobsonet al. (2006).
d
R. A. McIntosh(personal communication). e
Zhuet al. (2005). f
Bougotet al. (2006).
g
Cenciet al. (1999). h
Bo¨ rneret al. (2002).
i
Lianget al. (2006). j
Lillemoet al. (2006).
k
Mirandaet al.(2006, 2007).
l
Chantretet al. (2001).
m
The results of this study, highlighting chromosomal regions affecting GY, are supported by results of pre-vious studies, including the following:
1. One major allele for increased GY was identified on chromosome 2B neargwm410.This yield effect may be linked to a QTL for stay green found on 2B, which has been shown to improve yield under both drought stress and optimal conditions (Vermaet al. 2004). In the present study, in ESWYT set 2, GY was signifi-cantly associated with markers wpt5672, wPt4125, and wPt7757 in LDb3 (wheregwm410is located) (Fig-ure 2b).
2. Kumar et al. (2007) found consistent QTL on 2DS linked to SSRgwm261for five yield traits. In our study, markergwm261was found in LDb6 of 2D at2.20 cM from wPt4144, which was associated with yield in ESWYT set 1 (Figure 2b).
3. Dilbirligiet al. (2006) found that markerbarc12on chromosome arm 3AS was associated with GY. In our study,barc12was positioned at 3AL but located near wPt4725 and wPt9262, which were significant for GY, YR, and LR. Also in the present study, five DArT markers in LDb1 on chromosome arm 3AS (Figure 2c) were associated with GY.
4. On chromosome 7, Kumaret al. (2007) identified two regions associated with GY at 7AS (intervalgwm130– gwm1171) and at 7AL (intervalgwm332–gwm698). The region at 7AS and markergwm130coincides with the location of wPt6034 and wPt8789 (LDb1), which were significant for GY, and the region in 7AL within LDb2 containedgwm698and also wPt6495, which was significant for GY in ESWYT set 1 (Figure 2g). 5. A QTL for GY was mapped to 4AS near markerwmc48
(McCartneyet al. 2005b). Our complete map (sup-plemental Figure S4 at http://www.genetics.org/ supplemental/) showswmc48to be located 13.4 cM from wPt2788 (Figure 2d) and significantly associ-ated with GY.
6. Clusters of QTL for GY and yield components mapped to 1D, 2A, 6B, and 7D in Liet al. (2007). DArT marker wPt3738 on 1D in our map is significantly associated with GY; however, this region in our map is closer to SSRgwm642than was reported by Liet al. (2007). Li’s cluster of QTL at 2A may coincide with wPt7901, wPt6687, and wPt9793 at 2AS (Figure 2c), and Li’s QTL at 6B is neargwm132, which in Figure 2c is20 cM from several significant DArT markers for GY. Finally, the QTL at 7D seems to be distally associated with wPt1269 at 7DS in our map; nevertheless, this may be due to the relatively small number of DArT markers mapping to this chromosome.
Lines carrying the 1B.1R translocation show increased GY (Carver and Rayburn 1994), which may explain the significant associations found between GY and DArT markers mapping to the long arm of chromosome 1B (Figure 2a). The 7DL.7Agtranslocation segment,
asso-ciated with GY increase under irrigated conditions and GY decrease in unfavorable environments (Braunet al. 1996; Singhet al.1998), was not detected in this study. CIMMYT wheat lines are selected for consistently high performance under many diverse growing conditions and so may not have positive selection either for or against this translocation.
The short-stature wheats containing dwarfingRhtgenes have been associated with high GY (Trethowanet al. 2007). Our study shows significant associations with GY for known chromosomal regions bearing the dwarfing allelesRht-B1andRht8genes (Ortizet al.2007b). (Table 6). While all CIMMYT semidwarf bread wheats are ex-pected to carry Rht-B1bor Rht-D1b, it was shown that a height-promoting allele at the Rht8 locus is also fre-quently present in CIMMYT wheats, and it is speculated that this allele might confer an adaptive advantage by partially counteracting the dramatic effects of Rht-B1b andRht-D1b(Worlandet al.2001).
The importance for GY of earlinessper se(Eps), photo-period insensitivity (Ppd), and vernalization (Vrn) genes was indicated by our study. The anthesis rate in wheat also depends on the variation inEps,Ppd, andVrngenes (VanBeemet al.2005).Vrngenes are common in CIMMYT bread wheat germplasm, whereasEpsgenes occur only at low frequencies. Chromosomal regions bearing these genes were significantly associated with QTL for GY, as revealed by DArT markers in both ESWYT sets included in this study (Table 6).
Association between all traits: Markers for many of the traits studied here were found to be colocalized in the same genomic regions, as well as often significantly as-sociated. Multiple regression of GY on the disease traits shows that only variability for LR and PM significantly contributes to GY variability, with a coefficient of deter-mination of 22%. Significant (P#0.05) rank correlations (rS) were found for the following pairs of traits across the ESWYTs: GY and YR (rS¼ 0.23), SR and YR (rS¼ 0.45), LR and YR (rS¼0.40), LR and PM (rS¼0.37), and YR and PM (rS¼0.34). These results indicate that the YR-resistant wheat lines included in this study were often resistant to SR, LR, and PM as well. In addition, the lines that showed the highest susceptibility to YR also dis-played lower GY due to a significant negative correlation. In ESWYTs 1 and 6, significant associations were found between SR and YR (rS¼0.60 and 0.55, respectively). In ESWYT 6, associations were also found between SR and PM (rS¼0.40) and YR and PM (rS¼0.46). In ESWYT 10, a significant rank correlation was found between SR and YR (rS¼ 0.46). In ESWYT 20, significant associations were found between GY and YR (rS¼ 0.40), GY and PM (rS¼ 0.43), SR and LR (rS¼0.34), and LR and YR (rS¼
0.47). In ESWYT 24, significant associations were found between LR and PM (r¼0.35) and LR and YR (rS¼0.35) (data not shown).
Several DArT markers were associated with more than one trait investigated in our study. Several resistance genes
TABLE 6
Location of the significant DArT markers associated with grain yield found in ESWYT set 1 (ESWYTs 1, 6, 10) and ESWYT set 2 (ESWYTs 20 and 24) using linear mixed model 1 (LMM1) and linear mixed
model 2 (LMM2) for each chromosome and the reported QTL
Short arm (S) Long arm (L) Unknown arm
Chromosome DArT (wPt) QTL DArT (wPt) QTL DArT (wPt) QTL
1A 5374, 4765, 2872,
9266, 2311, 7030, 4029
— 3870, 3904, 5274, 4709, 6754, 8016, 0128
QTLa,b,c 9592, 1011, 6853
QTLd
1B 8949, 1328, 7094,
3465, 4434, 0974, 6427, 8986, 1781, 5065, 5678, 5363, 6777, 5801, 6117, 6833, 8616
1B.1R transl.
2315, 0944, 2526, 4129
— 5316, 1139,
2019
QTLa,e
1D 3738, 9380 — 7711, 9857, 3743,
4427, 2897, 1263, 7092
QTLc — QTLb,f
2A 7901, 6687, 9793,
3114
Ppd3 QTLc,g
5647, 2087 — 6207 QTLe,f,h
2B 0100, 4916, 6706,
8326, 3983, 5672, 4125, 7757
Ppd2 3132, 9350, 7350, 9336, 2135, 3378, 7360, 0049
Eps QTLa
0094, 0950, 4210
QTLg,i
2D 4144 Ppd1
Rht8 QTLc
4413 Eps — QTLe,f,h,i
3A 9369, 1681 QTLj 7756, 2698, 7992,
2938, 4725, 9268, 4407, 1688
— — Eps
QTLj,k,l,
3B 0365, 0995, 5716,
7015, 8352, 8983, 7142, 9310, 4209, 9510, 5390, 9170, 6047, 5105, 6802, 8886, 0280, 0384, 8238, 8096, 4412, 8845
— — QTLa,c 9368, 2757 Vrn
QTLf
3D 1365, 9401 — — QTLg — Ppd
QTLd,h
4A 2788 QTLc,g 7280, 2084, 3795,
7807, 8271, 4620, 2533
QTLc 4660, 7924 Eps
4B 3908, 6149 Rht-1
QTLb
1505, 8292 QTLc,m 3608, 5265 Eps
QTLa,h
4D QTLg Rht-2 — QTLc — Eps
QTLd
5A 1165, 0605 — 5231 Vrn-A1
QTLb
4249 QTLa,b,d,h,n,o
5B 6136, 1420, 9666,
5175
— 9467, 0103, 4996, 7101, 5896, 3030, 9598
Vrn-A2 QTLp
4418, 4703, 4936
QTLa,d,e,q
5D 1400 — — Vrn-A3
Vrn-4
— QTLd
6A 7475, 0864, 8006,
7938, 9075
— 9690, 2573, 0959, 7063, 1642, 7204
— — QTLa,f,r
6B 9532, 1922, 3130,
9990, 6994, 8239, 4720, 1547, 6282, 3116, 3304, 1852, 7777, 4706, 3733
— 6116, 0171, 1264, 3045, 9256, 1541
— — Eps
QTLa,d
(R genes) affecting different diseases have been reported to be clustered in specific regions of the genome, such asLr20-Sr15-Pm1(Neuand Keller2002). These clusters of R genes are important breeding targets, because the transfer of such a region results in resistance to several pathogens simultaneously (Neuand Keller2002). Pleio-tropy or linkage between adult plant resistance genes for different pathogens has also been reported. For exam-ple, Lr34 is completely linked or pleiotropic to Yr18, which is also linked to a gene conditioning tolerance to barley yellow dwarf virus (Bydv1) (Singh1993) and to PM resistance (Spielmeyeret al. 2005; Lillemoet al. 2007). In this study, associations between disease resistance and GY were probably caused by the reduction in yield loss due to susceptibility, since only variability for LR and PM significantly contributed to GY variability, explaining 22% of GY variation. This result indicates that ESWYT mate-rials maintained a relatively high level of overall disease resistance, with abiotic factors presumably accounting for most of the variation.
Implicit marker effects in statistical models: The fixed effects of markers are implicitly considered when comparing the BLUPs of the lines obtained from LMM1 by using the variance–covariance matrix of the BLUPs. Modeling the marker effects in this manner has two ad-vantages over the model that explicitly includes markers as fixed effects: (1) information contained in relation-ship matrixAis fully exploited, as its effect is reflected in the BLUPs of the lines (and in their variance–covariance matrix) and, thus, in the contrast for each marker in each subpopulation and across subpopulations; and (2) LMM1 can be fitted to avoid nonidentification and overparam-eterization. This last issue is more of a problem when some lines lack data for some markers. Another point worth mentioning is that since markers represent attri-butes of lines, an appropriate model would include lines nested within markers (Malosettiet al. 2007) and within subpopulations. When markers are explicitly included in LMM1 and LMM2 as fixed (or random) effects, it is not clear how the effect of relationship matrix A (or TABLE 6
(Continued)
Short arm (S) Long arm (L) Unknown arm
Chromosome DArT (wPt) QTL DArT (wPt) QTL DArT (wPt) QTL
7A 6034, 8789, 4835 QTLc 3393, 6495 QTLb,c 2266, 4553,
4748
QTLa,n
7B — — 6273, 9925, 7887,
5343, 8921, 5547, 5280, 0194, 6156, 4300, 7108, 6320, 0504
QTLb 1533, 9746 VrnB4
Vrn5 Eps QTLn
7D 1269 — — QTLa,s,
7D.7Ag transl.
0366, 0934, 3462, 3923, 5049, 5150, 5674, 1859
QTLf
Other loci associated with grain yield in wheat areEps(earlinessper se) (Worland1996; VanBeemet al.2005),Ppd (photo-period insensitivity) (Worland1996; Worlandet al.1998; VanBeemet al.2005),Rht(semidwarf plant height) (Korzunet al. 1998; Elliset al.2002), andVrn(vernalization) (Worland1996; Barretet al.2002; Yanet al.2003; VanBeemet al.2005).
a
Marzaet al.(2006). b
Quarrieet al.(2005, 2006).
c
Kumaret al. (2007). d
Huanget al. (2004). e
Huanget al. (2003). f
Liet al. (2007). g
McCartneyet al. (2005b).
h
Lapercheet al.(2007).
i
Vermaet al. (2004). j
Dilbirligiet al. (2006).
k
Aliet al. (2007). l
Campbellet al. (2003, 2004).
m
Kirigwiet al. (2007).
n
Huanget al. (2006). o
Katoet al. (2000). p
Miuraet al.(1992). q
Gonzalez-Hernandezet al. (2004).
r
Snapeet al. (2007). s
Grooset al.(2003).
kinship matrixK, in case markers are being used) would be reflected in the contrasts of the BLUPs of the lines in each subpopulation. Furthermore, aliasing problems due to ambiguities in the model are often encountered when including (1) markers as fixed (or random) effects, (2) the use of relationship matrixAfor modelingGE, and (3) information from theQmatrix (as fixed or random covariables). Marker effects andQmatrix values are re-lated; therefore, it would be advisable to calculate sub-matricesAfor each marker and each subpopulation in matrixQ.
A statistical model that explicitly includes subpopu-lations, markers, and lines must consider (1) the main effect of markers and the interaction of marker3 en-vironment, (2) the main effect of subpopulations and its interaction with environments, and (3) the main effects of lines nested within subpopulations and markers and their interaction with environments. Interaction effects can be estimated separately or combined with principal effects (i.e., markers could be estimated separately or com-bined with marker3environment interaction). Never-theless, this implies that for each marker type only the COP (or kinshipK) of the lines included at each level of the marker must be considered, and lines with no mark-ers must not be included in the model. Without clear separation and definition of these terms, ambiguity in the linear mixed model will lead to aliasing in the esti-mation process. Model LMM1 draws on an independent source of information for measuring the covariance among relatives (from matrixA) and uses information on pop-ulation structure (from matrixQ) only as weights in the contrast of the BLUPs of the lines for each marker. When information fromQis included in the model as fixed covariates, then marker effects are estimated (or pre-dicted) at a certain value of the covariates; however, it is not clear what that value is.
The models used in this study include the relation-ship matrix and the population structure of each ESWYT and of the two ESWYT sets. Yuet al. (2006) found that incorporating the outcome of population structure con-tained in theQmatrix increases the power to detect true marker–trait association. In addition, Piepho (2005) shows that genetic correlations (for QTL and QTL3 en-vironment interaction) in multienen-vironment trials lead to a substantial increase of the type I error rate when test-ing for QTL effects. On the basis of these findtest-ings, we can conclude that, by using LMM1 and LMM2, the risk of finding false marker–trait associations was reduced. The application of appropriate statistical models for as-sessingGEis useful in plant breeding (Sorrells2007) and should be adopted in association analysis studies. Statistical models other than LMM1 and LMM2 should be further studied.
Conclusions: Results from this study show DArT markers significantly associated with the measured traits in chromosomal regions where genes or QTL have been previously reported, as well as significantly associated
DArT markers in regions where neither genes nor QTL have previously been reported for these traits. The role of these regions will need to be further investigated. The consensus map used in this study has proven to be suffi-ciently precise to compare the locations of DArT markers from this study with those of other markers (e.g., SSRs) previously reported. Several of the known cataloged genes, such asLr47, were recently transferred from alien or re-lated species and thus are not expected to be present in the material included in this study. However, it cannot be excluded that noncataloged corresponding homologs of these alien loci could be present in the wheat lines investigated in this study, and that they could have some effect in reducing disease severity. For example, the markers on 7AS could be tagging a homolog of theLr47 locus rather than a completely new LR resistance gene. It is also likely that many of these gene-rich regions will carry previously unidentified minor slow rusting or adult plant resistance genes.
The historical phenotypic data used in this study were collected from many different environments worldwide, which led toGEeffects being observed for all traits. Par-titioning the total genetic effect into additive and addi-tive3additive effects used in association analysis could be an added advantage for identifying significant markers associated with phenotypic traits with these effects, which will facilitate further genetic enhancement of the crop. Concerning the disease traits, the variation of the path-ogen races occurring at different locations is likely to re-duce the identification of race-specific resistance. Most of the known cataloged genes are race specific and effec-tive only in some geographic areas. In this study, these pathogens may not have been present at high frequen-cies in the years of evaluation at many locations. For example,Lr3a, which occurs in several CIMMYT wheat lines, could not be identified in this study (at least in ESWYT set 2) because virulence to this gene is common worldwide. Virulence to Lr1 is also common in most wheat-growing areas, and the gene would have been difficult to detect even if more markers had mapped to the chromosome containing Lr1. Loss of effectiveness due to the presence of virulent races is probably the rea-son why we could not detect the chromosomal regions of some genes known to be present in CIMMYT wheat materials. Only a few genes, such as Lr34/Yr18,Lr46/ Yr29, andYr30/Sr2, are nonrace specific in nature and should have small-to-intermediate effects across different environments. Analyses did, in fact, identify chromo-somal regions carrying the above genes. Finally, differ-ences and similarities between ESWYT sets 1 and 2 track genetic changes in the CIMMYT wheat breeding pro-gram over the past 24 years, and further analyses will shed greater light on the genetic determinants of GY and disease resistance in an evolving context.